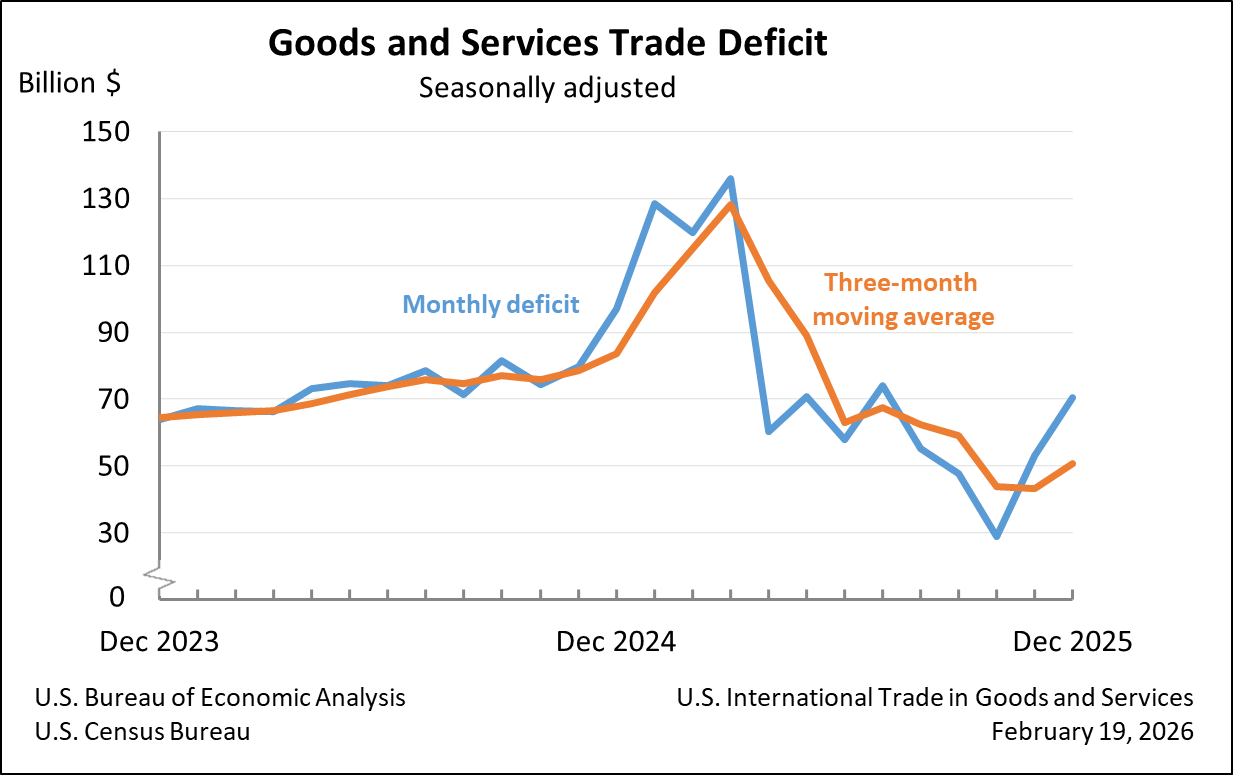
The United States experienced a significant widening of its trade deficit in goods and services in December 2025, reaching $70.3 billion. This figure represents a substantial increase of $17.3 billion from the revised November deficit of $53.0 billion, according to the latest report released by the U.S. Census Bureau and the U.S. Bureau of Economic Analysis (BEA) on February 19, 2026. This latest data comes with a critical update, as Exhibit 15 of the report was revised at 3:30 p.m. EST on the same day to correct statistical figures for "Total Balance of Payments Basis" and "Net Adjustments" for November, December, and the entirety of 2025. The report’s release was also subject to delays due to a recent lapse in federal funding.
December Trade Deficit Surge Driven by Goods and Services
The December trade deficit of $70.3 billion marked a 32.6% increase compared to the previous month. This deterioration was fueled by a notable contraction in exports and a concurrent expansion in imports. December exports of goods and services totaled $287.3 billion, a decrease of 1.7% from November. Conversely, imports surged by 3.6% to $357.6 billion.
Breaking down these figures further, the increase in the overall goods and services deficit was primarily driven by a $15.7 billion escalation in the goods deficit, which reached $99.3 billion in December. This was partially offset by a $1.6 billion decrease in the services surplus, which stood at $29.0 billion.
On a seasonally adjusted basis, exports of goods saw a decrease of $5.5 billion to $180.8 billion in December. This decline was attributed to a $5.6 billion drop in goods exports on a Census basis, with net balance of payments adjustments increasing by $0.1 billion. Meanwhile, exports of services experienced a modest increase of $0.5 billion, reaching $106.5 billion.
Imports of goods, on the other hand, saw a significant increase of $10.2 billion, bringing the total to $280.2 billion. Imports of goods on a Census basis also rose by $10.2 billion, with net balance of payments adjustments showing a minimal increase of less than $0.1 billion. Imports of services also contributed to the widening deficit, increasing by $2.0 billion to $77.4 billion in December.
The real goods deficit, measured in 2017 dollars on a Census basis, widened by 14.8% to $97.1 billion in December, a more pronounced increase than the 19.0% rise in the nominal goods deficit. This suggests that inflationary pressures, while present, did not fully account for the increased real value of goods being imported relative to exported.
Annual Performance in 2025 Shows Slight Improvement Despite December Dip
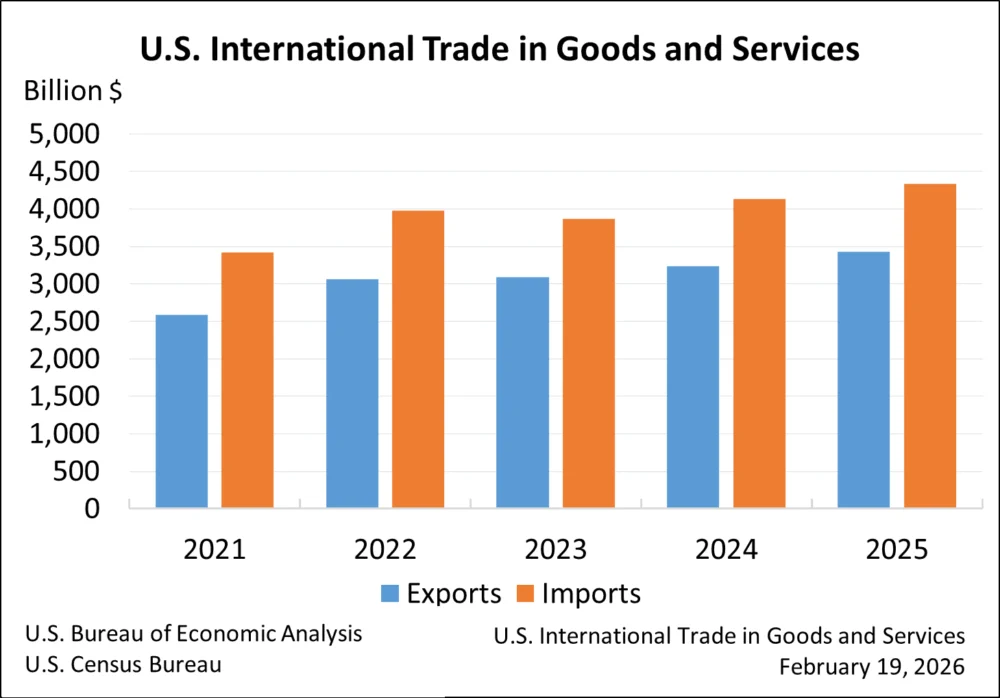
Despite the sharp deterioration in the December trade balance, the annual figures for 2025 present a more nuanced picture. For the full year 2025, the goods and services deficit was $901.5 billion, a slight decrease of $2.1 billion from the $903.5 billion recorded in 2024. This marginal improvement suggests that while monthly fluctuations can be significant, the overall trend for the year indicated a stabilization or minor reduction in the trade imbalance.
Throughout 2025, total exports of goods and services increased by a substantial $199.8 billion, or 6.2%, to $3,432.3 billion. Imports also grew, but at a slightly slower pace, rising by $197.8 billion, or 4.8%, to $4,333.8 billion. This differential growth in exports and imports contributed to the slight reduction in the annual deficit.
The annual decrease in the goods and services deficit was a result of conflicting trends in goods and services trade. The goods deficit for 2025 increased by $25.5 billion, or 2.1%, reaching $1,240.9 billion. Conversely, the services surplus saw a significant expansion of $27.6 billion, or 8.9%, to $339.5 billion. This highlights a growing strength in the U.S. services sector’s contribution to the trade balance, effectively cushioning the impact of a widening deficit in goods.
In terms of annual export performance, goods exports climbed by $117.7 billion to $2,197.5 billion in 2025. On a Census basis, goods exports saw an even larger increase of $123.5 billion, with net balance of payments adjustments decreasing by $5.8 billion. Services exports also demonstrated robust growth, increasing by $82.1 billion to $1,234.9 billion for the year.
On the import side, goods imports surged by $143.2 billion to $3,438.4 billion in 2025. Imports of goods on a Census basis rose by $149.3 billion, while net balance of payments adjustments decreased by $6.1 billion. Services imports also increased, albeit at a slower pace than goods, rising by $54.5 billion to $895.4 billion.
The real goods deficit in 2017 dollars on a Census basis for 2025 increased by $64.4 billion, or 5.7%, to $1,197.1 billion. This contrasts with a 2.1% increase in the nominal goods deficit, again indicating that real value changes were more pronounced than nominal ones, potentially influenced by shifts in trade volumes and underlying price dynamics.
Three-Month Moving Averages Show Short-Term Instability
The report also provides insights into trade trends through three-month moving averages, which are often used to smooth out monthly volatility and identify underlying patterns. The average goods and services deficit for the three months ending in December 2025 increased by $7.5 billion to $50.7 billion. This indicates a recent upward trend in the trade deficit as the year concluded.
However, when viewed year-over-year, the picture is considerably different. The average goods and services deficit for the three months ending in December 2025 actually decreased by $32.9 billion compared to the same period in 2024. This suggests that while the most recent month showed a widening deficit, the broader trend over the preceding year remained one of improvement in the trade balance when smoothed over longer periods.
Trade Balances by Country and Region: Shifting Patterns
The report details trade balances with key trading partners, revealing significant shifts and persistent trends.
December 2025:
- Surpluses: The U.S. recorded surpluses with the Netherlands ($5.6 billion), South and Central America ($4.3 billion), the United Kingdom ($3.7 billion), Hong Kong ($2.5 billion), Brazil ($2.1 billion), Belgium ($1.4 billion), Singapore ($1.1 billion), Saudi Arabia ($0.2 billion), Australia ($0.2 billion), and Switzerland ($0.1 billion).
- Deficits: Significant deficits were observed with Taiwan ($19.8 billion), Vietnam ($17.6 billion), Mexico ($14.5 billion), China ($12.4 billion), the European Union ($11.1 billion), Germany ($6.9 billion), South Korea ($5.8 billion), Japan ($5.3 billion), India ($5.2 billion), and Canada ($4.9 billion). Other notable deficits included those with Malaysia ($3.0 billion), Italy ($2.5 billion), France ($2.4 billion), Ireland ($2.0 billion), and Israel ($0.8 billion).
Annual 2025:
- Surpluses: For the full year 2025, surpluses were maintained with the Netherlands ($60.7 billion), South and Central America ($52.4 billion), the United Kingdom ($32.2 billion), Hong Kong ($28.5 billion), and Brazil ($14.4 billion).
- Deficits: Persistent and substantial deficits were recorded with the European Union ($218.8 billion), China ($202.1 billion), Mexico ($196.9 billion), Vietnam ($178.2 billion), and Taiwan ($146.8 billion). Other significant deficits included Ireland ($114.2 billion), Germany ($73.0 billion), Thailand ($71.9 billion), Japan ($63.9 billion), India ($58.2 billion), South Korea ($56.4 billion), and Canada ($46.4 billion). The U.S. also saw deficits with Switzerland ($34.3 billion), Malaysia ($30.8 billion), Italy ($30.8 billion), Indonesia ($23.7 billion), France ($18.1 billion), Austria ($12.2 billion), and South Africa ($10.1 billion).
The persistent large deficits with major trading partners like China, the European Union, and Mexico highlight ongoing structural imbalances in U.S. trade relationships. The growth in the services surplus, however, indicates a strong performance in sectors such as financial services, technology, and tourism, which are increasingly important components of the U.S. economy.
Context and Implications of the December Trade Data
The widening of the trade deficit in December 2025, particularly the sharp increase in the goods deficit, can be attributed to a confluence of factors. Globally, economic conditions in late 2025 may have seen varied growth rates among major economies, impacting demand for U.S. exports. Simultaneously, robust domestic demand in the U.S. could have sustained import levels, especially for goods.
The revisions to Exhibit 15 underscore the complexity of international trade data collection and compilation. The correction of statistics for "Total Balance of Payments Basis" and "Net Adjustments" indicates a commitment to data accuracy, though the need for such revisions also points to the dynamic nature of economic reporting. The delay in the release of the report due to federal funding lapses is a stark reminder of the potential disruptions that government shutdowns can have on the dissemination of critical economic information, potentially impacting timely analysis by businesses, policymakers, and financial markets.
The shift in the Euro Area’s composition, with Bulgaria adopting the euro on January 1, 2026, will necessitate adjustments in future reporting, specifically affecting exhibit 14 of the FT-900 and exhibit 4 of the FT-900 Supplement. This is a procedural change that reflects evolving economic integration within the European Union.
Broader Economic Picture and Future Outlook
The December trade figures, while concerning in their monthly surge, must be considered within the broader context of the 2025 annual performance. The slight reduction in the annual deficit, driven by a strong services sector, suggests underlying resilience in certain areas of the U.S. economy. However, the persistent and substantial deficit in goods trade remains a significant challenge.
The implications of these trade dynamics are far-reaching. A widening trade deficit can impact a nation’s current account balance, potentially influencing exchange rates and debt levels. For the U.S., the strong performance of its services exports is a crucial mitigating factor, demonstrating its competitive edge in high-value sectors.
Looking ahead, the ongoing adjustments to release schedules due to federal funding issues mean that future trade data may also be subject to delays or revisions. This uncertainty adds another layer of complexity for economic analysts and decision-makers. The future trajectory of the U.S. trade deficit will likely depend on a combination of global economic growth, domestic demand, the competitiveness of U.S. exports, and trade policies. The interplay between these factors will be closely watched by economic observers in the coming months.
The U.S. Census Bureau and U.S. Bureau of Economic Analysis will continue to monitor and report on these trends, providing essential data for understanding the U.S. position in the global economy. Further details and additional statistics can be found on their respective websites, with updated release schedules being published as they become available.