

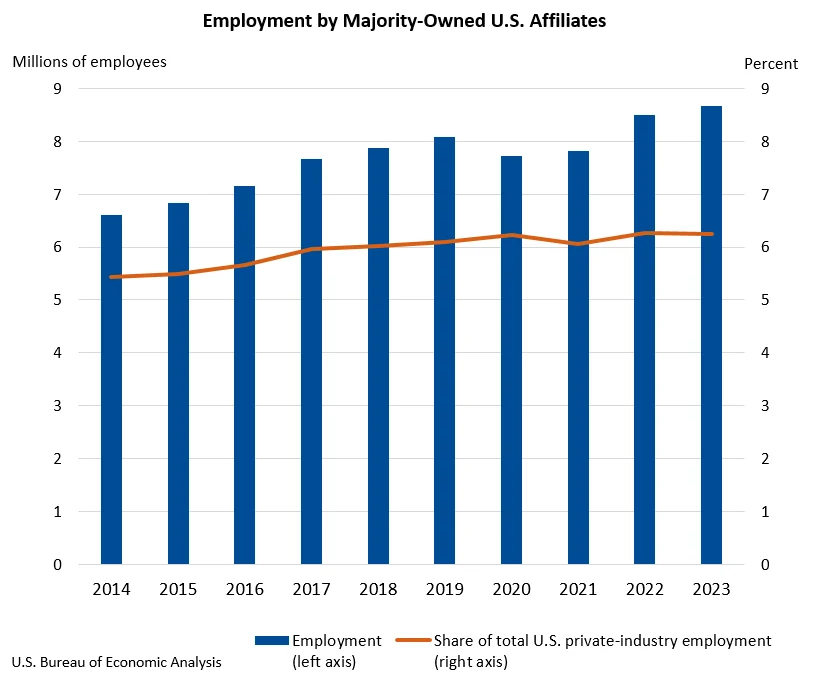
The United States witnessed a notable increase in employment and economic output driven by majority-owned U.S. affiliates of foreign multinational enterprises (MNEs) in 2023. These entities, which represent significant investments by international companies within the American economy, provided jobs for 8.66 million workers, marking a 1.9 percent rise from the 8.5 million employed in 2022. This growth underscores the persistent role of foreign direct investment in bolstering the U.S. labor market and contributing to national prosperity. The statistics, released by the U.S. Bureau of Economic Analysis (BEA), offer a comprehensive snapshot of the operational and financial activities of these vital economic players.
While the absolute number of jobs created by these affiliates saw an increase, their share of total private-industry employment in the United States slightly decreased to 6.2 percent in 2023, down from 6.3 percent in the preceding year. This marginal shift in percentage, despite an increase in raw numbers, reflects the overall growth of the U.S. private sector employment landscape. Nevertheless, the sheer scale of employment generated by foreign-owned entities remains a critical component of the nation’s economic engine, highlighting the interconnectedness of global commerce and domestic job creation.
The economic impact extends beyond employment figures. The current-dollar value added by these majority-owned U.S. affiliates, a key indicator of their direct contribution to the U.S. gross domestic product (GDP), surged by 6.3 percent to an impressive $1.47 trillion in 2023. This substantial increase signifies not only the growing operational scale of these businesses but also their escalating productivity and innovation within the American economy. This value added represents the market value of goods and services produced by these affiliates, after accounting for the cost of intermediate inputs, and is a fundamental measure of their economic output.
Further demonstrating the robust investment by foreign entities in the U.S. economy, expenditures for property, plant, and equipment by these affiliates also saw a significant uptick. These capital investments rose by 6.3 percent to $322.7 billion in 2023. Such expenditures are crucial for expanding operational capacity, modernizing infrastructure, and fostering long-term growth. They signal a strong commitment from foreign MNEs to enhance their U.S. presence through tangible assets, which can lead to further job creation and economic stimulus in local communities.
Innovation and research are also key areas where foreign-owned affiliates are making significant contributions. In 2023, research and development (R&D) performed by these entities increased by 1.1 percent, reaching $87.8 billion. This investment in R&D is vital for driving technological advancement, developing new products and services, and maintaining a competitive edge in the global marketplace. It also contributes to the U.S. intellectual property landscape and supports a highly skilled workforce.
A Deeper Dive into the Data and Trends
The Bureau of Economic Analysis (BEA) has been meticulously tracking the activities of U.S. affiliates of foreign multinational enterprises for decades, providing invaluable data for policymakers, economists, and businesses alike. These statistics are compiled through comprehensive surveys that capture a wide array of financial and operational data, including employment, value added, capital expenditures, R&D spending, sales, compensation of employees, and international trade flows. The goal is to provide an accurate and detailed picture of how foreign investment shapes the U.S. economic landscape.
The data released today reflects the most recent comprehensive figures for 2023, building upon preliminary estimates and revised data for previous years. The BEA’s commitment to data accuracy is evident in its regular updates, which incorporate newly available and revised source data to ensure the statistics remain as precise as possible. For instance, the statistics for 2022, initially released in November 2024, underwent revisions. These revisions, detailed in the December 2024 issue of the Survey of Current Business under the title "Activities of U.S. Affiliates of Foreign Multinational Enterprises in 2022," revealed a more robust performance than initially reported. The revised data for 2022 indicated that the number of employees reached 8,503.1 thousand (compared to a preliminary estimate of 8,351.0 thousand), value added was $1,382.1 billion (revised from $1,350.1 billion), expenditures for property, plant, and equipment totaled $303.5 billion (revised from $299.1 billion), and R&D expenditures amounted to $86.8 billion (revised from $80.3 billion). These revisions highlight the dynamic nature of economic data collection and the BEA’s dedication to providing the most up-to-date and accurate information.
The Significance of Majority-Owned U.S. Affiliates
The focus on "majority-owned" U.S. affiliates is a critical distinction in the BEA’s reporting. This categorization ensures that the data reflects the operations of entities where foreign MNEs have controlling interest, thereby providing a clearer picture of their direct influence and investment strategy within the United States. These are not simply subsidiaries or branches; they are integral parts of foreign corporate structures that have established a significant operational presence within the American market.
The statistics on these affiliates offer a multifaceted view of their economic impact. Beyond employment and value added, the BEA also tracks:
- Sales: The total value of goods and services sold by these affiliates, indicating their market penetration and revenue generation capabilities.
- Compensation of Employees: The total wages and salaries paid to workers, reflecting the financial benefits accrued by the U.S. workforce employed by these entities.
- Balance Sheet and Income Statement Items: Detailed financial data, including assets, liabilities, revenues, and expenses, providing insights into their financial health and operational performance.
- Trade: The value of imports and exports conducted by these affiliates, illustrating their role in international trade flows and supply chains.
The availability of such detailed data allows for a granular analysis of foreign investment trends, sector-specific impacts, and regional economic contributions. For example, understanding R&D spending by country of ultimate beneficial owner can reveal which nations are prioritizing innovation within the U.S. Conversely, examining capital expenditures by industry can highlight sectors that are attracting significant foreign investment for expansion and modernization.
Historical Context and Evolving Trends
The presence of foreign multinational enterprises in the U.S. economy is not a new phenomenon. For decades, foreign direct investment (FDI) has been a cornerstone of American economic policy, viewed as a driver of job creation, technological diffusion, and competitive market dynamics. Historically, countries like the United Kingdom, Japan, Germany, and Canada have been among the largest sources of FDI into the United States.
The BEA’s data allows for the tracking of these trends over time. While the absolute numbers of employment and value added have generally trended upwards, the composition of investors and the sectors attracting investment have evolved. For instance, the rise of investment from Asian economies in recent decades has diversified the landscape of foreign ownership in the U.S. Furthermore, shifts in global economic conditions, trade policies, and technological advancements continuously influence the patterns and scale of FDI.
The period following the 2008 global financial crisis saw fluctuations in FDI flows globally, but the U.S. market has consistently remained an attractive destination due to its large consumer base, stable legal framework, and access to skilled labor. The recent statistics for 2023 suggest a renewed vigor in foreign investment, with increased job creation and economic contributions, indicating a positive trajectory for FDI in the U.S.
Broader Economic Implications and Analysis
The sustained growth in employment and economic output from majority-owned U.S. affiliates of foreign MNEs carries several important implications for the U.S. economy.
Job Creation and Workforce Development: The creation of 8.66 million jobs directly translates into livelihoods for millions of American families. These jobs often come with competitive wages and benefits, contributing to consumer spending and overall economic stability. Moreover, foreign-owned companies often bring new management practices, technological know-how, and training programs that can enhance the skills of the U.S. workforce, leading to broader productivity gains.
Contribution to GDP: The substantial value added of $1.47 trillion underscores the significant role these affiliates play in generating the nation’s wealth. This contribution to GDP not only reflects their operational success but also their integration into the broader U.S. economic ecosystem, supporting domestic supply chains and contributing to tax revenues.
Capital Investment and Infrastructure: The increase in expenditures for property, plant, and equipment signifies a commitment to long-term growth and modernization. These investments can lead to the development of new facilities, the upgrading of existing ones, and the adoption of more efficient technologies, all of which contribute to the nation’s productive capacity and competitiveness.
Innovation and R&D: The investment in research and development by foreign-owned affiliates is crucial for fostering innovation within the U.S. This can lead to the development of cutting-edge technologies, new industries, and a more robust intellectual property portfolio, thereby enhancing America’s global standing in innovation.
Competitive Landscape: The presence of foreign-owned companies also fosters a more competitive business environment within the U.S. This competition can drive domestic companies to improve their efficiency, innovate more rapidly, and offer better products and services to consumers, ultimately benefiting the entire economy.
Official Perspectives and Data Accessibility
The U.S. Bureau of Economic Analysis, as the primary source of this data, plays a crucial role in disseminating this information to the public. Their mission is to provide timely and relevant economic data to inform public and private sector decision-making. The availability of detailed statistics on their website, including interactive data applications and comprehensive data tables, empowers researchers, policymakers, and the general public to delve deeper into the intricacies of foreign investment in the U.S.
It is important to note that the BEA is continuously refining its data collection and reporting methodologies. As indicated in the release, certain data tables that were previously produced alongside the news release have been discontinued as of December 5, 2025. This includes selected annual data tables, such as statistics on U.S. affiliates with 50 percent or less foreign ownership and supplemental industry statistics. While some of these have been archived, the core statistics on majority-owned affiliates, which are central to understanding the impact of foreign MNEs, remain readily accessible. The BEA’s commitment to transparency and data accessibility ensures that stakeholders can continue to monitor and analyze the vital role of foreign investment in the U.S. economy.
The next release of statistics on the Activities of U.S. Affiliates of Foreign Multinational Enterprises, covering data for 2024, is scheduled for July 10, 2026. This forthcoming data will provide further insights into the evolving landscape of foreign investment and its continued impact on the American economy.


