

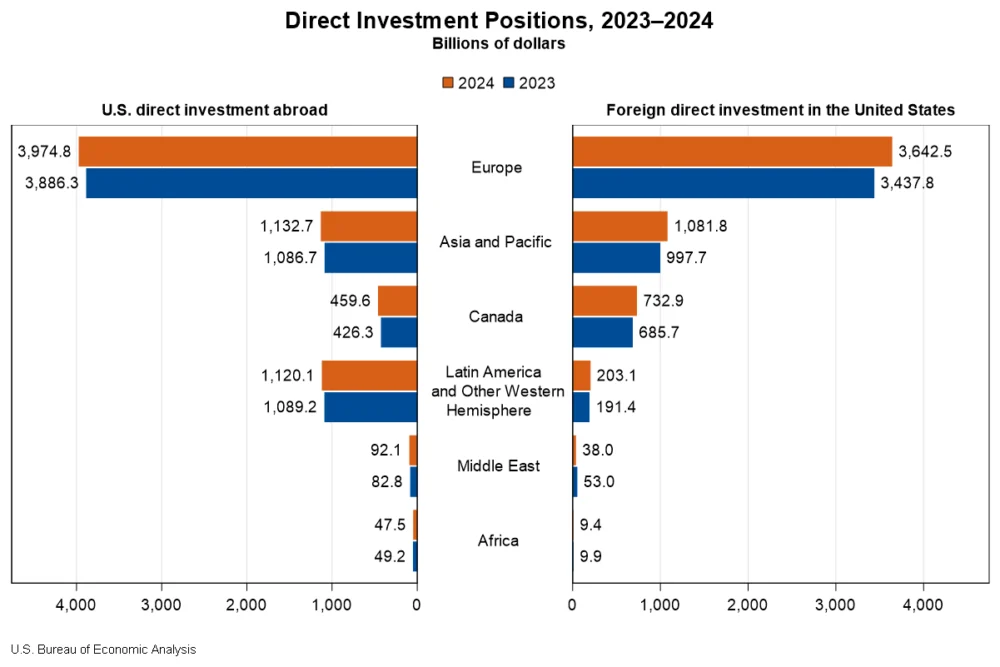
The cumulative U.S. direct investment abroad position surged by $206.3 billion to reach $6.83 trillion by the end of 2024, according to recently released statistics from the U.S. Bureau of Economic Analysis (BEA). This significant expansion was primarily fueled by an $88.4 billion increase in investments within Europe, with Luxembourg and Germany emerging as key destinations for American capital. Manufacturing affiliates, particularly those involved in the production of computers and electronic products, experienced the most substantial growth in investment.
Concurrently, foreign direct investment (FDI) in the United States also demonstrated considerable strength, with the cumulative position climbing $332.1 billion to $5.71 trillion at year-end 2024. Europe was again a leading contributor to this growth, injecting an additional $204.7 billion into the U.S. economy. Notable increases were observed from the United Kingdom, which contributed $52.9 billion, and Germany, with an additional $39.7 billion. Across industries, manufacturing affiliates attracted the largest share of this incoming foreign capital.
These figures underscore a dynamic global investment landscape, reflecting continued confidence in both U.S. economic resilience and the strategic opportunities presented by international markets. The BEA’s annual report provides a crucial snapshot of the intricate web of cross-border capital flows that shape global commerce and influence domestic economies.
The Expanding Reach of U.S. Multinational Enterprises Abroad
U.S. multinational enterprises (MNEs) have established a significant presence across nearly every nation, with their direct investment abroad playing a critical role in global supply chains, technological diffusion, and employment generation. At the close of 2024, over half of the total U.S. direct investment abroad position was concentrated in just five countries. The United Kingdom stood as the largest recipient of U.S. investment, with a position totaling $1,024.6 billion. Following closely were the Netherlands ($1,012.0 billion) and Luxembourg ($569.6 billion). Singapore ($467.6 billion) and Ireland ($466.8 billion) completed the top five destinations for U.S. outbound capital.
The sectoral distribution of this outbound investment reveals key areas of focus for U.S. companies. Holding companies accounted for the largest share of the overall U.S. direct investment abroad position, representing 47.3 percent in 2024. This indicates a strategic use of holding structures for managing international assets and operations. Manufacturing affiliates followed, capturing 16.0 percent of the investment, highlighting the continued importance of global production networks. Finance and insurance affiliates were the third-largest sector, with 14.2 percent of U.S. investment.
When examined from the perspective of the U.S. parent company’s industry, manufacturing MNEs were the most significant investors, accounting for 50.9 percent of the total position abroad. This was followed by MNEs in the finance and insurance sector, which represented 15.1 percent of the outbound investment. This dual perspective—by affiliate industry and by parent industry—provides a comprehensive understanding of where U.S. capital is being deployed and by which types of American businesses.
Earning Returns: Income Generated from Overseas Investments
The substantial direct investment abroad by U.S. MNEs yielded significant returns in 2024. U.S. companies earned an estimated $601.9 billion in income on their cumulative foreign investments, marking a 3.8 percent increase compared to the previous year. The finance and insurance sector was a particularly strong performer, experiencing the most substantial income growth. This sector saw an increase of $12.0 billion in earnings, representing a remarkable 17.6 percent rise from 2023. This surge in earnings from financial services abroad suggests robust global financial market activity and a successful deployment of U.S. financial expertise in international markets.
The Growing Inflow of Foreign Capital into the United States
The United States continues to be a prime destination for global capital, with foreign direct investment playing a pivotal role in economic growth, job creation, and technological advancement. At the end of 2024, four countries accounted for more than half of the total foreign direct investment position within the U.S. economy. Japan led the pack as the top investing country, with a cumulative position of $754.1 billion. The United Kingdom followed with $742.7 billion, closely trailed by Canada at $732.9 billion. The Netherlands rounded out the top four, with a significant investment position of $726.4 billion.
An analysis by the country of the ultimate beneficial owner (UBO)—the entity at the highest level of the global ownership chain—provides a more nuanced perspective on the origins of foreign investment. On a UBO basis, Japan remained the leading investing country in 2024, with a position of $819.2 billion. Canada secured the second spot with $811.7 billion, followed by Germany in third place with $677.3 billion. Notably, the UBO perspective revealed that investment flows from the Netherlands and Luxembourg were considerably lower when traced back to their ultimate owners compared to their direct country of origin. This suggests that a substantial portion of capital channeled through these financial hubs ultimately originates from investors in other nations, highlighting the role of these countries as conduits for global investment.
Sectoral Distribution of Foreign Investment in the U.S.
The influx of foreign capital into the United States is heavily concentrated in the U.S. manufacturing sector, which absorbed 42.3 percent of the total FDI position. Within manufacturing, chemical manufacturing emerged as a particularly attractive sub-sector, attracting approximately one-third of the total manufacturing investment, amounting to $827.5 billion. This significant investment in chemical production underscores the global demand for U.S.-based chemical manufacturing capabilities and innovation.
Beyond manufacturing, foreign investors also demonstrated considerable interest in the U.S. finance and insurance sector, which attracted $599.4 billion in direct investment. The wholesale trade sector also represented a substantial investment destination, with foreign entities committing $520.5 billion. These figures highlight the diverse opportunities available to foreign investors across key sectors of the U.S. economy.
Foreign Investment Earnings in the U.S.
In 2024, foreign multinational enterprises generated $310.9 billion in income from their cumulative investments in the United States. This represents a substantial increase of 13.1 percent compared to the earnings reported in 2023. This robust growth in income signifies the profitability and success of foreign-owned businesses operating within the U.S. market, contributing positively to the overall economic health of the nation.
Historical Context and Revisions
The BEA’s release also includes revisions to previously published statistics for 2022 and 2023. These revisions are a standard part of the statistical process, incorporating newly available and revised source data to ensure the highest degree of accuracy. For 2022, the U.S. direct investment abroad position was revised to $6,245 billion from a previously published $6,313 billion, while foreign direct investment in the U.S. was revised to $5,124 billion from $5,167 billion. In 2023, U.S. direct investment abroad was adjusted to $6,620 billion from $6,676 billion, and foreign direct investment in the U.S. was revised to $5,376 billion from $5,394 billion. These adjustments reflect the dynamic nature of economic data and the BEA’s commitment to providing the most up-to-date and reliable information.
Broader Implications and Economic Significance
The trends highlighted in the BEA report have significant implications for both the U.S. and global economies. The robust growth in U.S. direct investment abroad signifies the continued competitiveness and global reach of American businesses. This outward investment can foster innovation, create export opportunities for U.S. goods and services, and provide strategic advantages in international markets. However, it also raises questions about the potential impact on domestic job creation and the repatriation of profits.
Conversely, the strong inflow of foreign direct investment into the United States signals international confidence in the U.S. economic environment, its stable regulatory framework, and its vast consumer market. This inbound investment is crucial for capital formation, job creation, and the transfer of technology and management expertise. The concentration of FDI in manufacturing, particularly in areas like chemical production, suggests a strategic focus on leveraging U.S. industrial capabilities and potentially reshoring or nearshoring production activities.
The detailed breakdown by country and industry provides policymakers, businesses, and researchers with invaluable insights for strategic planning, trade policy development, and economic forecasting. Understanding the flow of capital, the sectors attracting investment, and the key originating countries allows for a more informed approach to managing international economic relations and fostering sustainable economic growth.
Future Outlook and Data Accessibility
The BEA continues to enhance the accessibility and detail of its direct investment data. While previous releases included tables directly within the news release, the current approach directs users to BEA’s Interactive Data Application and Supplemental Data Tables for comprehensive statistics. This shift aims to provide a more dynamic and user-friendly experience for data exploration.
The BEA has also noted the discontinuation of certain specific tables, such as "U.S. Direct Investment Abroad: Dividends by Country of Foreign Affiliate" and "U.S. Direct Investment Abroad: Dividends by Industry of U.S. Parent." These archived tables, along with other discontinued annual detail tables, can be accessed through the BEA’s Data Archive for historical reference.
The next release of direct investment data, covering 2025 statistics, is anticipated in July 2026. This upcoming release will supersede the 2024 data and will continue to offer a detailed look at the evolving landscape of U.S. international investment activities. The consistent annual updates from the BEA are indispensable for tracking the intricate dynamics of global capital flows and their profound impact on economies worldwide.


