Lana Rhoades
The U.S. Bureau of Economic Analysis (BEA) has unveiled comprehensive new statistics detailing the robust economic footprint of the nation’s outdoor recreation sector. The latest figures for 2024 reveal that this dynamic industry contributed a substantial $696.7 billion, representing 2.4 percent of the current-dollar Gross Domestic Product (GDP) for the United States. This significant economic output underscores the growing importance of outdoor activities, from hiking and boating to gardening and attending outdoor concerts, in driving national prosperity.
National Economic Impact and Growth Trends
The BEA’s analysis, released today, provides an in-depth look at the outdoor recreation economy’s performance across all 50 states and the District of Columbia. On a national level, the value added by outdoor recreation activities reached $696.7 billion in 2024, a key indicator of its contribution to the overall economic output. This figure is derived from a detailed breakdown of expenditures and activities associated with enjoying the outdoors.
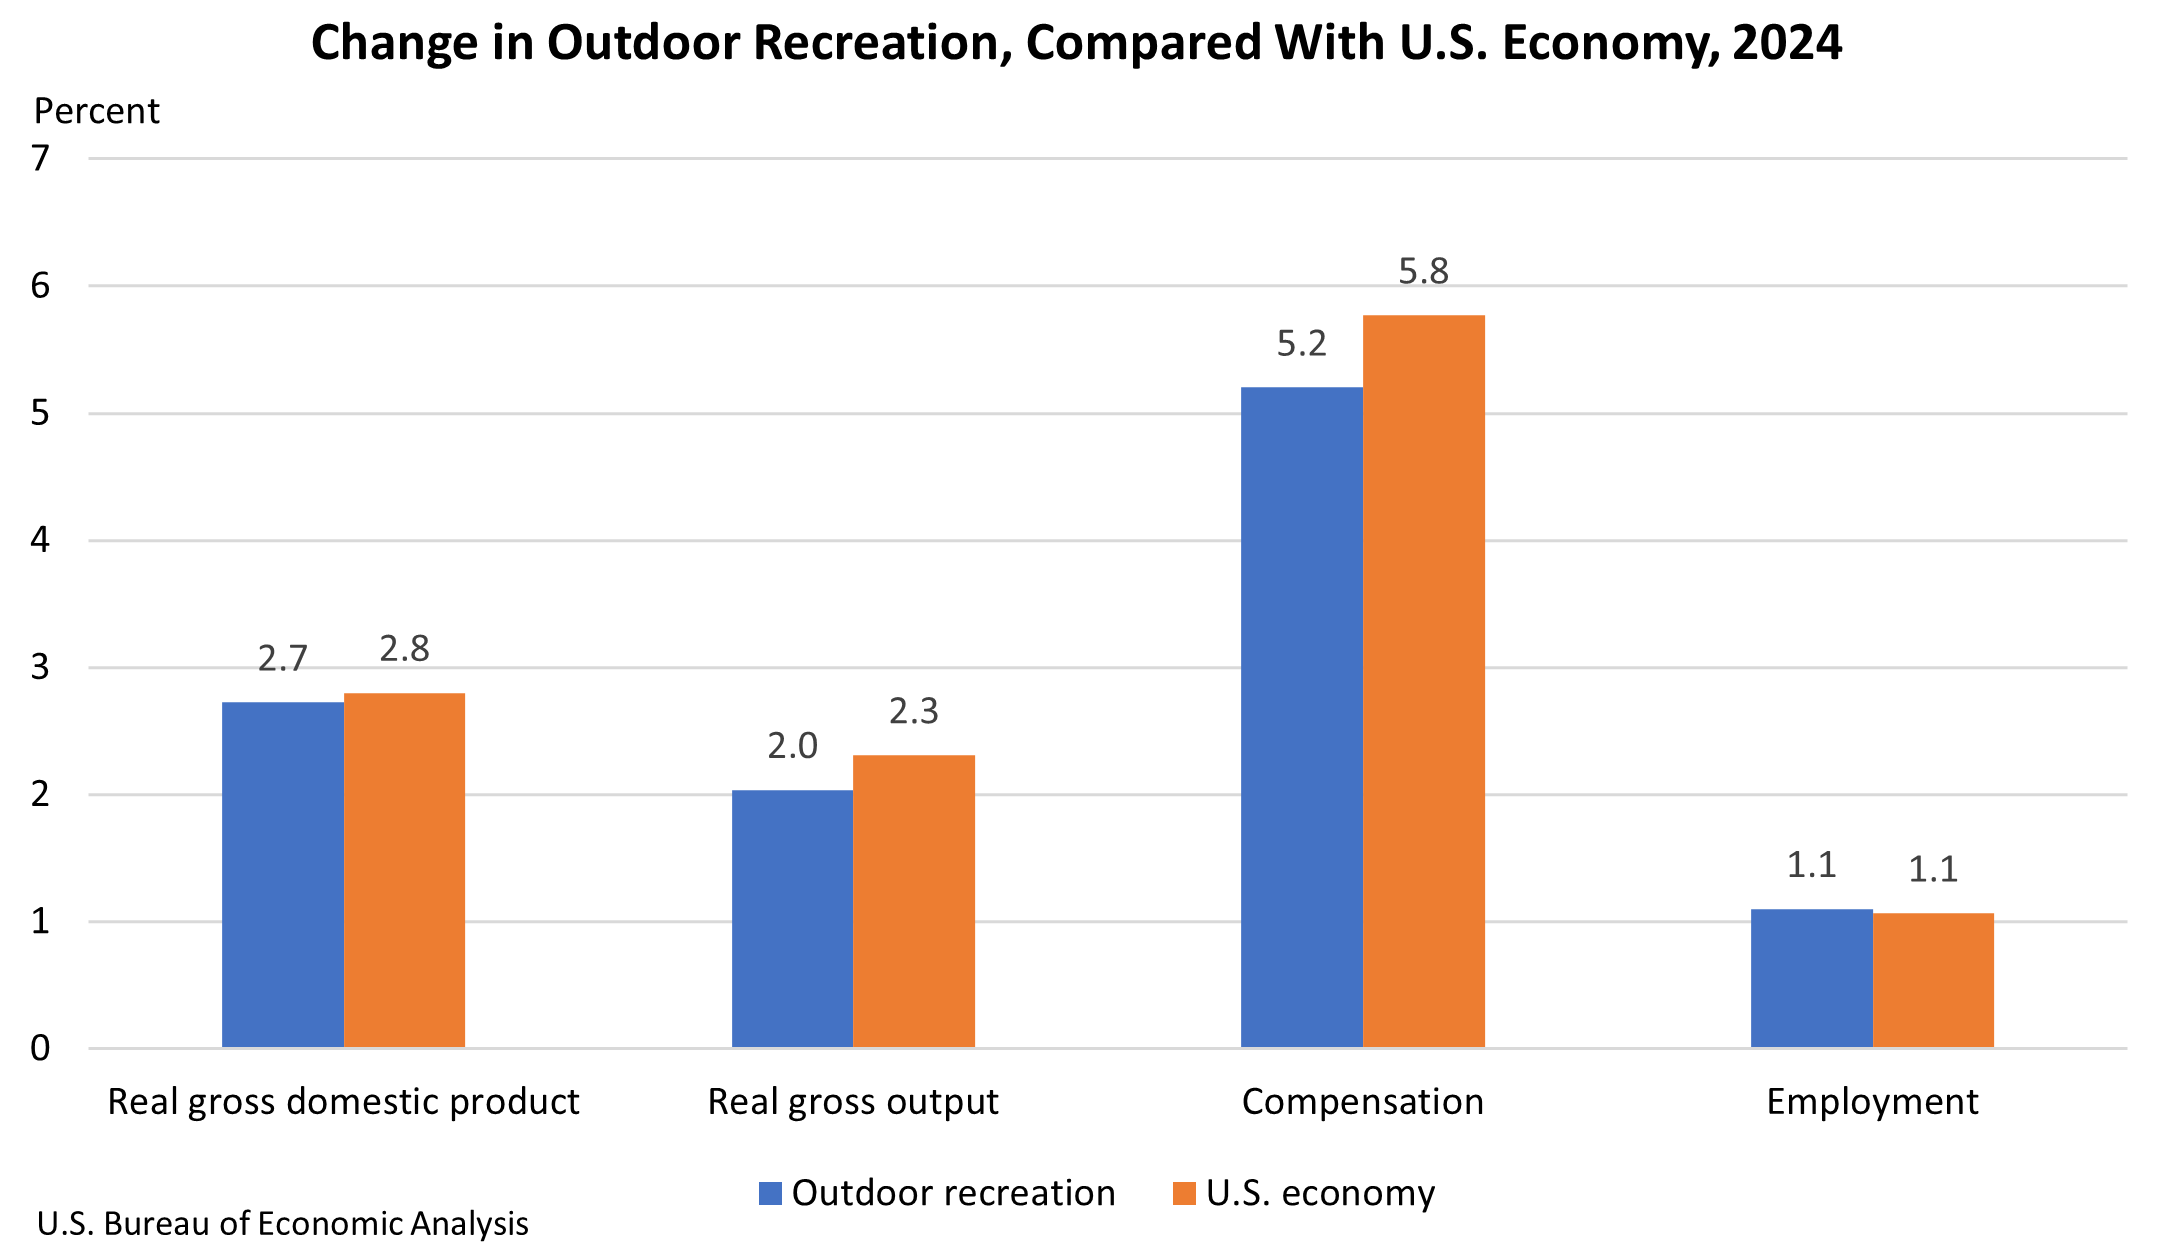
While the overall U.S. economy saw a 2.8 percent increase in inflation-adjusted GDP in 2024, the outdoor recreation economy experienced a slightly more moderate growth of 2.7 percent. This represents a deceleration from the impressive 5.3 percent surge observed in 2023, suggesting a period of stabilization after a period of strong recovery and growth. Despite this slight moderation, the sector continues to expand, with real gross output increasing by 2.0 percent. Furthermore, compensation within the outdoor recreation industry saw a healthy rise of 5.2 percent, and employment grew by 1.1 percent, indicating continued job creation and increased earnings for workers in this sector.
State-Level Variations in Outdoor Recreation’s Economic Share
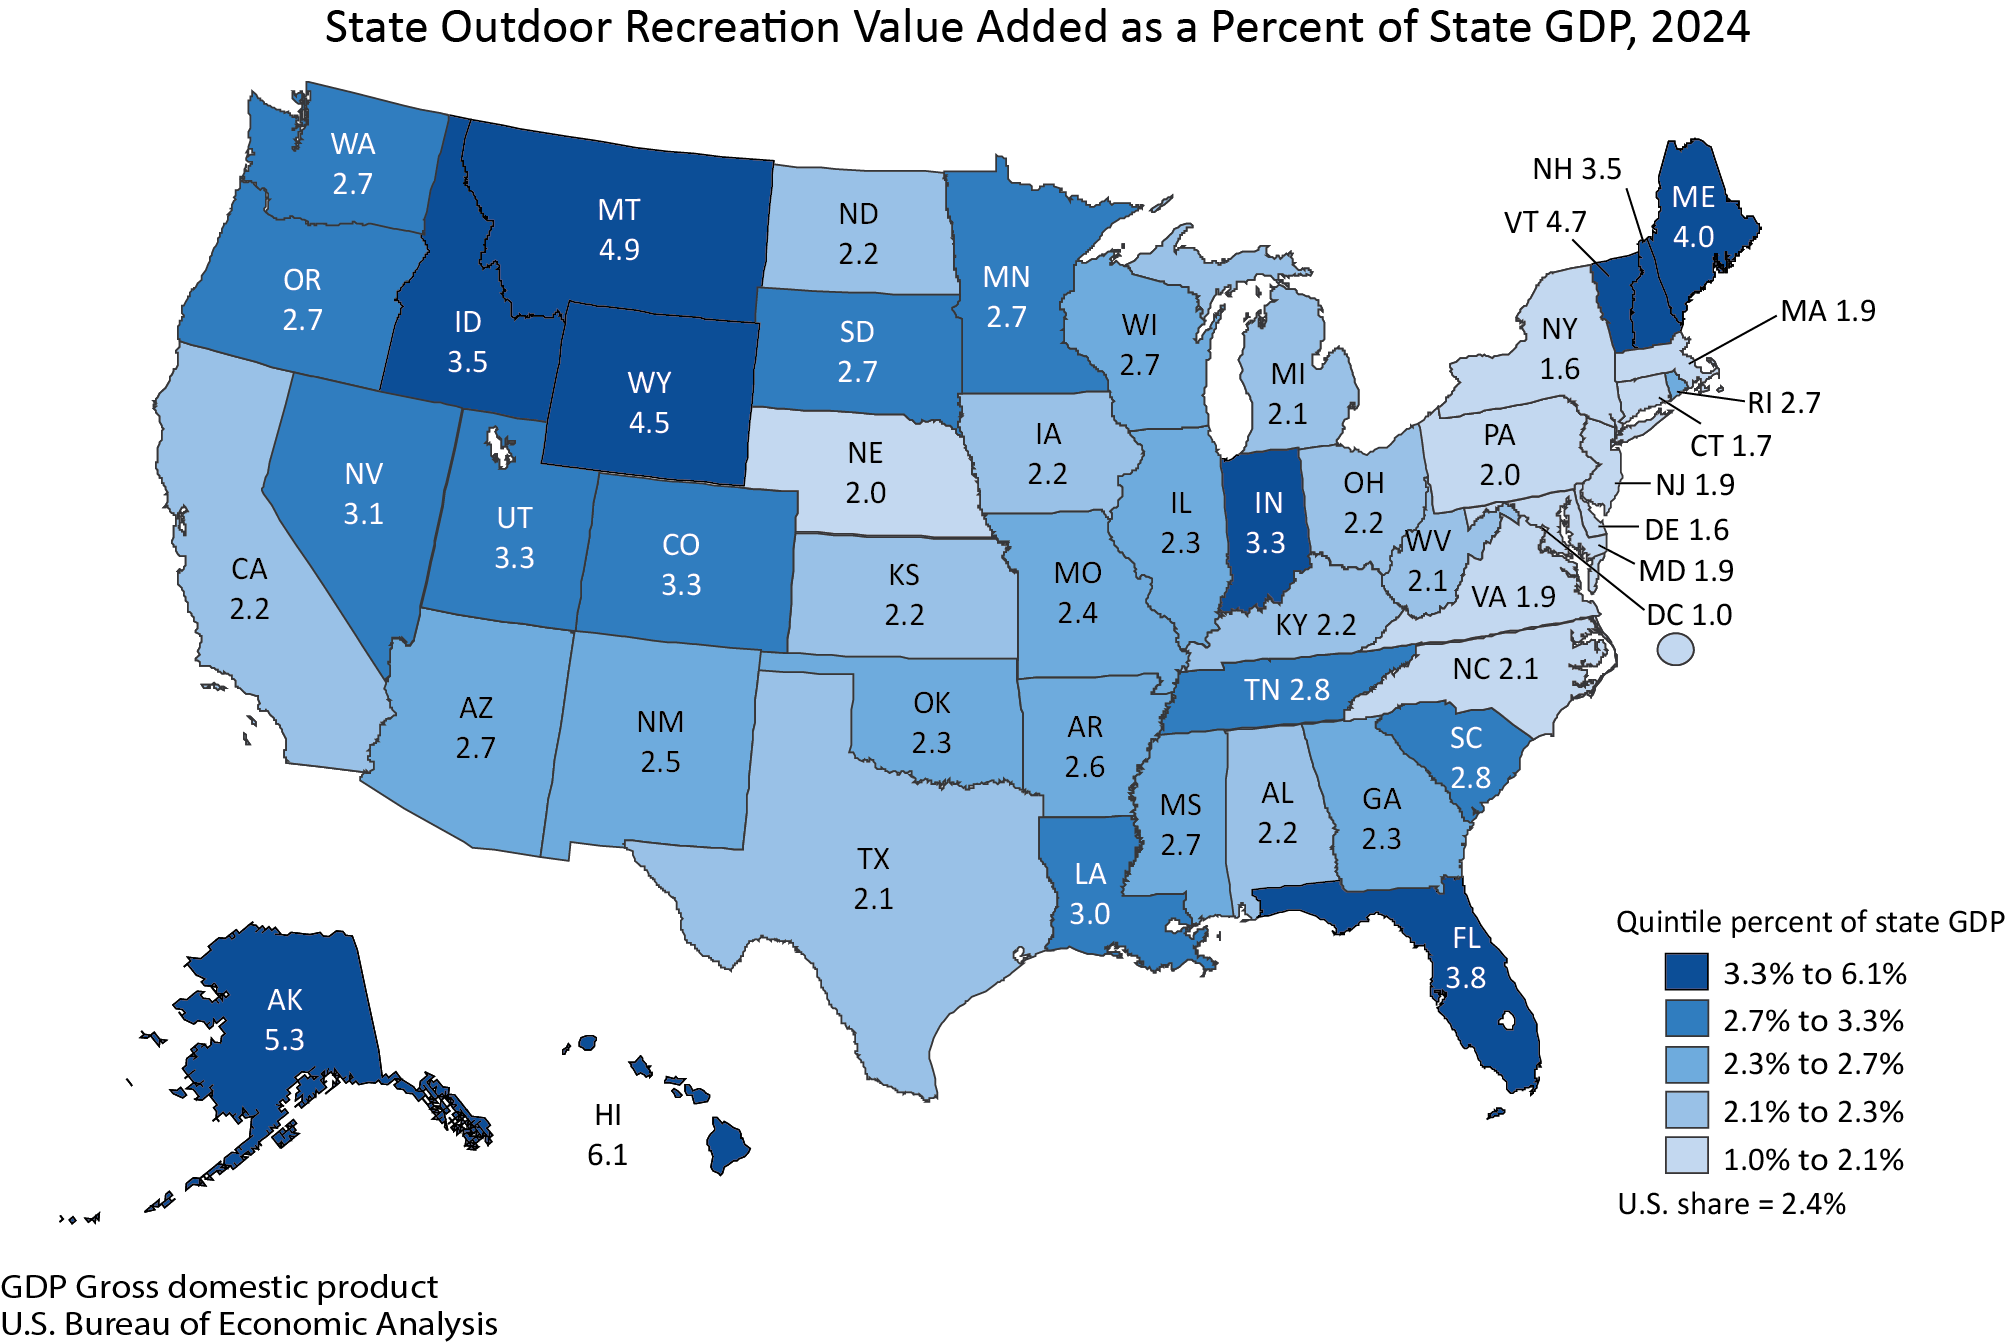
The impact of the outdoor recreation economy varies significantly across the nation, with states leveraging their unique natural resources and recreational opportunities to different degrees. Hawaii leads the pack, with outdoor recreation accounting for an impressive 6.1 percent of its state GDP in 2024. This high percentage highlights the critical role of tourism and outdoor activities in the island state’s economy. In contrast, the District of Columbia’s outdoor recreation sector represents a smaller share of its GDP, at 1.0 percent. The provided national table 2 and state table 1 offer a detailed comparison of these percentages across all states and the District of Columbia, allowing for a granular understanding of regional economic contributions.
Employment Dynamics in the Outdoor Recreation Sector
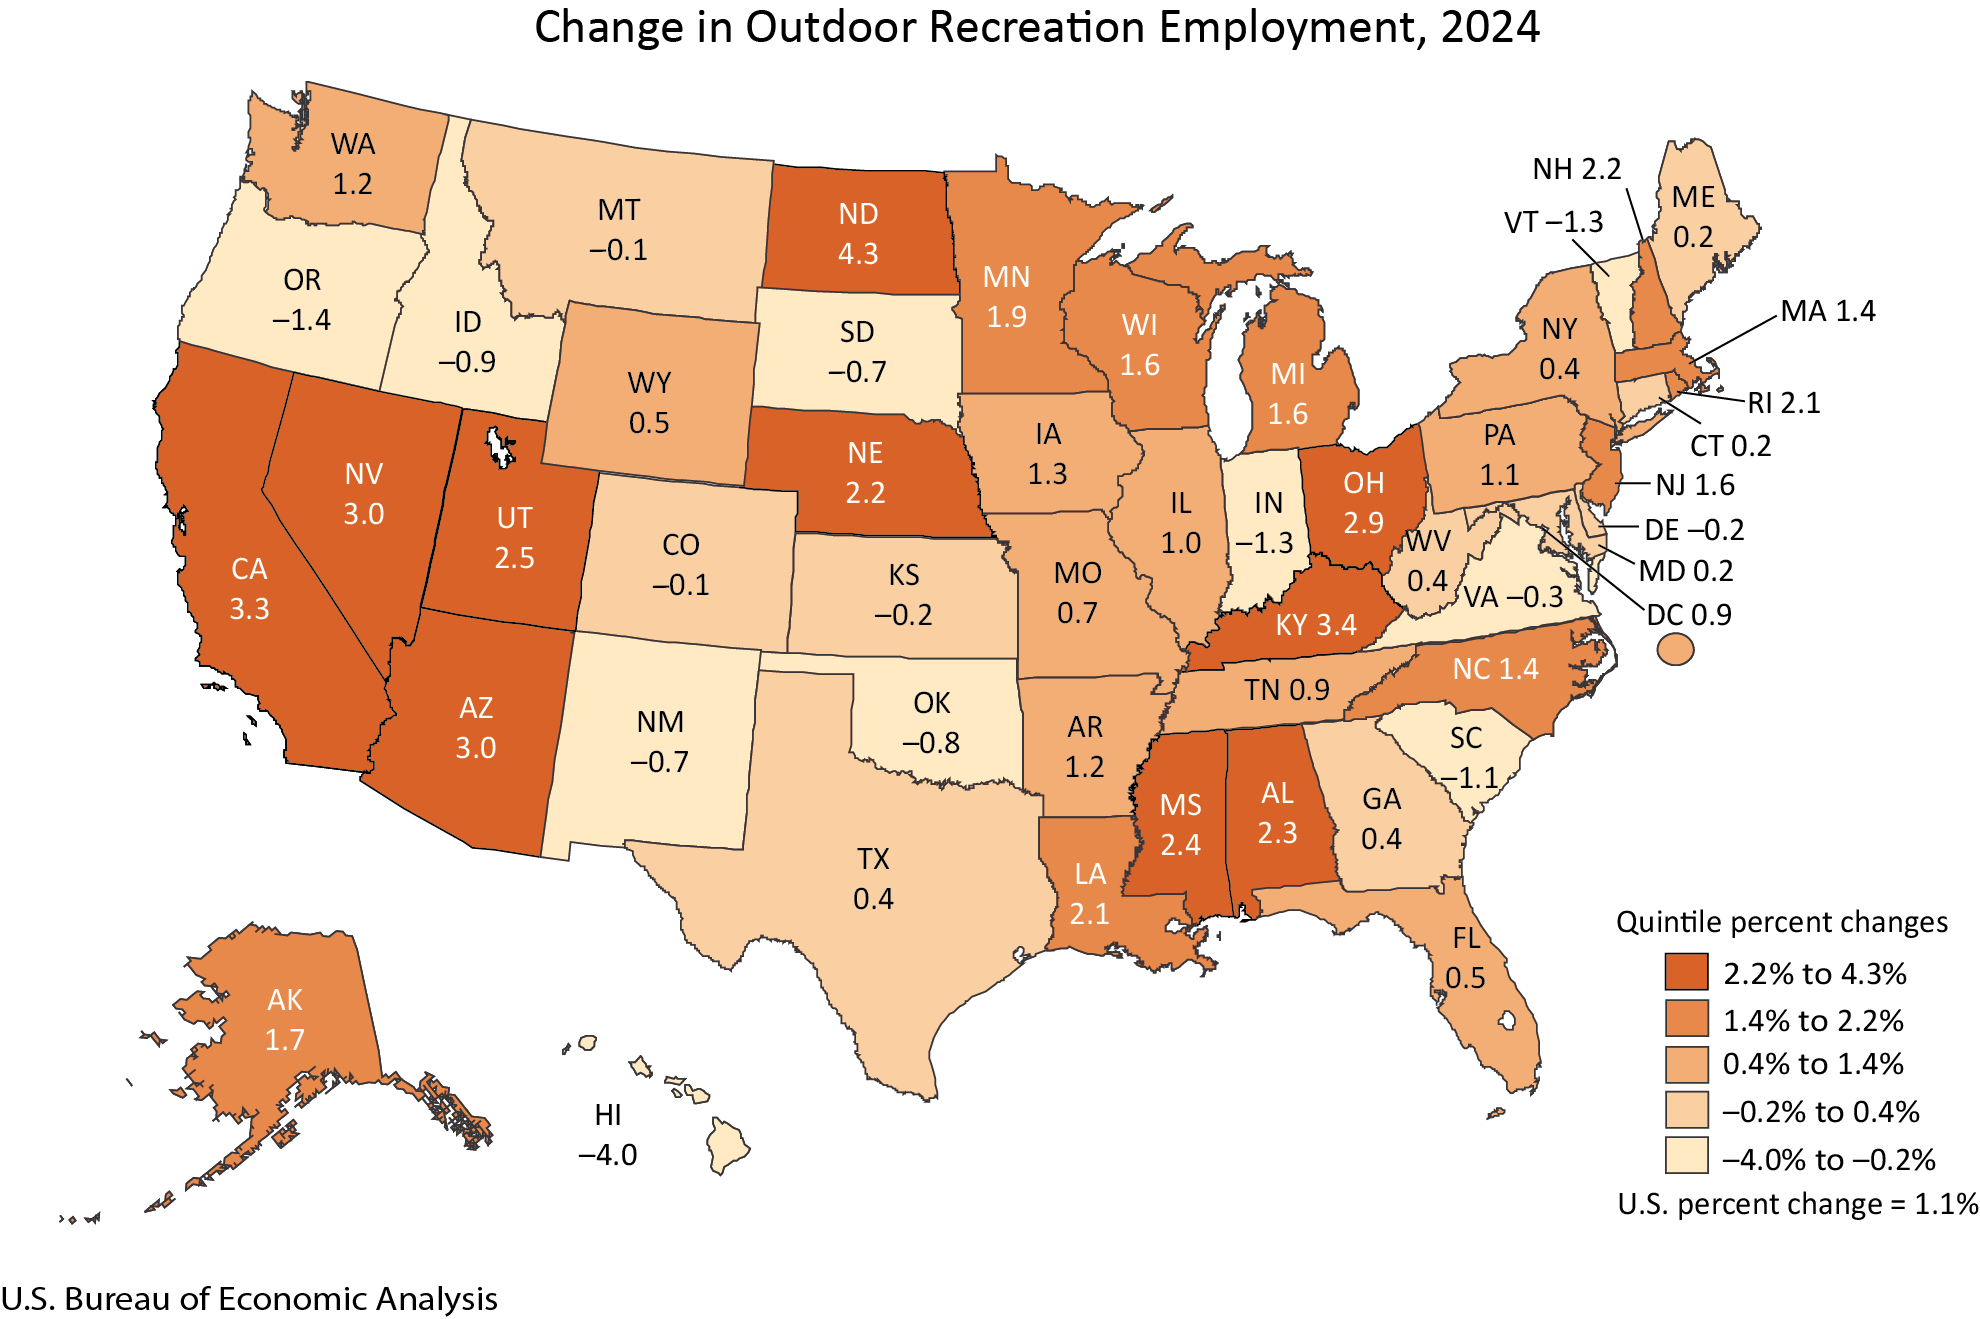
Employment trends within the outdoor recreation sector paint a picture of broad-based growth, although with regional disparities. In 2024, outdoor recreation employment saw an increase in 36 states and the District of Columbia. This widespread job creation signifies the sector’s capacity to generate employment opportunities across diverse geographical areas. North Dakota reported the highest percentage increase in outdoor recreation employment, with a robust 4.3 percent growth. This surge in North Dakota could be attributed to various factors, potentially including increased investment in state parks, growth in outdoor sporting events, or a rise in related service industries. Conversely, Hawaii experienced a decline in outdoor recreation employment, with a decrease of 4.0 percent. This dip in Hawaii, despite its high overall economic contribution from outdoor recreation, warrants further investigation into potential contributing factors such as shifts in tourism patterns or labor market dynamics. The BEA’s interactive tables provide access to detailed state-level data on employment changes, allowing for a deeper dive into these regional variations.
Categorizing Outdoor Recreation Activities and Their Economic Contributions
The BEA categorizes outdoor recreation activities into three primary groups, providing a comprehensive framework for understanding the sector’s economic drivers:
-
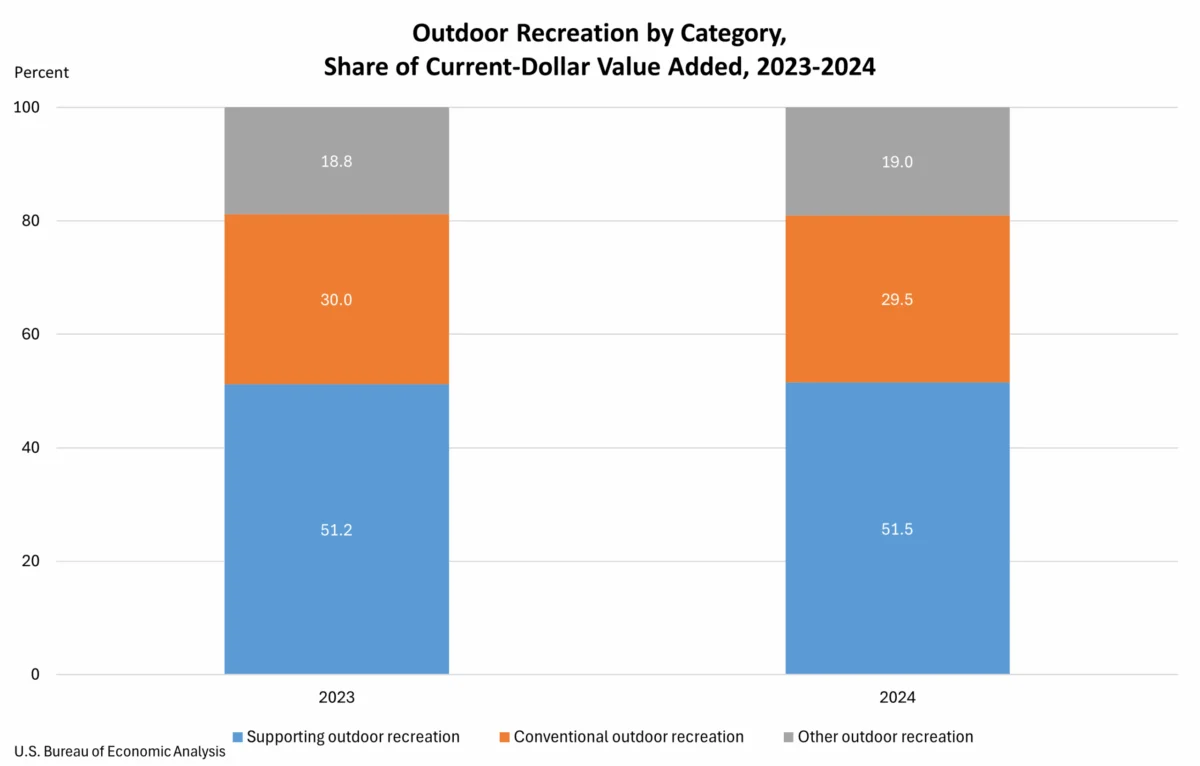
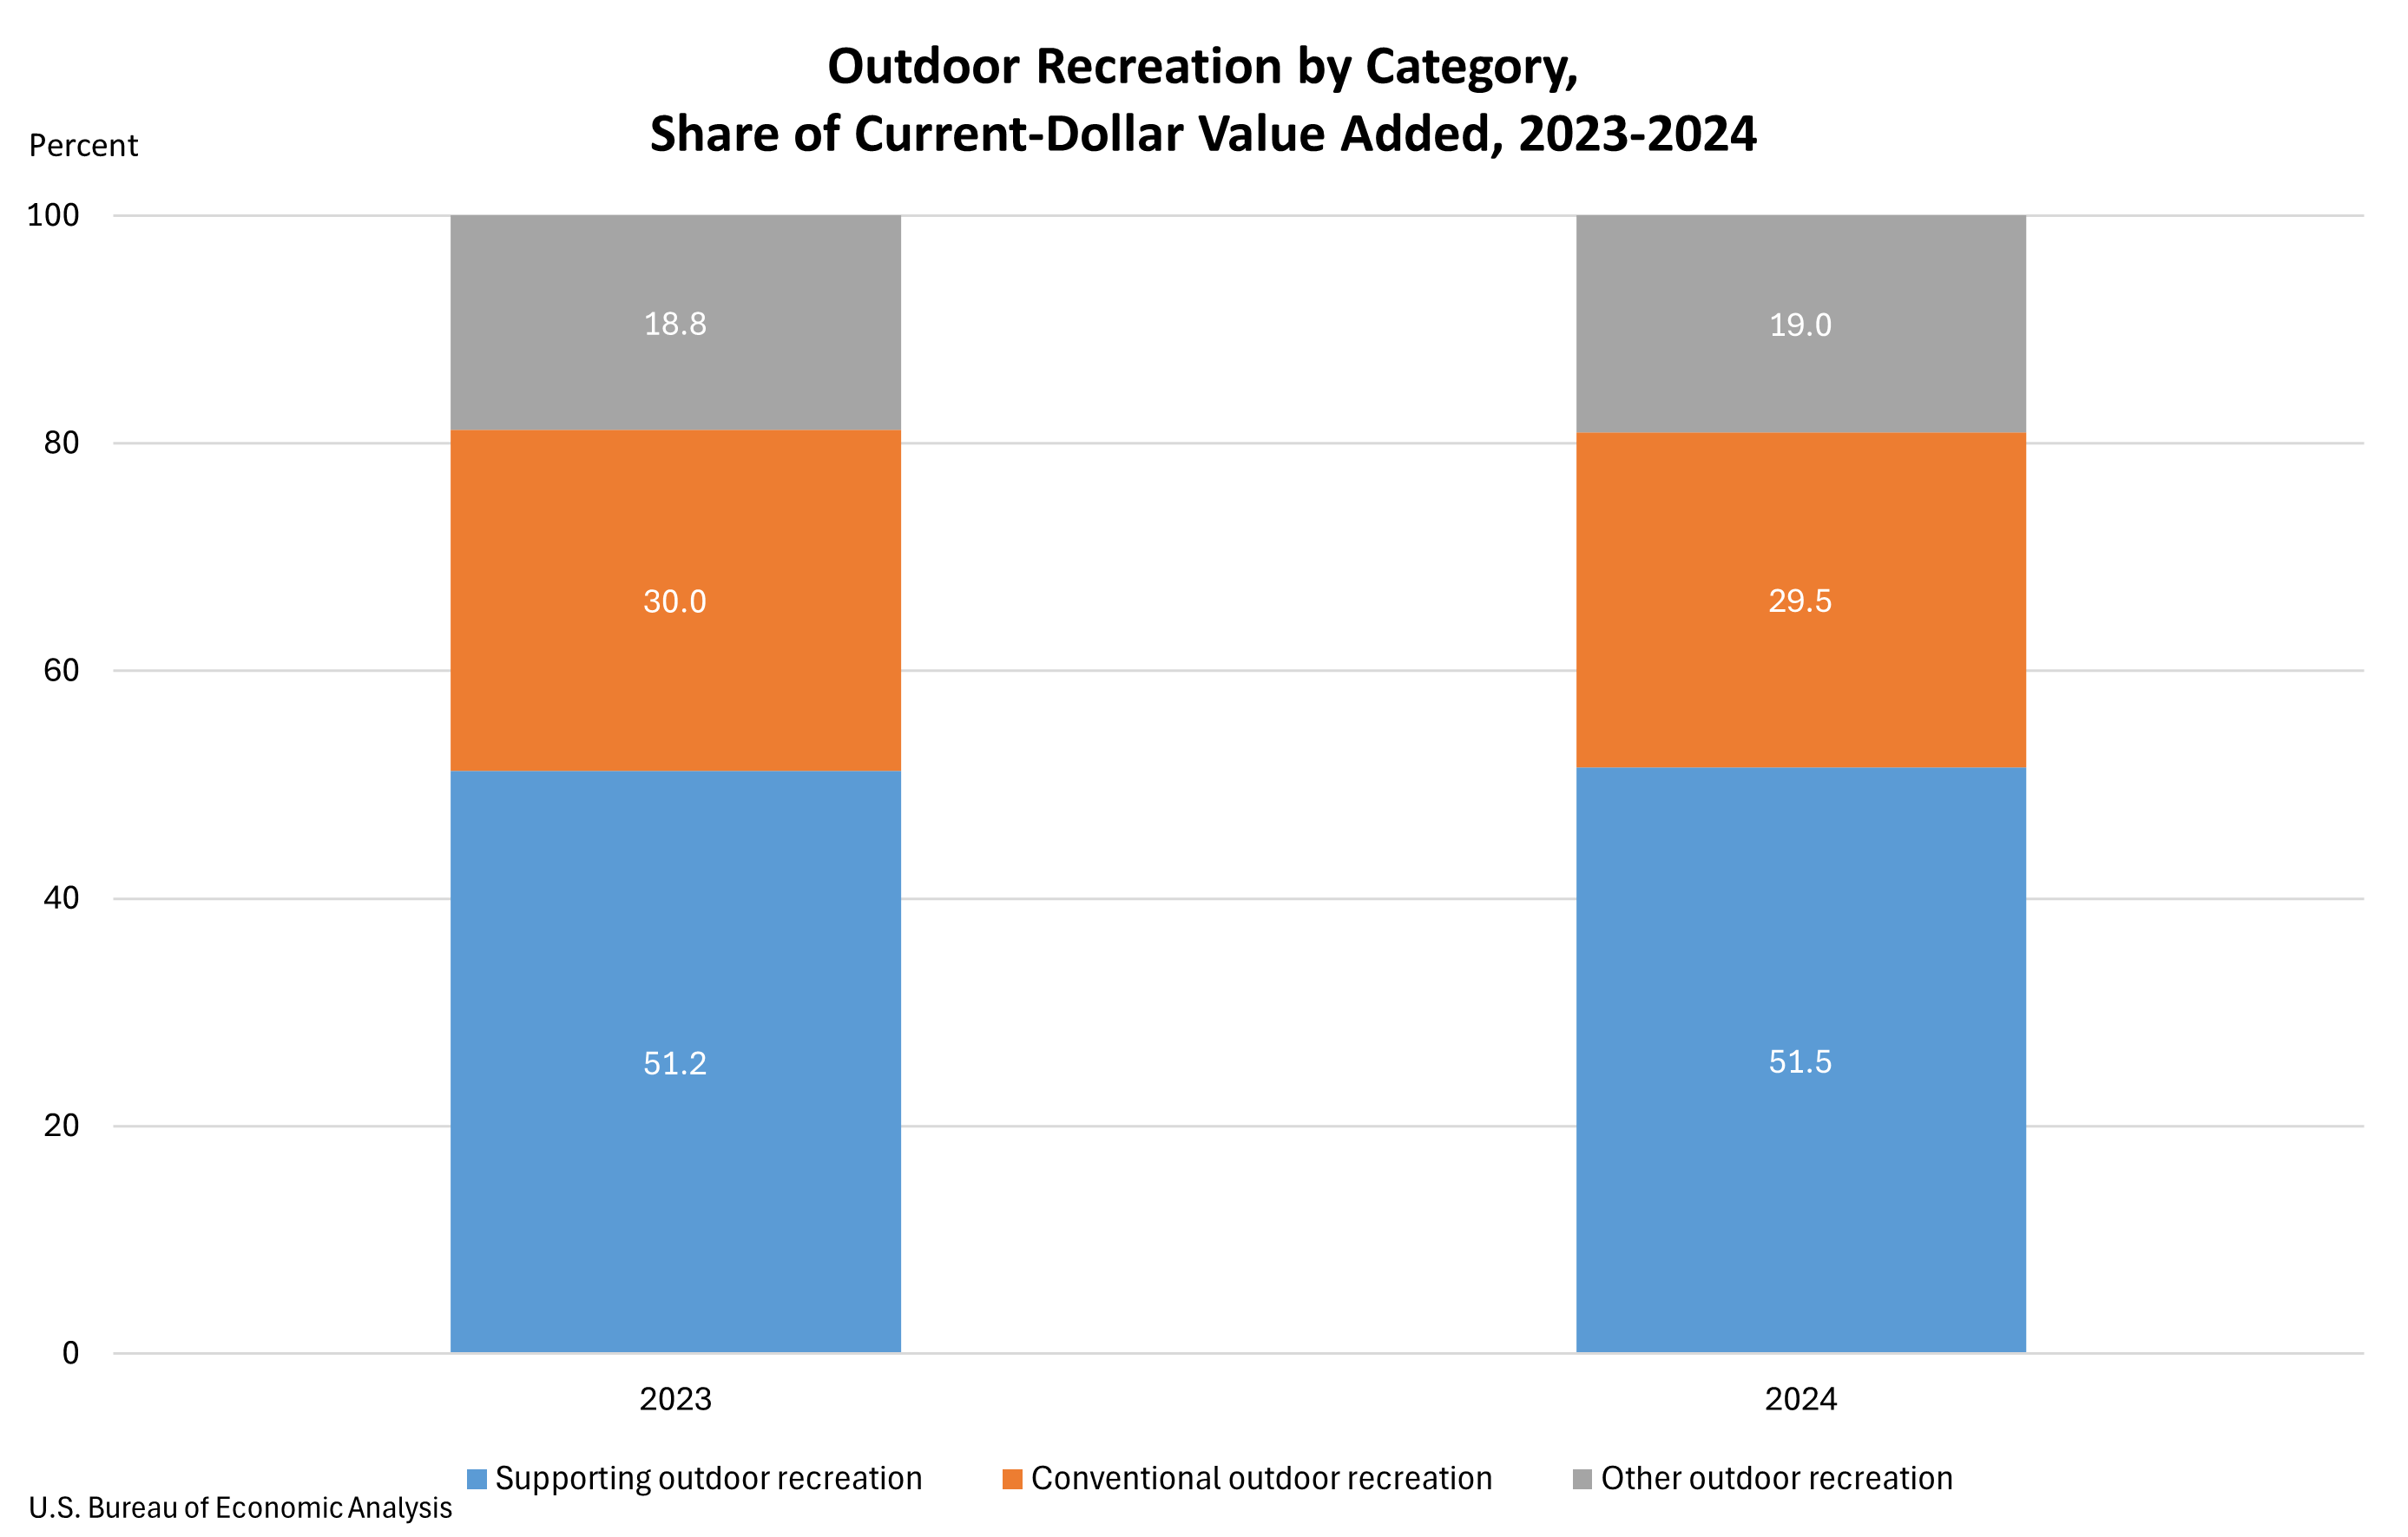
Conventional Activities: This category encompasses traditional outdoor pursuits such as bicycling, boating, hiking, hunting, fishing, camping, and other nature-based activities. In 2024, these activities accounted for 29.5 percent of the U.S. outdoor recreation value added. This represents a slight decrease from 30.0 percent in 2023, suggesting a marginal shift in consumer preferences or spending patterns.
-
Other Activities: This broader category includes activities like gardening, outdoor concerts, sports, and other leisure pursuits that take place outdoors but may not be as directly tied to natural landscapes. These activities made up 19.0 percent of the value added in 2024, a slight increase from 18.8 percent in the previous year.
-
Supporting Activities: This crucial segment comprises industries that facilitate and enable outdoor recreation. It includes vital components such as construction (of recreational facilities, trails, etc.), travel and tourism (transportation, accommodation, food services), local trips, and government expenditures related to public lands and recreation infrastructure. Supporting activities constituted the largest portion of outdoor recreation’s economic impact, accounting for 51.5 percent of value added in 2024, up from 51.2 percent in 2023. The growth within this category was particularly driven by travel and tourism, reflecting increased spending on transportation, hotels, and restaurants by individuals engaging in outdoor pursuits. This highlights the interconnectedness of the outdoor recreation economy with broader service and hospitality sectors.
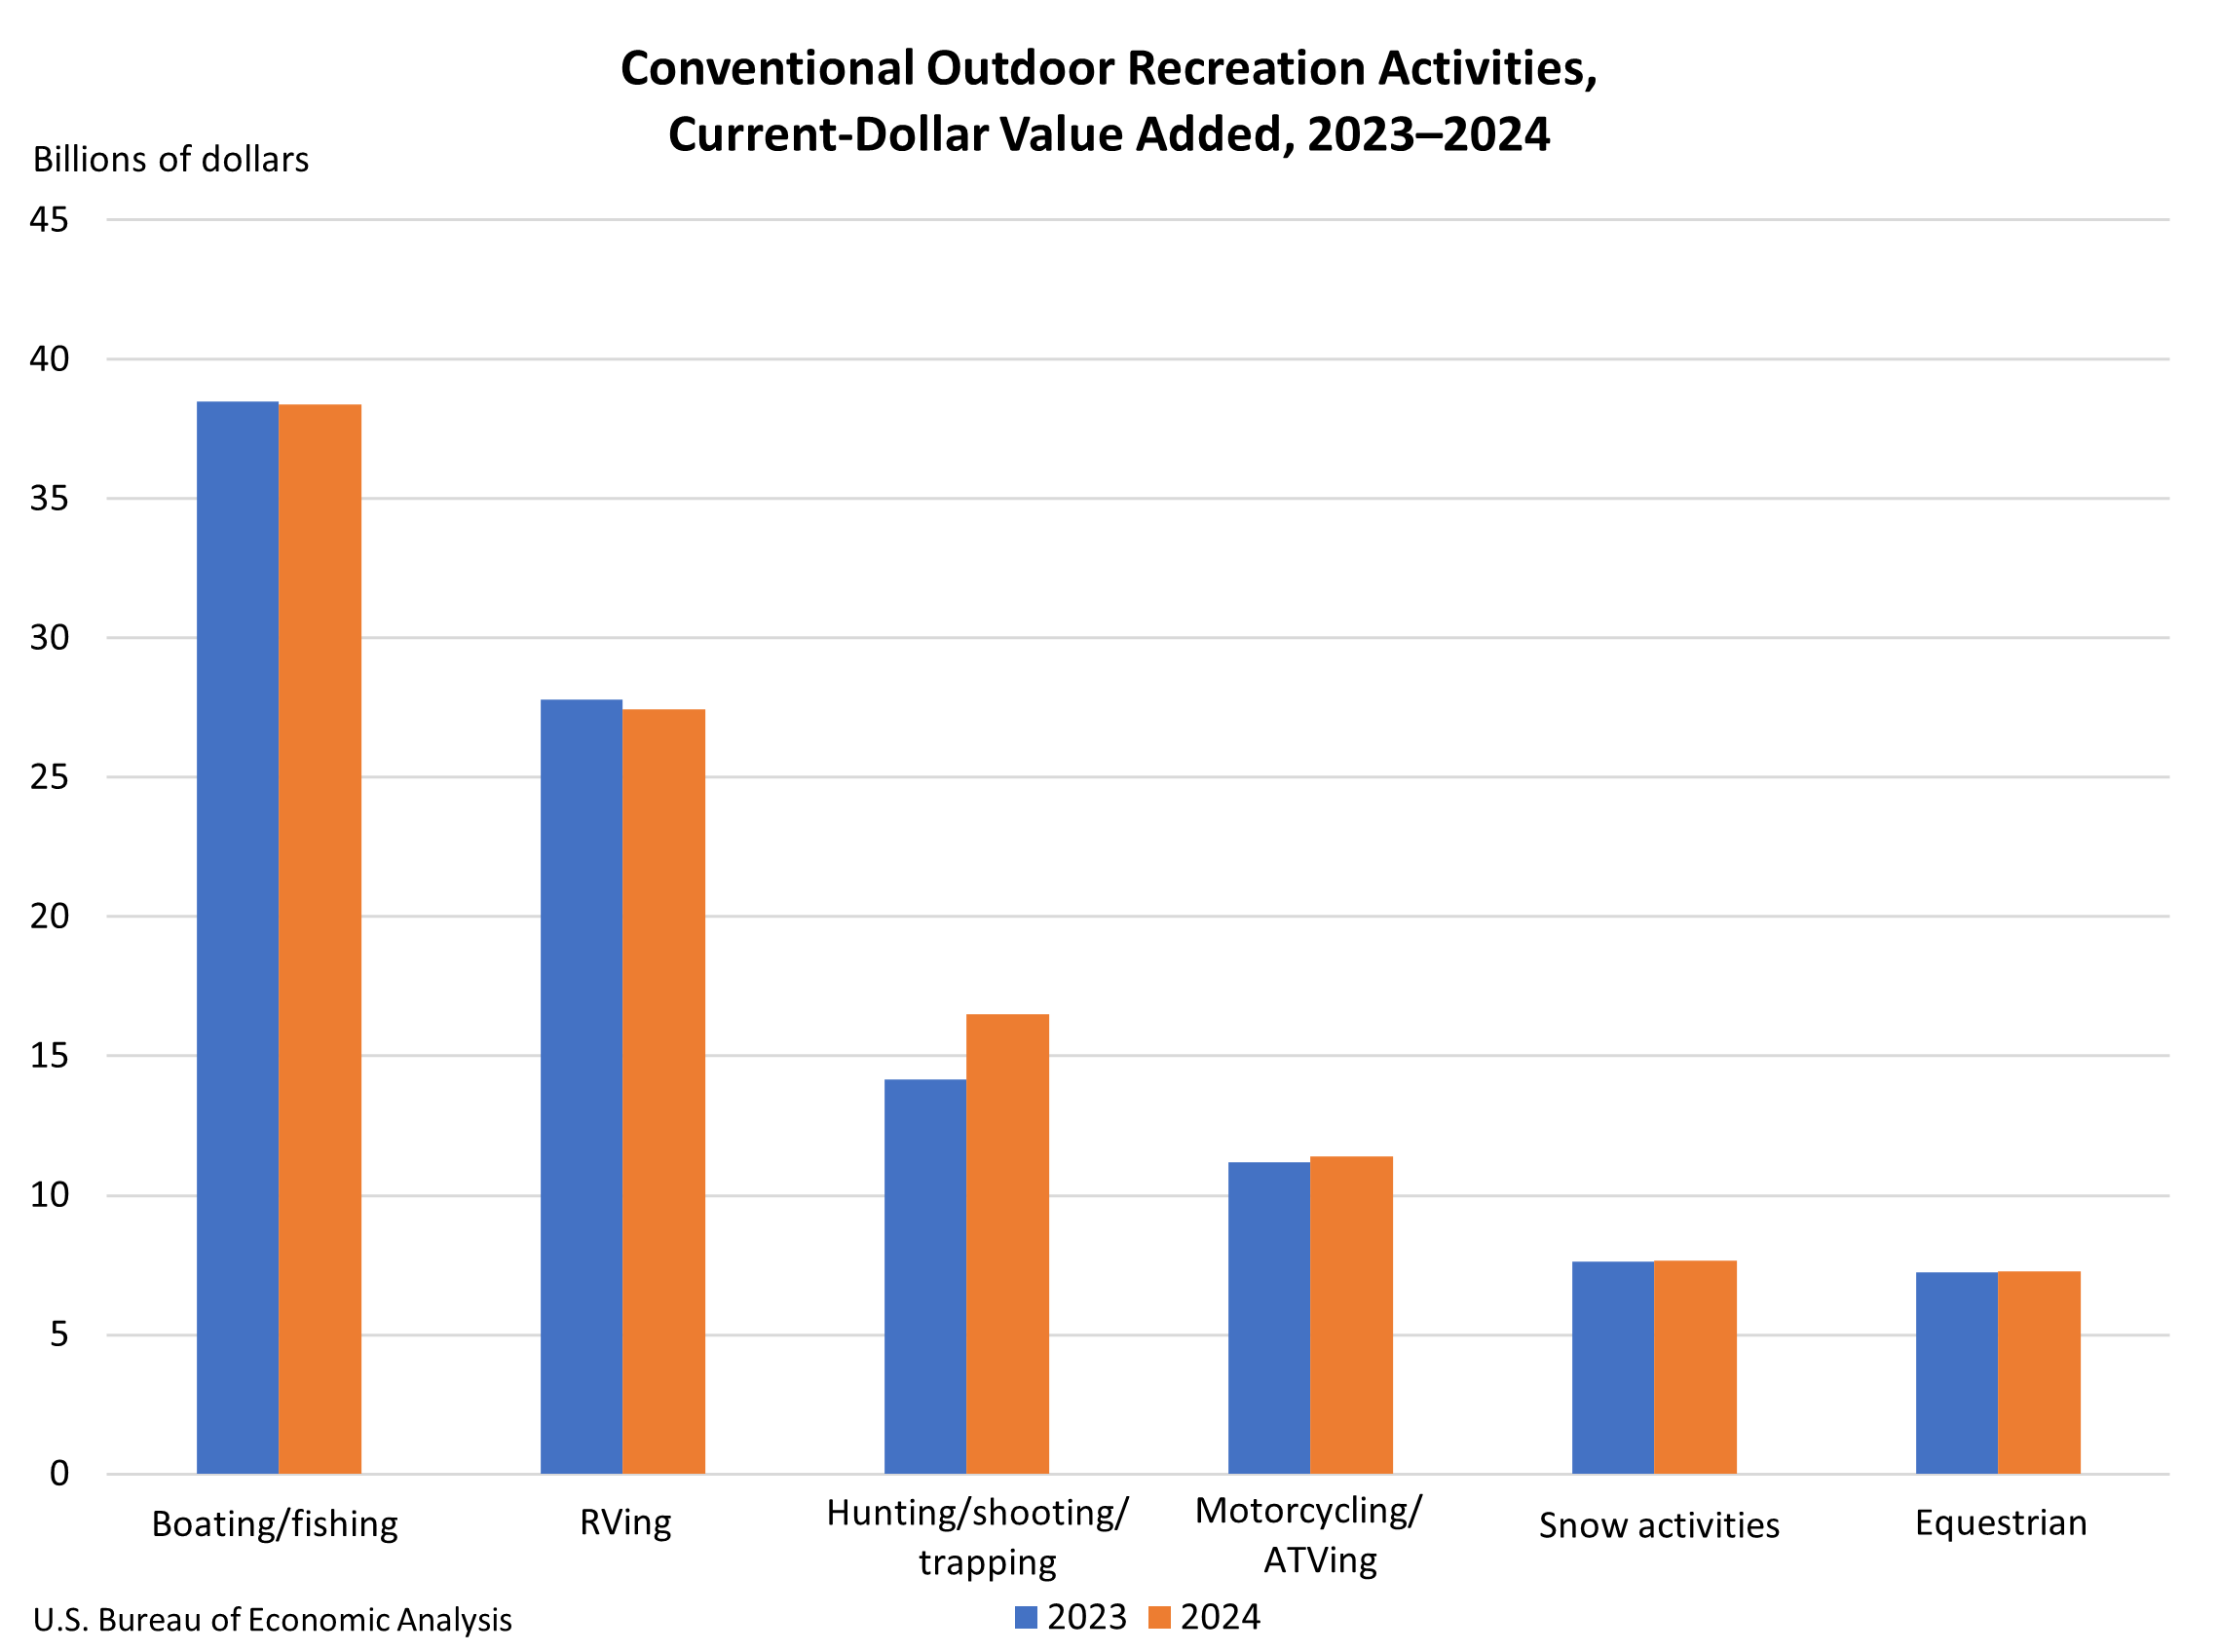
The provided image, "Outdoor Recreation by Category, Share of Current-Dollar Value Added, 2023-2024," visually represents this breakdown, illustrating the relative contributions of each category and their year-over-year changes. Further details on value added by specific conventional outdoor recreation activities are available in state table 2 and are visually depicted in the "Conventional Outdoor Recreation Activities, Current-Dollar Value Added, 2023-2024" image.
Industry Breakdown: Key Sectors Driving Outdoor Recreation
The BEA’s industry-specific data reveals which sectors are most instrumental in generating economic value within the outdoor recreation landscape. These statistics illuminate the direct and indirect impacts on value added, gross output, employment, and compensation.
-
Arts, Entertainment, Recreation, Accommodation, and Food Services: This industry group emerged as the leading contributor to the U.S. outdoor recreation economy in 2024, generating $174.4 billion in current-dollar value added, which is 25.0 percent of the total. This sector encompasses a wide array of businesses that directly cater to outdoor enthusiasts, including hotels, restaurants, amusement parks, museums, and recreational facilities. At the state level, this industry group was the largest contributor to outdoor recreation value added in 23 states and the District of Columbia. California, Florida, and New York stood out as the states with the highest contributions from this sector, with figures of $24.1 billion, $22.7 billion, and $11.8 billion, respectively.
-
Retail Trade: Ranking as the second-largest industry group, retail trade contributed $169.1 billion, or 24.3 percent, to the national outdoor recreation value added. This sector is crucial for providing the gear, apparel, and equipment necessary for a wide range of outdoor activities. Retail trade proved to be the dominant industry in 24 states. California again led in retail contributions with $19.3 billion, followed by Texas ($14.4 billion) and Florida ($13.4 billion).
-
Manufacturing: The manufacturing sector plays a vital role in producing outdoor recreation goods, contributing $91.3 billion, or 13.1 percent, to the national value added. This sector is responsible for the creation of everything from recreational vehicles and boats to sporting equipment and outdoor apparel. Manufacturing was the largest contributor to outdoor recreation value added in two states: Indiana and Louisiana. Texas led in manufacturing contributions with $13.1 billion, followed by California ($11.6 billion) and Indiana ($9.1 billion).
The "Industry Share of Outdoor Recreation, Current-Dollar Value Added, 2024" image provides a visual representation of these industry contributions to the overall outdoor recreation economy.
Methodology and Data Updates
The release of these comprehensive statistics is part of the BEA’s ongoing commitment to providing timely and accurate economic data. The estimates for 2020 through 2023 have been updated to incorporate the latest findings from the 2025 annual update of the National Economic Accounts. This update includes revisions to the National Income and Product Accounts (NIPA) and the Industry Economic Accounts, as well as newly available and revised source data. Similarly, the state-level statistics have been refined to reflect these updated national figures and the 2025 annual update of the Regional Economic Accounts, incorporating new and revised regional source data.
This continuous process of data refinement ensures that policymakers, businesses, and researchers have access to the most current and reliable information for understanding and planning within the outdoor recreation sector. Previously published estimates are accessible through the BEA’s Data Archive, allowing for historical analysis and trend identification.
Implications and Future Outlook
The consistently strong performance of the outdoor recreation economy highlights its significance as a major economic engine for the United States. The substantial contribution to GDP, robust job creation, and increasing compensation underscore the sector’s capacity to drive national and regional prosperity. The BEA’s detailed data provides invaluable insights for stakeholders, enabling informed decision-making in areas such as infrastructure development, conservation efforts, tourism promotion, and workforce training.
As consumer interest in health, wellness, and experiential activities continues to grow, the outdoor recreation sector is well-positioned for sustained expansion. The BEA’s commitment to regular updates and detailed analysis will be crucial in tracking these trends and ensuring that the economic potential of the outdoors is fully realized. The next release of Outdoor Recreation Economic Statistics for the U.S. and States, covering the year 2025, is anticipated in the Fall of 2026, promising further insights into this vital and dynamic sector of the American economy.
Additional Information
For a more in-depth understanding of definitions, statistical conventions, BEA regions, and the practical applications of these statistics, readers are encouraged to visit the BEA’s "Additional Information" page, which provides supplementary resources and context for the outdoor recreation economic data. This section offers a comprehensive guide for navigating the complexities of the report and its implications.