Lana Rhoades
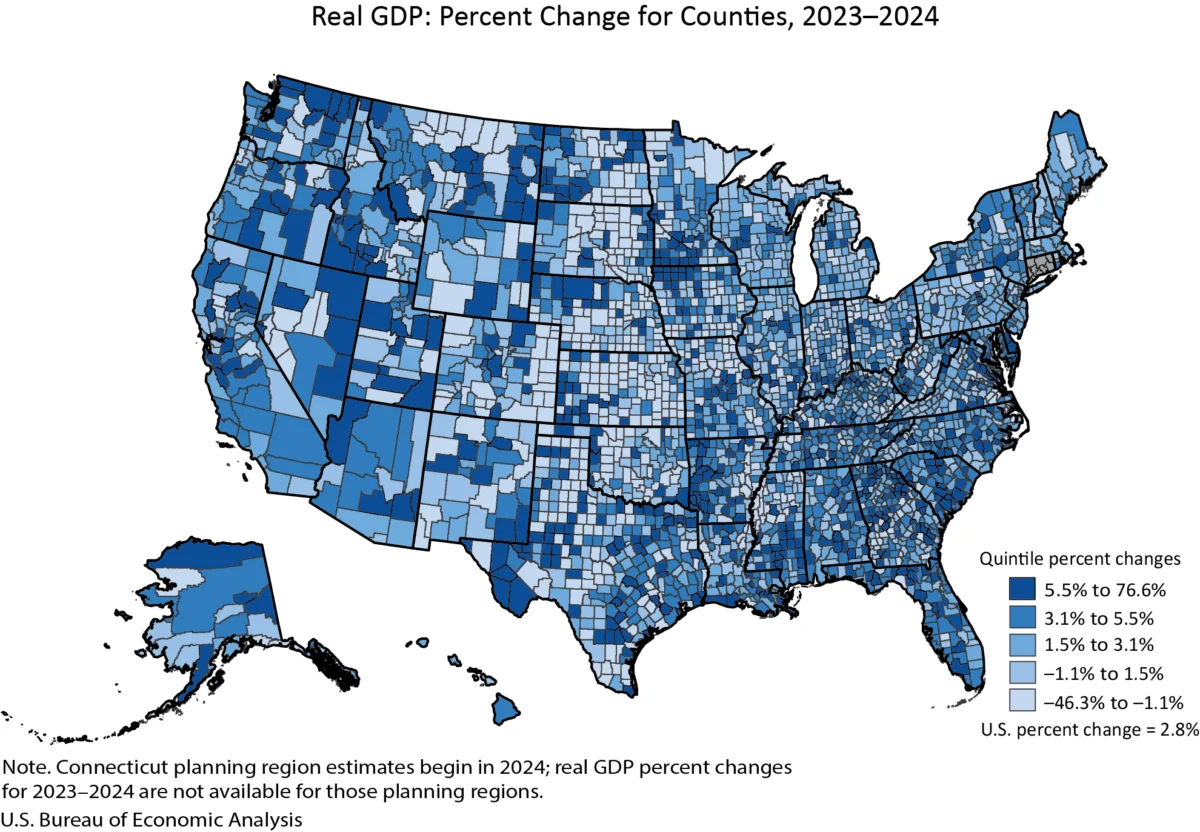
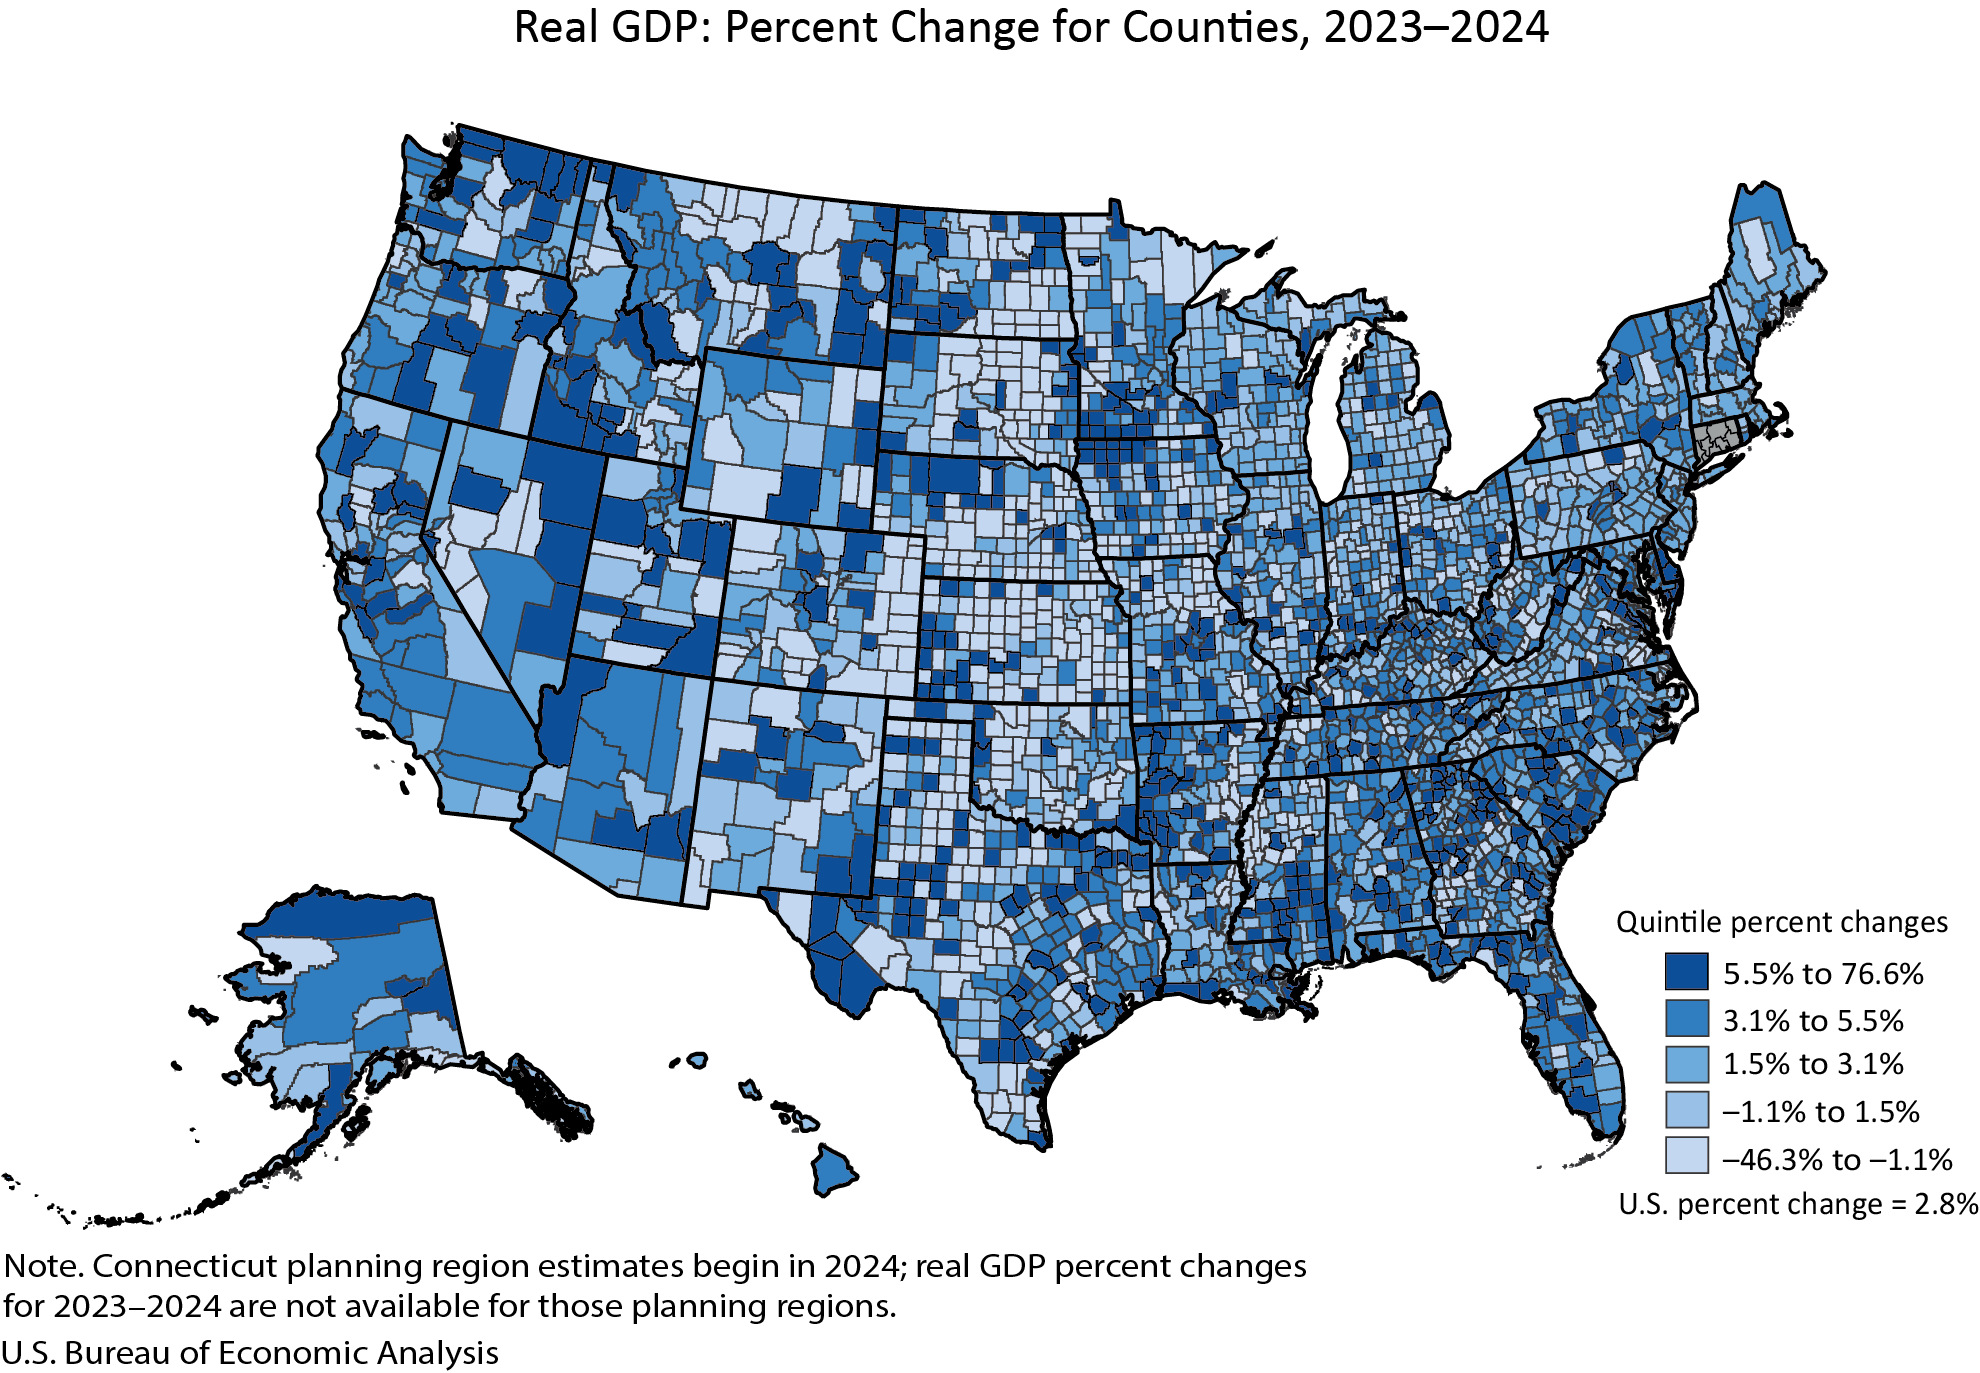
The economic landscape across the United States in 2024 presented a complex and varied picture, with real Gross Domestic Product (GDP) experiencing growth in a significant majority of counties but also significant declines in others, according to the latest estimates released by the U.S. Bureau of Economic Analysis (BEA). This divergence highlights the uneven distribution of economic activity and its impact on local communities. The data, which incorporates the latest annual updates to national and state-level economic accounts, offers a granular view of the economic health of America’s counties.
In 2024, an estimated 2,273 counties saw their real GDP expand, a positive sign for economic vitality in more than two-thirds of the nation’s counties. Conversely, 809 counties experienced a decrease in their real GDP, indicating economic contraction in a substantial portion of the country. A small fraction, just 24 counties, reported no discernible change in their economic output. These figures represent a snapshot of economic performance at the county level, reflecting local industry dynamics, employment trends, and consumer spending.
The magnitude of these changes varied dramatically. The most striking growth was observed in Carter County, Montana, which recorded an impressive 76.6 percent increase in real GDP. This surge suggests a period of significant economic development or expansion within the county, potentially driven by specific industries or investment. On the other end of the spectrum, Baca County, Colorado, faced a substantial economic downturn, with its real GDP declining by 46.3 percent. Such a sharp contraction signals significant economic challenges within the county, possibly linked to sector-specific issues or broader economic headwinds.
The sheer scale of economic activity also differs immensely across the nation. New York County, New York, which encompasses Manhattan, led the nation in total real GDP, boasting an astounding $813.7 billion in 2024. This figure underscores the county’s role as a global financial and commercial hub. In stark contrast, Issaquena County, Mississippi, recorded the smallest real GDP, at $15.7 million. This disparity illustrates the vast differences in economic size and capacity between the nation’s largest metropolitan centers and its smallest, often rural, counties.
County Economic Performance by Size and Population
The BEA’s analysis further breaks down these trends by county population size, offering insights into how different types of communities are faring economically.
Large Counties (Population > 500,000)
In 2024, large counties, those with a population exceeding 500,000, demonstrated a generally robust economic performance. Of these, 145 counties experienced GDP growth, while none reported a decline, and only one remained unchanged. The range of growth in these large economic engines was notable, with Pinal County, Arizona, leading the pack with a 10.7 percent increase. This suggests that large, populous counties are often well-positioned to capitalize on diverse economic opportunities and infrastructure.
Medium Counties (Population 100,000 to 500,000)
Medium-sized counties, defined as those with populations between 100,000 and 500,000, also showed positive economic momentum. A significant 451 of these counties saw their real GDP rise, while 20 experienced a decline, and three remained stable. Jefferson County, Texas, stood out with a remarkable 12.4 percent GDP increase, highlighting its economic dynamism. Black Hawk County, Iowa, however, faced a contraction, with its GDP decreasing by 2.6 percent, indicating localized economic challenges.
Small Counties (Population < 100,000)
The economic picture for smaller counties was more mixed. Among counties with a population under 100,000, a substantial 1,677 counties experienced GDP growth. However, this category also bore the brunt of economic declines, with 789 counties seeing their GDP fall, and 20 remaining unchanged. The extremes in growth and decline were most pronounced in this group. Carter County, Montana’s exceptional 76.6 percent surge, and Baca County, Colorado’s significant 46.3 percent drop, exemplify the volatility that can characterize smaller economies, which may be more susceptible to single-industry fluctuations or localized market shifts.
The economic size of these counties also varied significantly. In large counties, New York County, NY, stood out with its $813.7 billion GDP, while Pinal County, AZ, recorded $12.7 billion. Medium counties showcased a range from Mercer County, New Jersey’s $46.6 billion to Liberty County, Texas’s $2.6 billion. In small counties, the economic scale ranged from Martin County, Texas’s $15.1 billion down to Issaquena County, Mississippi’s $15.7 million. These figures emphasize that economic influence is not solely determined by population but also by industry concentration, resource endowments, and integration into broader economic networks.
Personal Income Trends Mirror Economic Activity
Beyond GDP, the BEA’s report also sheds light on personal income trends at the county level, providing another crucial dimension to understanding local economic well-being. Personal income, which includes income received by households from all sources, is a key indicator of household financial health and consumer spending power.
In 2024, personal income saw an increase in a commanding 2,768 counties, suggesting widespread improvements in household earnings across the nation. However, 331 counties experienced a decrease in personal income, and 7 reported no change. This indicates that while the overall trend for personal income was positive, a significant number of counties are still grappling with economic challenges that affect their residents’ earnings.
The range of personal income changes also showed considerable variation. Harding County, South Dakota, reported the highest percentage increase in personal income at 22.6 percent, pointing to significant income growth for its residents. Conversely, Issaquena County, Mississippi, which also had the lowest GDP, faced a substantial decline in personal income, dropping by 23.3 percent. This dual impact on both GDP and personal income highlights the severe economic challenges faced by this particular county.
The total level of personal income also varies dramatically across counties. Los Angeles County, California, boasted the highest personal income at $818.5 billion, reflecting its massive population and diverse, high-earning industries. At the other end of the scale, Loving County, Texas, reported the lowest personal income at $10.6 million, underscoring the vast economic disparities that exist within the United States.
Personal Income by Population Size
Similar to GDP, personal income trends were analyzed based on county population size:
Large Counties (Population > 500,000)
Large counties generally saw positive personal income growth, with 146 counties experiencing increases. San Joaquin County, California, showed a healthy 9.7 percent rise in personal income, while Philadelphia County, Pennsylvania, recorded a 2.7 percent increase. This indicates that large population centers are largely benefiting from economic opportunities that translate into higher household earnings.
Medium Counties (Population 100,000 to 500,000)
In medium-sized counties, 474 counties reported growth in personal income. Merced County, California, led this category with a 10.9 percent increase, followed by Genesee County, Michigan, with a 1.6 percent rise. These figures suggest that many mid-sized economies are also contributing to improved household financial well-being.
Small Counties (Population < 100,000)
Small counties exhibited a wider range of personal income performance. While 2,148 counties saw their personal income grow, 331 experienced declines, and 7 remained unchanged. Harding County, South Dakota’s impressive 22.6 percent growth exemplifies the potential for significant income gains in some smaller economies. However, Issaquena County, Mississippi’s sharp 23.3 percent decline highlights the vulnerability of some smaller communities to economic downturns.
The size of personal income in these counties also varied significantly. Large counties like Los Angeles County, CA, had $818.5 billion, with Pinal County, AZ, at $26.1 billion. Medium counties ranged from Collier County, FL’s $62.5 billion to Floyd County, GA’s $4.9 billion. Small counties saw Teton County, WY, at $12.4 billion, and Loving County, TX, at $10.6 million.
Methodology and Data Updates
The BEA’s release of county-level GDP and personal income data for 2024 is built upon a foundation of rigorous statistical methods and annual updates. The estimates released today incorporate the results of BEA’s comprehensive annual updates for both GDP and personal income by county. Crucially, this release also includes revisions to the county-level estimates for GDP and personal income from 2020 through 2023. These revisions are a standard part of the BEA’s statistical process, designed to incorporate more complete and up-to-date source data as it becomes available. This ensures that the economic picture painted by the data is as accurate and reflective of current conditions as possible.
The alignment of county data with broader national economic accounts is a key feature of this update. The 2024 estimates are now consistent with the annual update to the National Income and Product Accounts (NIPA), which was released on September 25, 2025, and the annual update to personal income and GDP by state statistics, released on September 26, 2025. This integration ensures that county-level data fits seamlessly into the larger framework of U.S. economic measurement, providing a consistent and reliable overview from the national to the local level.
A significant methodological change for 2024 involves Connecticut’s data. For the first time, GDP and personal income estimates for Connecticut will be based on the state’s planning region geographic definitions, rather than its traditional county definitions. This shift reflects a move towards aligning statistical reporting with the administrative and planning structures of the state. However, because these planning region estimates are only available for 2024, they have not been included in the percent change ranges reported in this release, which rely on year-over-year comparisons using consistent geographic units.
Furthermore, the BEA also released new estimates for per capita personal income for 2024. These estimates are derived by dividing total personal income by population figures provided by the U.S. Census Bureau, offering a measure of average income per person. The per capita personal income estimates have been updated for the years 2020 through 2024, providing a consistent historical series for this important metric.
Evolving Data Presentation and Discontinuation of Certain Statistics
This year’s release marks a significant shift in how BEA presents its county-level economic data. For the first time, annual GDP and personal income by county have been published in a single, combined news release. This integration aims to provide a more holistic and efficient view of county economies, replacing the previous practice of issuing two separate news releases on different days. This consolidation is intended to streamline information dissemination and offer users a more comprehensive understanding of local economic conditions in one place.
In conjunction with this combined release, BEA has also discontinued the publication of statistics for several types of geographic areas, including metropolitan statistical areas, micropolitan statistical areas, metropolitan divisions, combined statistical areas, and the metropolitan and nonmetropolitan portions of these areas. While GDP and personal income estimates will continue to be available for counties, the discontinuation of these other area statistics reflects a strategic decision by BEA to focus its reporting and resources. Users seeking more information on this change are directed to the BEA’s Frequently Asked Questions (FAQ) section.
The presentation of data tables has also undergone a transformation. Data previously embedded within the county news releases are now updated and accessible simultaneously through BEA’s online Interactive Data Application. This move is designed to reduce redundancy and improve efficiency, directing data users to a more robust and flexible platform for data exploration. The Interactive Data Application allows for customization, including full time series, and offers data downloads in various formats such as PDF, Excel, and CSV. Links to these customizable tables are provided within the news release for easy access.
Future Releases and Data Accessibility
The BEA remains committed to providing timely and comprehensive economic data. The next release of GDP and personal income by county statistics is scheduled for December 2, 2026, at 8:30 a.m. Eastern Standard Time, which will cover the 2025 data. Upon the release of the 2025 data, the 2024 estimates will be superseded in the primary interactive tables. However, the original 2024 data will remain accessible through BEA’s Data Archive, ensuring historical continuity and research capabilities.
For users seeking detailed historical time series and the specific data tables highlighted in this release, the BEA’s Interactive Data Application provides direct access. Links are provided for GDP by county summary tables, including percent change and levels, and for personal income by county summary tables, also offering percent change and levels. These tools empower researchers, policymakers, and the public to delve deeper into county-level economic trends and perform their own analyses.
The BEA also provides additional contextual information, including definitions, statistical conventions, BEA regions, and the uses of these statistics, which can be found in the "Additional Information" section of their releases. This comprehensive approach aims to ensure that users have the resources necessary to understand and utilize the economic data effectively. The ongoing evolution of data presentation and the commitment to providing detailed, accessible economic information underscore BEA’s role in informing economic understanding and policy at all levels of government and across the private sector.