

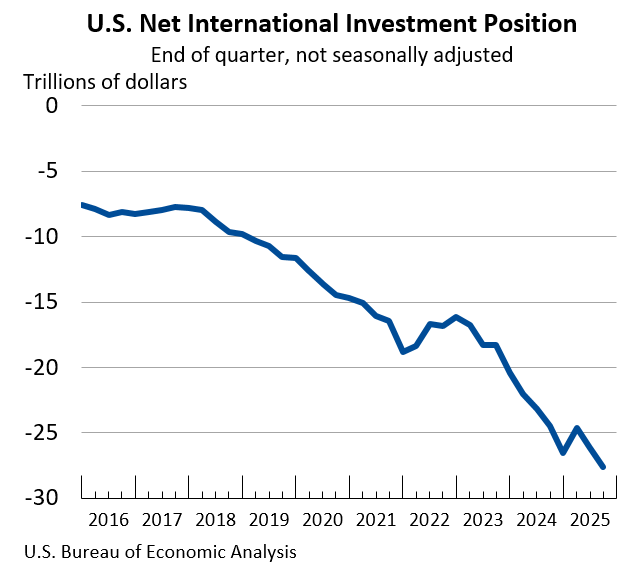
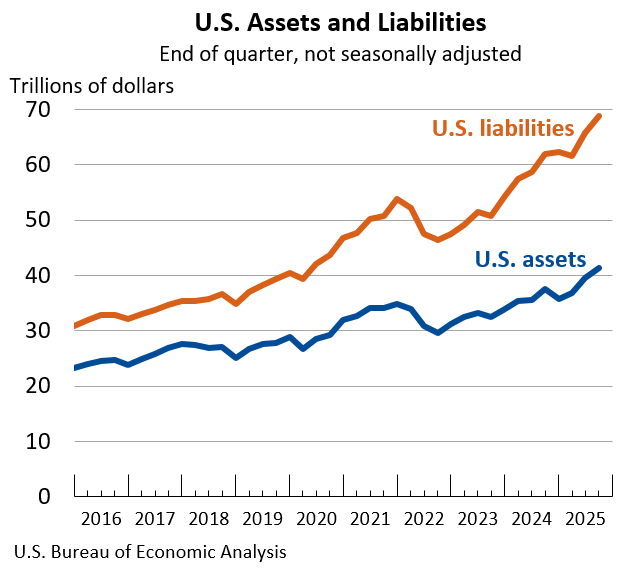
The United States’ net international investment position, a key indicator of its financial standing with the rest of the world, deteriorated to a record negative $27.61 trillion at the close of the third quarter of 2025. This figure, representing the difference between assets owned by U.S. residents abroad and foreign-owned assets within the U.S., was released today by the U.S. Bureau of Economic Analysis (BEA). The latest statistics reveal that U.S. foreign financial assets stood at $41.27 trillion, while foreign liabilities held by U.S. residents reached $68.89 trillion. This marks a significant decline from the revised negative $26.16 trillion position recorded at the end of the second quarter of 2025.
Deepening Deficit Driven by Market Fluctuations and Transactions
The substantial $1.46 trillion widening of the net investment position between the second and third quarters of 2025 was a confluence of two primary forces: net financial transactions and net other changes, primarily driven by price and exchange-rate fluctuations. Net financial transactions accounted for a negative $386.1 billion, indicating that overall, foreign entities invested more in U.S. assets than U.S. entities invested abroad during the quarter. However, the more significant driver of the deficit’s expansion was the net other changes, which amounted to a substantial negative $1.07 trillion.
This considerable negative impact from "other changes" was largely attributed to price movements. Specifically, the BEA report highlights that increases in U.S. stock prices outpaced those in foreign stock markets. While this might seem counterintuitive, it resulted in a greater appreciation of the market value of U.S. liabilities (assets owned by foreigners in the U.S.) compared to the appreciation of U.S. assets held abroad. This dynamic effectively widened the gap between liabilities and assets, contributing to the negative shift in the net investment position.
U.S. Assets Show Growth, Driven by Equity and Direct Investments
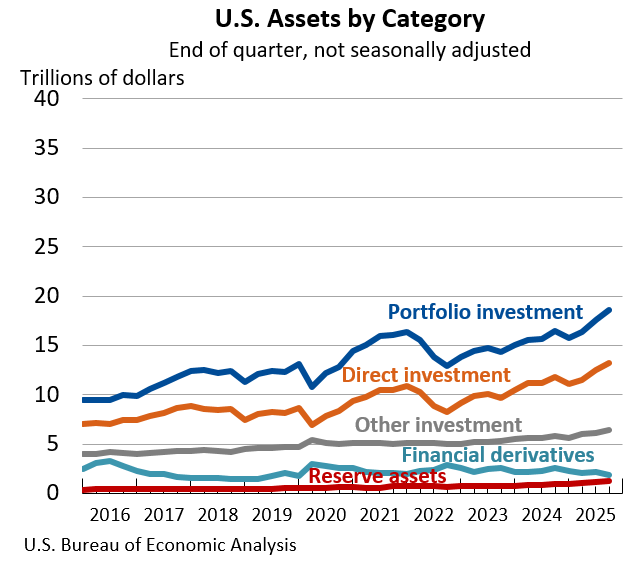
Despite the overall negative trend, U.S. foreign financial assets experienced a notable increase, rising by $1.71 trillion to reach a total of $41.27 trillion by the end of the third quarter. This growth was predominantly fueled by the performance of equity markets. Increases in foreign stock prices significantly boosted the market value of U.S. portfolio investment assets by $863.0 billion and direct investment assets by $609.4 billion. Portfolio investment encompasses holdings of foreign stocks and bonds, while direct investment refers to ownership or control of significant stakes in foreign businesses.
Across the board, most major categories of U.S. assets saw an increase in value during the third quarter, with the exception of financial derivatives. This broad-based appreciation underscores the positive performance of global financial markets, particularly in equity sectors, which benefited U.S. holdings abroad.
Liabilities Surge Amidst Strong Foreign Demand for U.S. Securities
The surge in U.S. liabilities was even more pronounced, escalating by $3.17 trillion to a formidable $68.89 trillion at the close of the third quarter. This substantial increase was primarily driven by the robust performance of U.S. equity markets, which significantly elevated the market value of foreign-held portfolio investment and direct investment liabilities. Foreign holdings of U.S. stocks and other equity instruments saw their value rise by $1.39 trillion, while foreign direct investment in the U.S. appreciated by $1.20 trillion.
Beyond market valuations, financial transactions also played a crucial role in the escalation of U.S. liabilities. Net financial transactions contributing to liabilities amounted to $797.8 billion. This inflow was largely characterized by foreign purchases of U.S. equity securities and long-term debt securities, such as U.S. Treasury bonds and corporate bonds. The strong foreign appetite for U.S. financial instruments signals continued confidence in the U.S. economy and its investment opportunities, even as the overall net investment position widened. Similar to assets, all major categories of U.S. liabilities, excluding financial derivatives, experienced an increase in the third quarter.
Context and Historical Trends
The U.S. net international investment position has been in negative territory for several decades, reflecting a long-standing trend of the U.S. being a net debtor nation. This means that foreigners collectively own more assets in the U.S. than U.S. residents own abroad. Historically, the U.S. has been able to finance its current account deficits by attracting foreign capital, often due to its role as a safe haven for investment and the global prominence of the U.S. dollar.
The current negative position of $27.61 trillion is a cumulative result of persistent trade deficits, where the value of imports exceeds exports, and significant foreign investment inflows. While a negative net international investment position is not inherently a crisis indicator, a rapidly widening deficit, especially when driven by factors beyond purely market appreciation, can raise concerns about long-term financial stability and the nation’s capacity to service its foreign obligations. The BEA’s data provides a quarterly snapshot, and economists will be closely monitoring the trend in subsequent quarters to assess its sustainability.
Revisions to Second-Quarter Data
In conjunction with the release of third-quarter figures, the BEA also provided revised estimates for the second quarter of 2025. The initial preliminary estimate for the net international investment position at the end of the second quarter was a negative $26.14 trillion. This has been revised slightly upward to a negative $26.16 trillion. U.S. assets remained unchanged at $39.56 trillion, while U.S. liabilities saw a minor upward revision from $65.71 trillion to $65.72 trillion. These revisions, while small, underscore the dynamic nature of these economic statistics and the ongoing refinement of data by the BEA.
Future of BEA Reporting: A Consolidated Approach
The BEA announced significant changes to its reporting schedule and format, aiming to provide a more integrated view of the U.S. global economic engagement. Beginning in March 2026, the quarterly U.S. international transactions and international investment position accounts will be published in a single, consolidated news release. This move is intended to accelerate the availability of international investment position statistics and offer a broader perspective on the U.S. economy’s interaction with the global marketplace.
Furthermore, as part of its modernization efforts, the BEA will transition away from including detailed tables directly within the news release body. Instead, the consolidated release will feature dynamic links directing users to the BEA’s Interactive Data Application. This application provides comprehensive, customizable data tables with full time series, offering greater flexibility for data analysis and download options in various formats, including PDF, Excel, and CSV. This shift is designed to reduce duplication, enhance efficiency, and ensure data users have direct access to the most complete and up-to-date information.
Upcoming Releases
The next release from the BEA, scheduled for March 25, 2026, at 8:30 a.m. EDT, will cover the U.S. International Transactions and Investment Position for the fourth quarter and the full year of 2025. Subsequent releases in 2026 are slated for June 24 (First Quarter and Annual Update), September 24 (Second Quarter), and December 18 (Third Quarter). These upcoming reports will be crucial for tracking the ongoing trajectory of the U.S. net international investment position and understanding its drivers in the evolving global economic landscape. The continued monitoring of these figures will be essential for policymakers, financial institutions, and investors alike as they navigate the complexities of international finance.