
The U.S. Bureau of Economic Analysis (BEA) today unveiled its comprehensive annual statistics for 2024, offering a detailed look at real personal consumption expenditures, real personal income, and regional price parities across all 50 states and the District of Columbia. This release provides crucial insights into the economic health and disparities at the state level, offering a snapshot of consumer spending, income growth, and the cost of living throughout the nation. The data reveals a generally positive economic trend, with most states experiencing growth in both real personal consumption expenditures and real personal income, although significant regional variations persist.
Real Personal Consumption Expenditures Show Broad-Based Growth
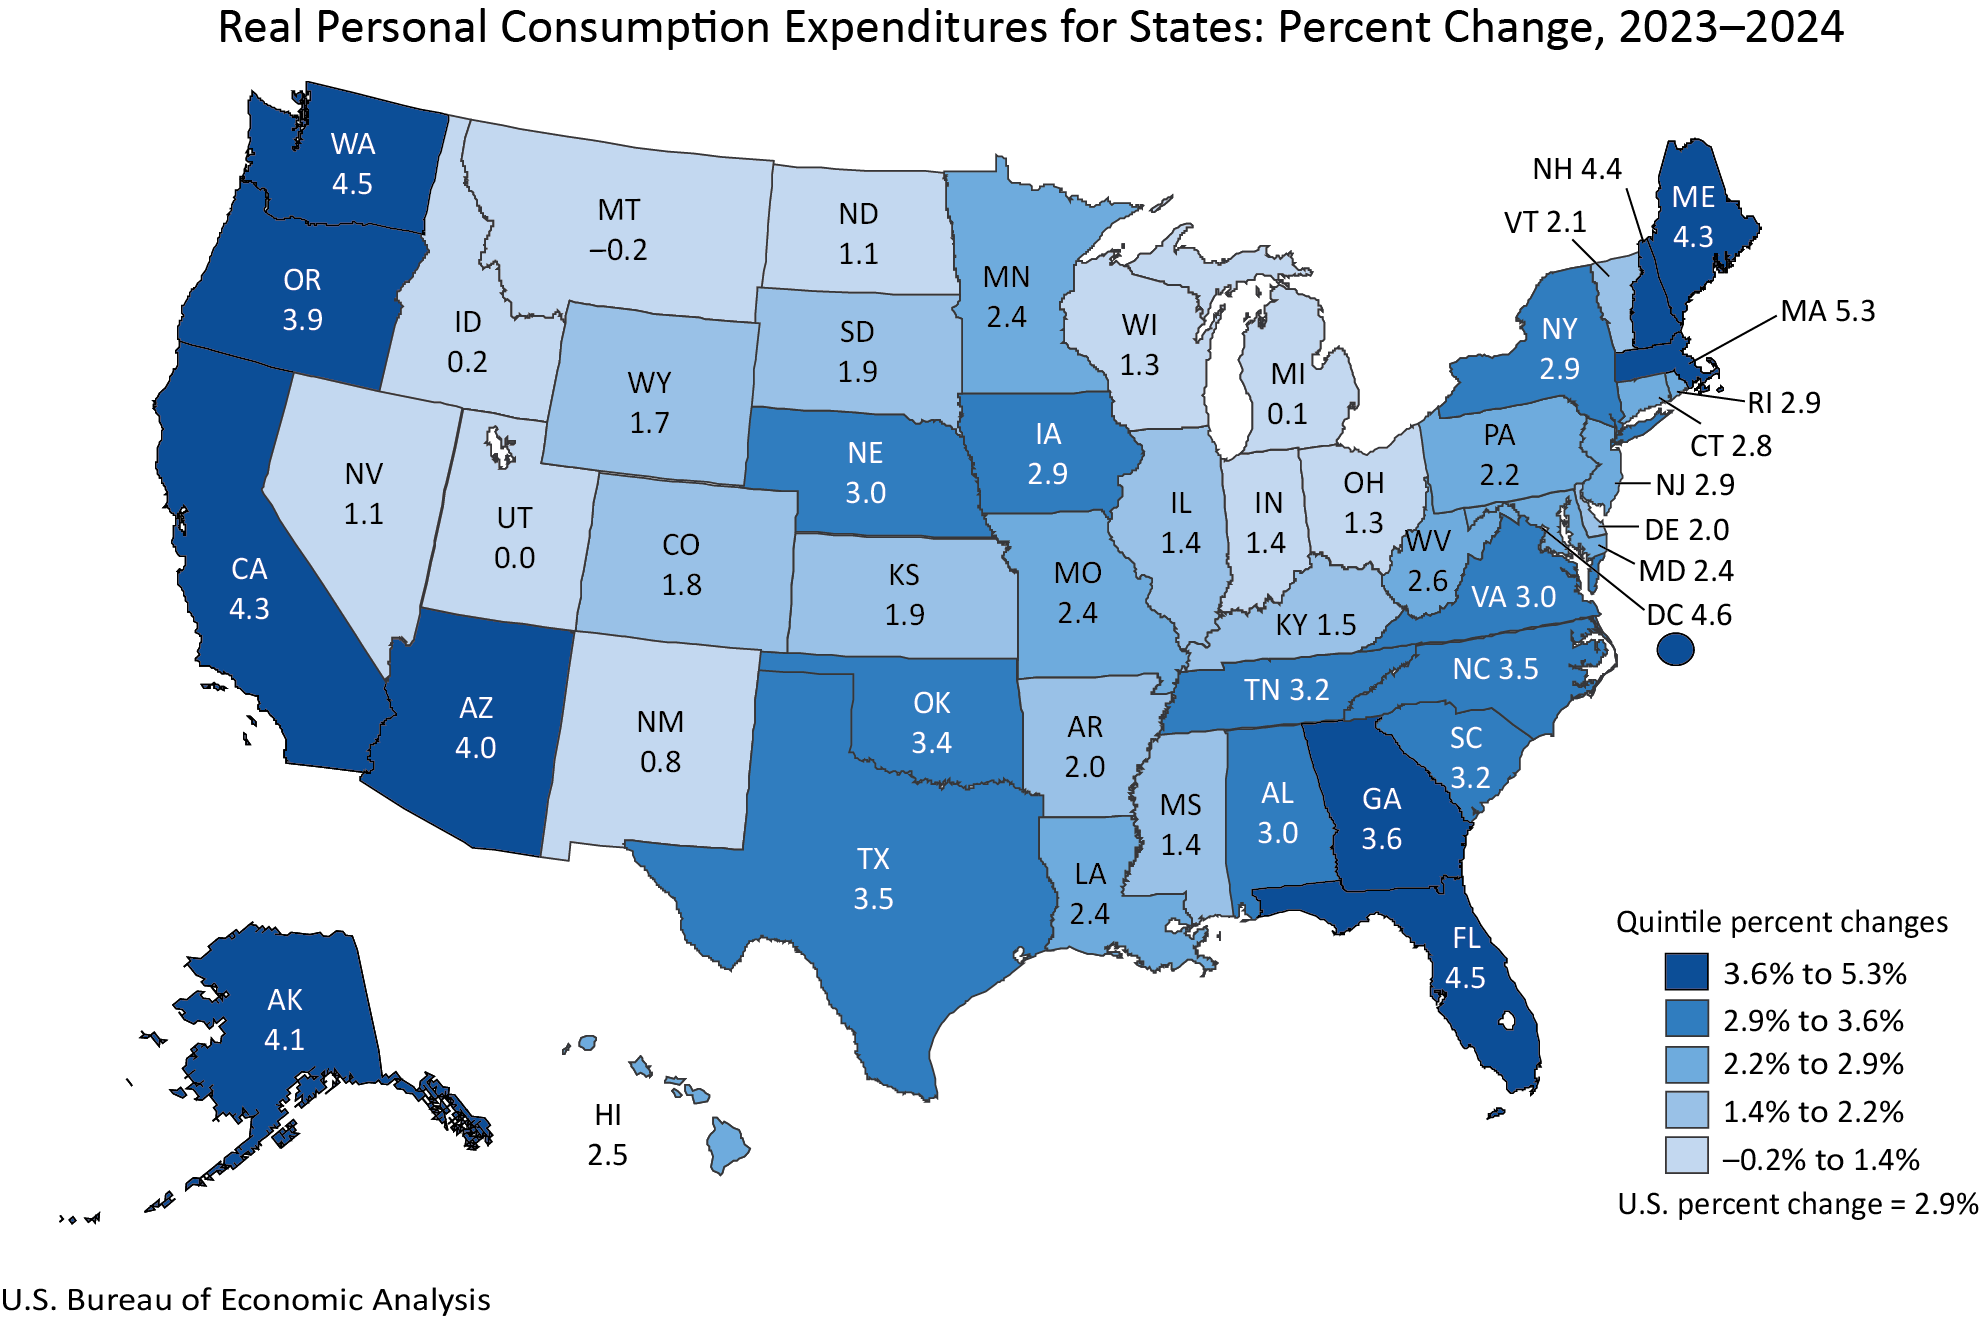
A significant majority of U.S. states and the District of Columbia experienced an increase in real personal consumption expenditures (PCE) in 2024, signaling a robust expansion in consumer spending nationwide. The BEA reported that 48 states and the District of Columbia saw their real PCE rise. The extent of this growth varied considerably, with Massachusetts leading the nation with a remarkable 5.3 percent increase. Conversely, Montana was the only state to register a slight decline, with its real PCE falling by 0.2 percent.
Real PCE, a key indicator of consumer demand, represents the value of goods and services purchased by households, adjusted for inflation. The national average for real PCE growth in 2024 stood at 2.9 percent. This figure indicates that, on average, Americans were spending more on goods and services after accounting for price changes.
The BEA’s methodology for calculating real PCE involves adjusting current-dollar estimates by regional price parities (RPPs) and the national PCE price index. RPPs are critical for understanding the true purchasing power of consumers in different regions, as they account for variations in the cost of living. The national PCE price index, meanwhile, measures the overall inflation rate for consumer goods and services.
In current dollars, personal consumption expenditures nationwide saw a more substantial increase of 5.6 percent in 2024. This growth outpaced the national PCE price index, which recorded an inflation rate of 2.6 percent for the year. The divergence between current-dollar and real PCE growth underscores the importance of inflation adjustments in understanding the actual volume of goods and services consumed. The higher current-dollar growth suggests that while prices did rise, consumer spending increased at a faster pace, leading to a real increase in consumption.
The data on real PCE by state provides a granular view of economic activity. States with strong tourism, robust job markets, or significant technological sectors often exhibit higher PCE growth. The leading performance of Massachusetts, for instance, could be attributed to its thriving biotechnology and financial services industries, as well as a generally high level of disposable income. The minor contraction in Montana might be influenced by factors such as a slower pace of economic diversification or specific regional economic challenges.
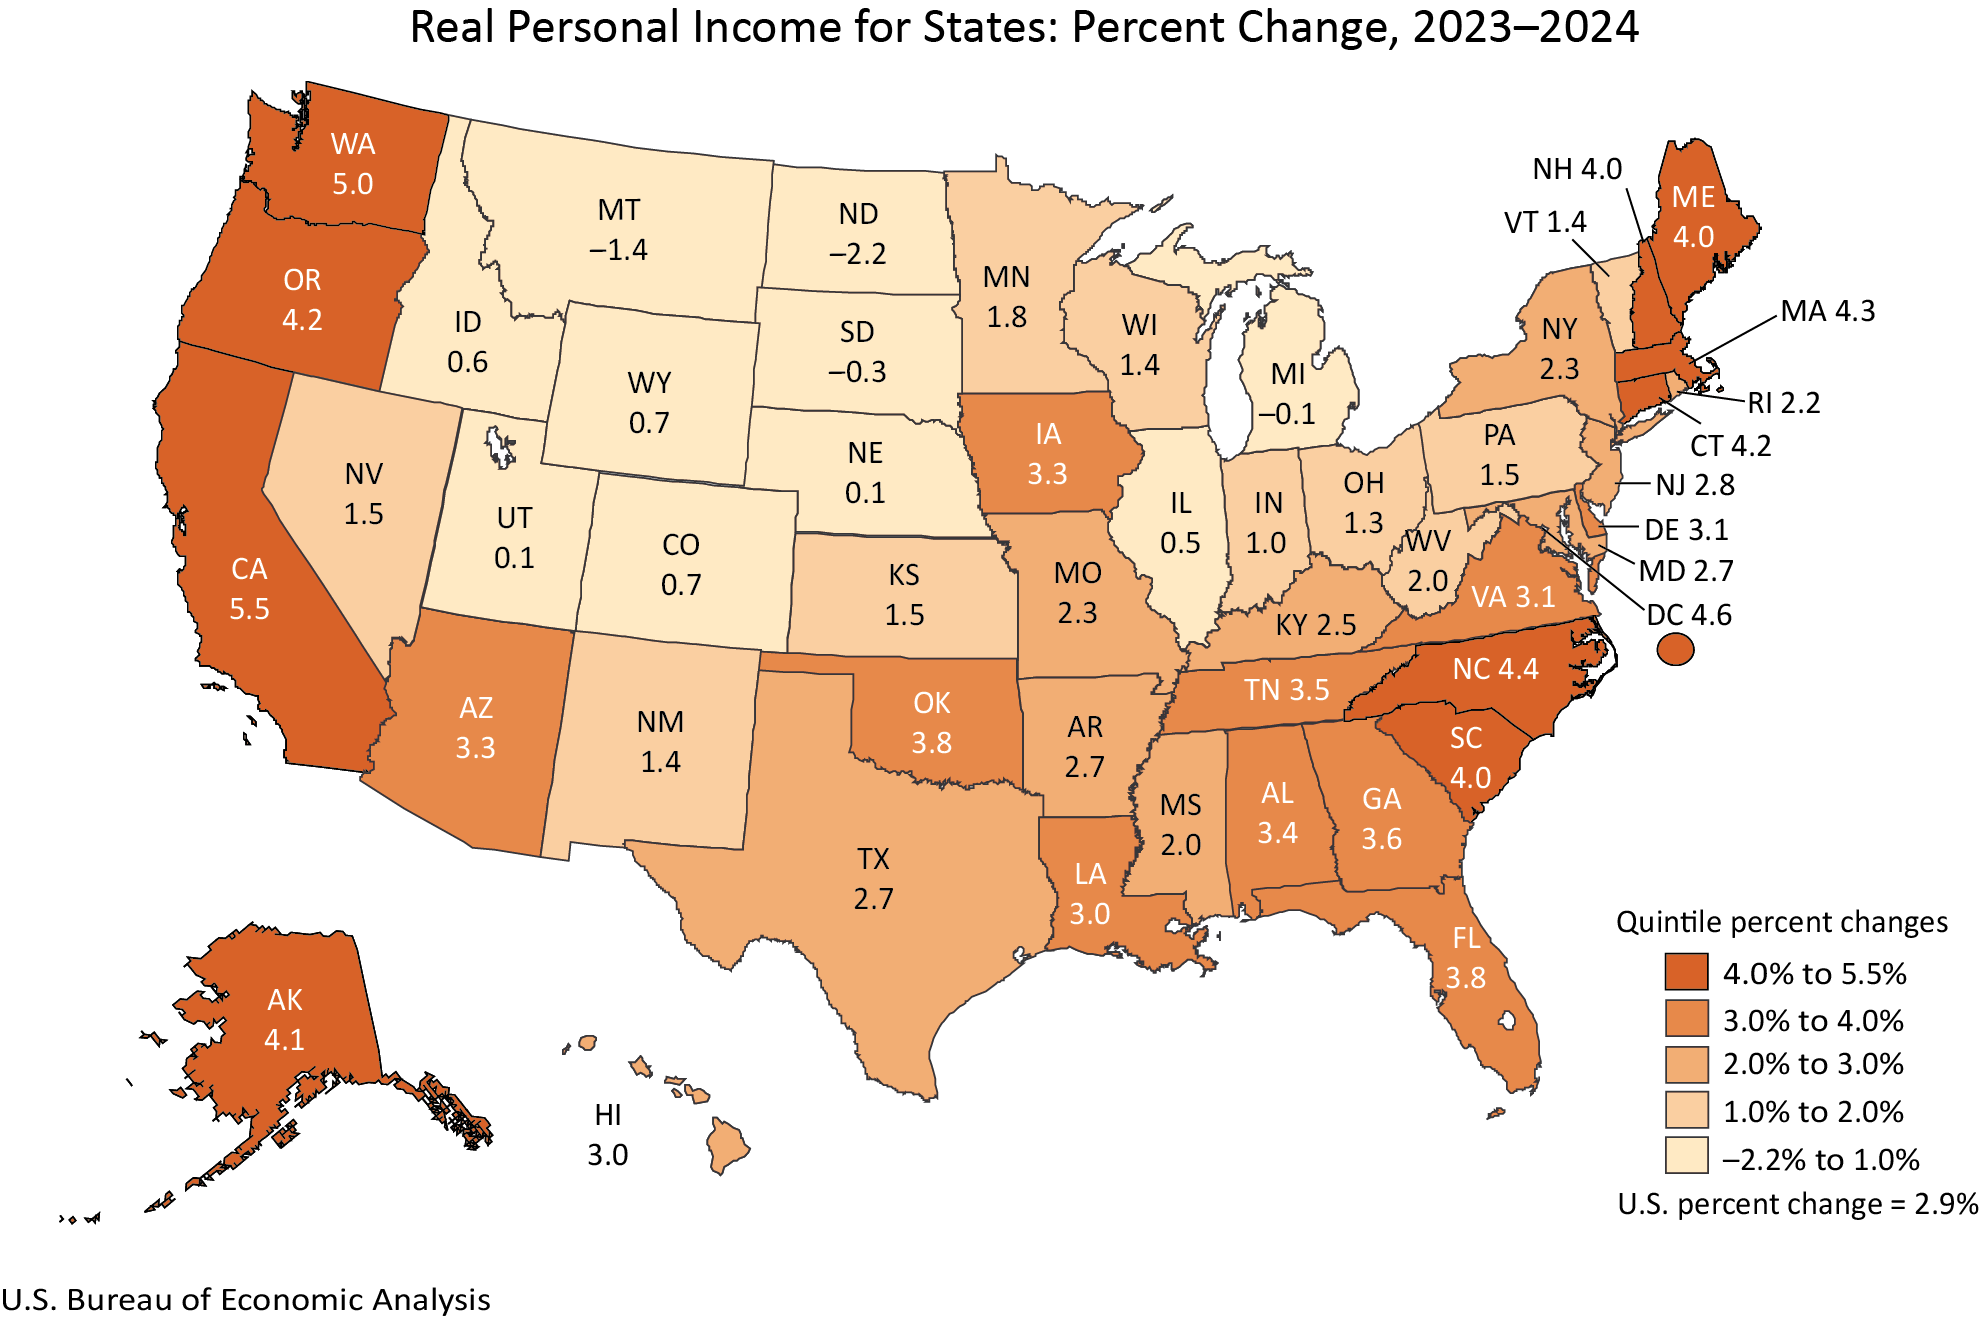
Real Personal Income Exhibits Widespread Gains
Parallel to the growth in consumption, real personal income also saw widespread increases across the United States in 2024. A total of 46 states and the District of Columbia reported an uptick in real personal income. California emerged as the top performer in this category, with its real personal income soaring by 5.5 percent. In contrast, North Dakota experienced a decline of 2.2 percent in real personal income.
Real personal income is a measure of the income received by individuals from all sources, adjusted for inflation and the cost of living in their region. This metric is vital for understanding the purchasing power of households and their capacity to spend and save.
Similar to real PCE, regional estimates of real personal income are derived by adjusting current-dollar personal income by the relevant regional price parity and the national PCE price index. This ensures that comparisons across states reflect genuine differences in income and purchasing power.
Nationally, real personal income increased by 2.9 percent in 2024, mirroring the growth rate of real PCE. This suggests a balanced economic environment where income growth kept pace with consumption growth, on average.
Current-dollar personal income nationwide grew by 5.6 percent in 2024, again outpacing the national PCE price index. This indicates that, similar to consumption, individuals’ nominal incomes rose faster than inflation, leading to an increase in their real purchasing power.
The strong performance in California, the nation’s most populous state and a global economic powerhouse, can be linked to its diverse and innovative economy, including its technology, entertainment, and agricultural sectors. The decline in North Dakota, however, warrants closer examination. Historically, North Dakota’s economy has been heavily influenced by the energy sector, particularly oil production. Fluctuations in global energy prices or shifts in production could significantly impact its personal income figures.
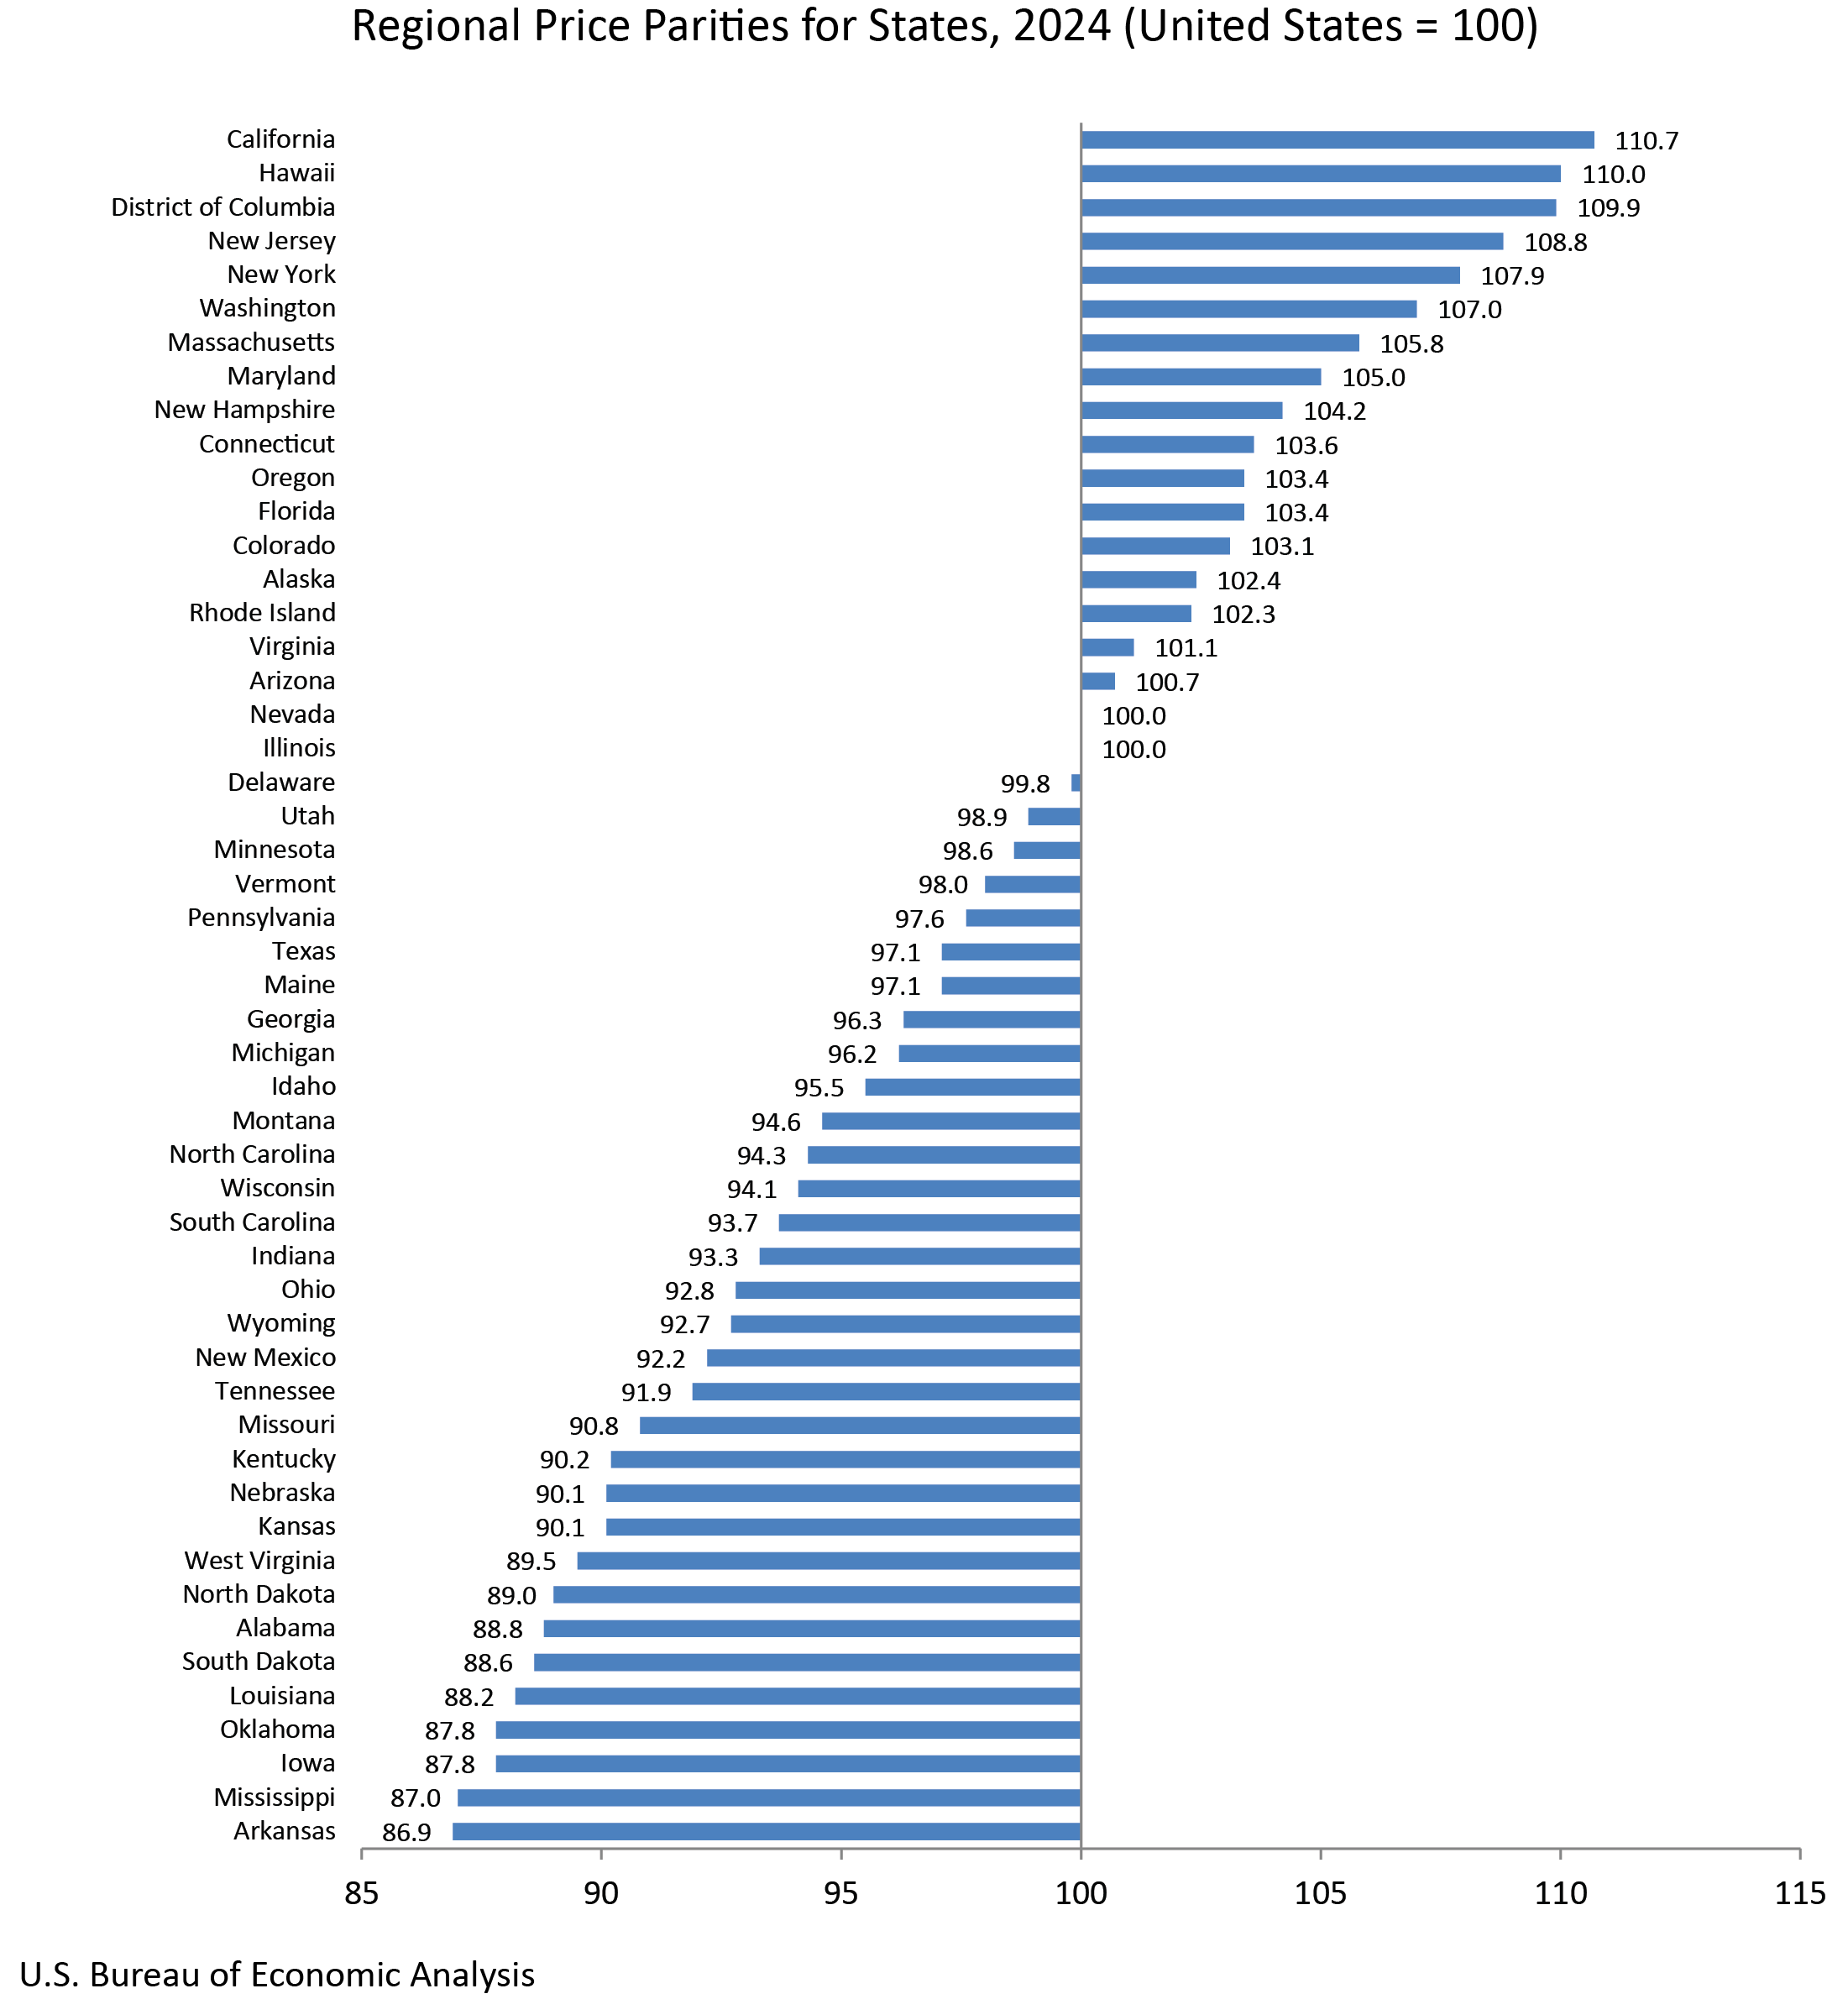
Regional Price Parities Highlight Cost of Living Disparities
The BEA’s release also includes crucial data on regional price parities (RPPs), which measure the differences in price levels across states for a given year. These indices are expressed as a percentage of the overall national price level, providing a standardized way to compare the cost of living.
The "all items RPP" encompasses all consumption goods and services, including housing rents. Housing costs, particularly rent, are often identified as a primary driver of variations in RPPs among states. This means that states with high housing costs will naturally have higher RPPs, indicating that a dollar in that state buys less than a dollar in a state with lower housing expenses.
For instance, states with highly competitive housing markets, such as those in the Northeast or West Coast, are likely to exhibit higher RPPs compared to states in the Midwest or South with more affordable housing. This has significant implications for the real value of income and the purchasing power of consumers. A reported income of $60,000 in a high-cost state might offer a comparable standard of living to $40,000 in a low-cost state.
The BEA also provides metropolitan area RPP statistics on its website, allowing for even more localized comparisons of price levels. This level of detail is invaluable for policymakers, businesses, and individuals making decisions about location, investment, and financial planning.
Revisions and Discontinuation of Data
This year’s release is accompanied by significant updates and changes in data presentation. The BEA has revised its annual estimates of real PCE by state and real personal income by state for the period spanning from 2008 to 2023. These revisions incorporate more comprehensive and detailed source data, ensuring greater accuracy and alignment with national economic accounts. This alignment with the National Income and Product Accounts (NIPA) and GDP by industry statistics, released on September 25, 2025, and GDP, personal income, and PCE by state statistics released on September 26, 2025, signifies a commitment to maintaining the highest standards of economic measurement.
Furthermore, the BEA has introduced new estimates for real per capita PCE and real per capita personal income for 2024. These per capita figures, calculated using U.S. Census Bureau population data from 2020 through 2024, offer a standardized measure of economic well-being per individual.
A notable change in this release is the discontinuation of statistics for metropolitan statistical areas and their metropolitan and nonmetropolitan portions for real PCE and real personal income. While these detailed breakdowns are no longer being published, real PCE and real personal income estimates will continue to be available at the state level. RPPs will still be published for both state and local areas, maintaining a level of geographic detail for price comparisons. This decision reflects a strategic reallocation of resources and a focus on core state-level economic indicators.
Evolving Data Presentation
In line with its commitment to modernizing data dissemination, the BEA has also updated the presentation of its tables. Data previously embedded within news releases are now exclusively available through the BEA’s online Interactive Data Application. This shift aims to reduce redundancy, enhance efficiency, and provide users with direct access to more complete and flexible data tables. These customizable tables allow for the selection of full time series and can be downloaded in various formats, including PDF, Excel, and CSV. This move is intended to streamline data access and empower users to conduct their own analyses more effectively.
Looking Ahead: Future Releases and Data Archives
The BEA has announced that the 2024 data released today will be superseded by new statistics for 2025, scheduled for release on December 10, 2026. The upcoming release will cover real personal consumption expenditures by state and real personal income by state for 2025. Data users seeking to access the original figures from the current release will be able to find them in BEA’s Data Archive, ensuring historical continuity and accessibility.
The ongoing release of these detailed state-level economic indicators by the Bureau of Economic Analysis is crucial for understanding the diverse economic landscape of the United States. The data on real personal consumption expenditures, real personal income, and regional price parities provide essential benchmarks for policymakers, economists, businesses, and the public to assess economic trends, regional disparities, and the overall well-being of American households. The BEA’s commitment to updating and refining its statistical methodologies ensures that these vital economic insights remain accurate and relevant in an ever-evolving economic environment.