
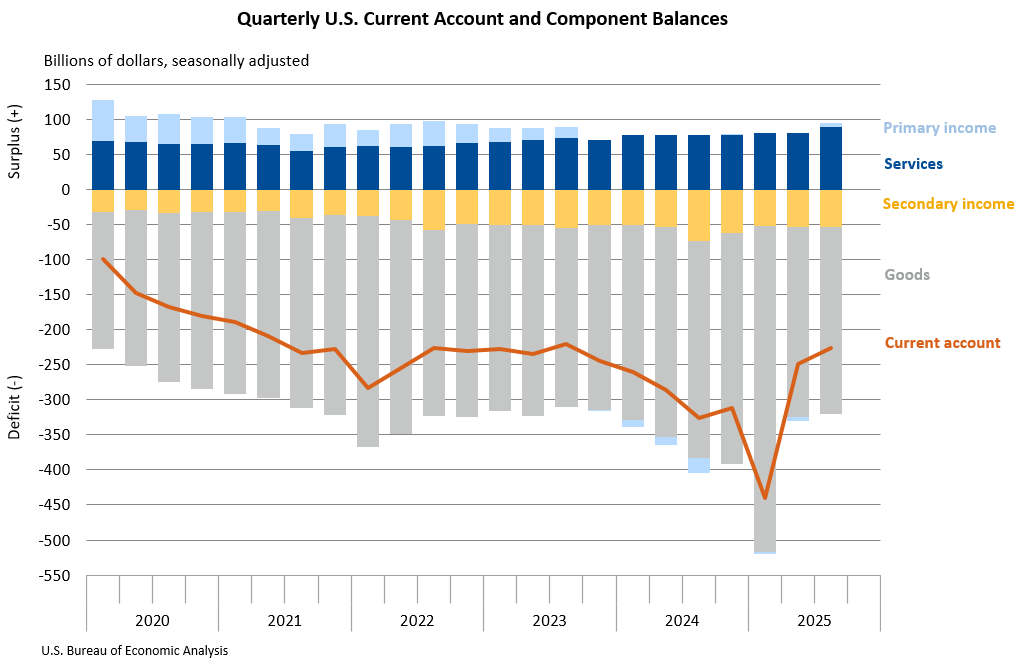
The United States’ current-account deficit experienced a significant contraction in the third quarter of 2025, shrinking by $22.8 billion, or 9.2 percent, to $226.4 billion. This narrowing, as reported by the U.S. Bureau of Economic Analysis (BEA), signals a positive shift in the nation’s overall balance of international economic transactions. The deficit, which encompasses the combined balances of trade in goods and services, as well as income flows between U.S. residents and those in other countries, was previously reported at $249.2 billion for the second quarter of 2025. This marks a notable improvement, reducing the deficit’s share of current-dollar gross domestic product from 3.3 percent in the second quarter to 2.9 percent in the third.
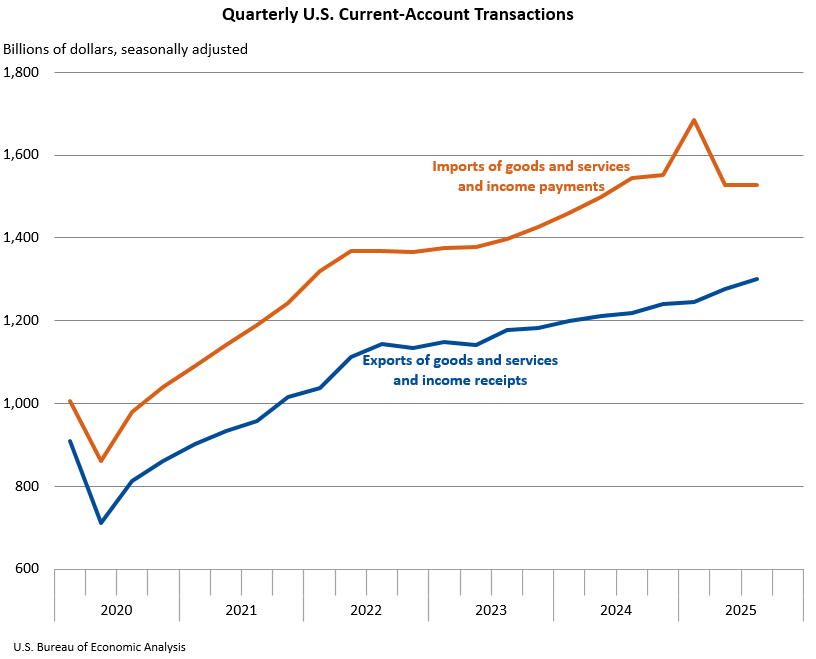
This positive development was primarily propelled by a turnaround in the balance on primary income, which shifted from a deficit in the preceding quarter to a surplus. Additionally, a strengthened surplus in services trade and a reduced deficit in goods trade contributed to the overall improvement. Total exports of goods and services, along with income received from foreign residents, saw an increase of $24.1 billion, reaching $1.30 trillion. Concurrently, imports of goods and services and income paid to foreign residents rose by a more modest $1.3 billion, totaling $1.53 trillion.
Deep Dive into Current-Account Components
Trade in Goods: A Mixed Picture
The goods balance, a cornerstone of the current account, showed a mixed performance. Exports of goods experienced a slight decline of $1.9 billion, settling at $548.0 billion. This decrease was attributed to a reduction in nonmonetary gold exports, though this was partially offset by increased shipments of capital goods and consumer goods. Conversely, imports of goods also decreased by $5.0 billion to $815.4 billion. This reduction was largely driven by lower imports of consumer goods, a trend that was counterbalanced by an increase in nonmonetary gold imports. The BEA’s clarification on nonmonetary gold is crucial for understanding these movements, as it represents a distinct category of gold transactions that can influence trade balances.
Services Trade Surges
The services sector proved to be a significant driver of the current account’s improvement. Exports of services demonstrated robust growth, rising by $11.7 billion to $314.2 billion. This expansion was mirrored in imports of services, which increased by $3.1 billion to $225.0 billion. The BEA highlighted "other business services," particularly professional and management consulting services, as the primary engine behind these increases in both export and import categories. This suggests a dynamic and growing demand for U.S. expertise and services globally, as well as increased engagement of U.S. businesses with foreign service providers.
Primary Income Rebounds to Surplus
A pivotal element in the current account’s narrowing deficit was the significant turnaround in the primary income balance. Receipts of primary income, which represent earnings on investments and compensation of employees, climbed by $16.3 billion to $395.2 billion. This surge was broadly based, with increases across all major categories, led by direct investment income. Direct investment income reflects profits earned by foreign affiliates of U.S. companies and by U.S. affiliates of foreign companies.

On the payments side, primary income outflows increased by $5.3 billion to $390.0 billion. This rise was primarily attributed to an increase in "other investment income," specifically interest paid on loans and deposits. The shift from a deficit to a surplus in primary income is a significant indicator of strengthening U.S. earnings from its international investments relative to its payments. This rebound could be influenced by a variety of factors, including improved global economic conditions that boost returns on U.S. assets abroad, or shifts in interest rate differentials.
Secondary Income Experiences Modest Decline
Secondary income, which comprises current transfers such as worker remittances and official aid, saw a slight decrease. Receipts of secondary income declined by $2.0 billion to $44.4 billion, a reduction attributed to a decrease in private transfers. Similarly, payments of secondary income fell by $2.1 billion to $97.9 billion, primarily due to a reduction in general government transfers. While these movements are relatively smaller in scale compared to trade in goods and services or primary income, they contribute to the overall current account balance.
Capital and Financial Accounts: A Broader Economic Picture
Beyond the current account, the BEA’s report also provided insights into the capital and financial accounts, offering a more comprehensive view of the U.S. economic relationship with the rest of the world.
Capital Account Transactions
The capital account, which records capital transfers and the acquisition and disposal of nonproduced nonfinancial assets, showed modest activity. Capital-transfer receipts increased by $164 million to $181 million in the third quarter. Conversely, capital-transfer payments decreased by $659 million to $1.3 billion. These figures represent relatively small components of the overall international transactions.
Financial Account: Net Borrowing from Abroad
The financial account reflects transactions in financial assets and liabilities. In the third quarter of 2025, net financial-account transactions registered a deficit of $409.9 billion. This indicates that, on net, the U.S. borrowed from foreign residents during the quarter. This borrowing is a crucial counterbalance to the current account deficit; while the U.S. is consuming more goods and services than it produces and earning less income from abroad than it pays out (reflected in the current account deficit), it finances this through net inflows of foreign capital.
U.S. Financial Assets and Liabilities
Transactions in the third quarter led to an increase in U.S. residents’ foreign financial assets by $403.4 billion. This expansion was distributed across various asset classes, with "other investment assets" seeing the largest rise ($224.4 billion), followed by direct investment assets ($91.9 billion) and portfolio investment assets ($86.2 billion). Reserve assets also saw a slight increase of $0.9 billion.
On the other side of the ledger, U.S. liabilities to foreign residents increased substantially by $797.2 billion. Portfolio investment liabilities experienced the most significant growth ($486.8 billion), indicating a strong appetite from foreign investors for U.S. stocks and bonds. "Other investment liabilities" also rose by $195.9 billion, and direct investment liabilities by $114.6 billion. The substantial increase in liabilities underscores the continued reliance on foreign capital to finance domestic investment and consumption.
Financial Derivatives
Net transactions in financial derivatives resulted in a deficit of $16.1 billion, further contributing to the overall net borrowing from foreign residents. These transactions are complex and can reflect hedging activities, speculative investments, and other financial strategies.
Revisions and Future Outlook
The BEA also provided updated figures for the second quarter of 2025. The preliminary estimate for the current-account balance was revised from -$251.3 billion to -$249.2 billion, indicating a slight improvement in the initial assessment. Revisions were also made to the components of the second-quarter balance. The goods balance was slightly revised to -$270.4 billion, the services balance to $80.6 billion, the primary income balance to -$5.8 billion, and the secondary income balance to -$53.6 billion. Net financial-account transactions for the second quarter were revised from -$406.9 billion to -$396.7 billion.
Looking ahead, the BEA announced upcoming changes to its publication schedule and format. Beginning in March 2026, the quarterly U.S. international transactions and international investment position accounts will be consolidated into a single news release. This move aims to provide a more holistic view of the U.S. engagement with the global economy and accelerate the availability of international investment position statistics. Furthermore, the BEA will transition from including detailed tables within the news releases to providing dynamic links to its Interactive Data Application. This approach is intended to reduce redundancy, enhance efficiency, and direct users to more comprehensive and flexible data resources. The next release, covering the fourth quarter and full year 2025, is scheduled for March 25, 2026. Subsequent releases in 2026 will follow on June 24, September 24, and December 18.
Implications and Analysis
The narrowing of the U.S. current-account deficit in the third quarter of 2025 is a positive signal for the nation’s economic health, suggesting a more balanced international economic posture. The shift in the primary income balance from a deficit to a surplus is particularly noteworthy, potentially reflecting increased profitability of U.S. overseas investments or a more favorable global economic environment for U.S. assets. The continued strength in services exports, driven by professional and management consulting services, underscores the growing importance of the U.S. service sector in the global economy.
However, the persistent deficit in the financial account, indicating net borrowing from abroad, highlights the ongoing need for foreign capital to finance the U.S. economy. The substantial increase in liabilities, particularly in portfolio investment, suggests that foreign investors remain keen on U.S. financial markets, which can support asset prices and provide a source of funding. Nonetheless, a continued reliance on foreign borrowing can also create vulnerabilities, especially in periods of global financial stress or shifts in investor sentiment.
The BEA’s forthcoming changes to its reporting structure signal a commitment to modernizing data dissemination and making international economic data more accessible and user-friendly. The consolidation of releases and the move towards interactive data applications are steps that could enhance the utility and impact of these important economic statistics for policymakers, businesses, and researchers alike. The trend in the current account deficit, combined with the dynamics of the financial account, will continue to be closely watched as indicators of the U.S. economy’s position and trajectory within the global economic landscape.