

The U.S. Bureau of Economic Analysis (BEA) has released its comprehensive third-quarter 2025 (July, August, and September) statistics on gross domestic product (GDP) and personal income for all 50 states and the District of Columbia, painting a picture of widespread economic expansion. The data reveals a robust national economy that saw real GDP increase in every state, underscoring a period of sustained growth that touched nearly every corner of the nation. This broad-based uptick is further supported by a consistent rise in personal income across all jurisdictions, indicating a healthy economic environment for American households.
National Economic Performance in Focus
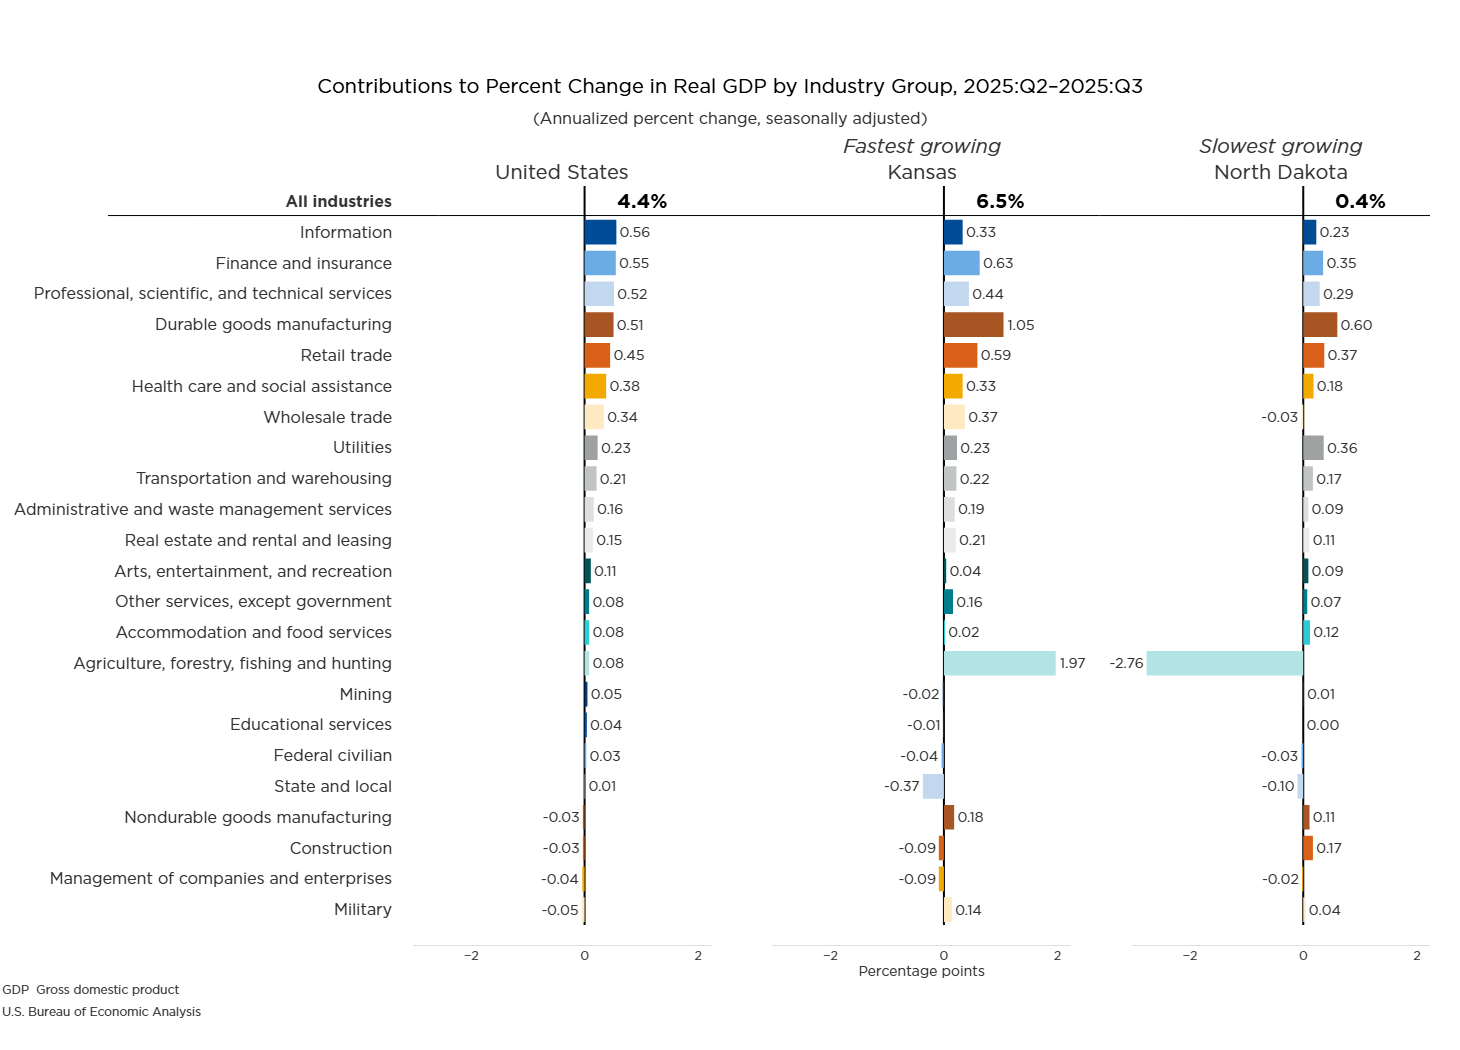
Nationally, real GDP experienced an annual growth rate of 4.4 percent in the third quarter of 2025. This figure represents a significant acceleration from previous periods, reflecting a dynamic and expanding economy. The state-level data highlights the varied pace of this growth, with Kansas leading the nation with a remarkable 6.5 percent annual increase in real GDP. In contrast, North Dakota registered the slowest growth at 0.4 percent, though still positive, indicating that even states with more modest gains benefited from the overall economic momentum.
The engine behind this national GDP surge was a diversified performance across various industry sectors. The BEA’s analysis identified information, finance and insurance, and professional, scientific, and technical services as the primary contributors to the national GDP increase. These sectors, which often represent higher-value economic activities and innovation, collectively bolstered the nation’s economic output. Notably, these same industries were also the leading drivers of real GDP growth in nearly half of all states, demonstrating their widespread impact. Furthermore, durable-goods manufacturing played a significant role in boosting real GDP in several states, suggesting a resurgent manufacturing sector contributing to regional economic vitality.
Beyond real GDP, which accounts for inflation, current-dollar GDP also showed impressive growth, increasing at an annual rate of 8.3 percent nationally. This metric, unadjusted for inflation, reflects the total value of goods and services produced. Kansas again emerged as a top performer in this category, with an annual growth rate of 10.5 percent, while North Dakota recorded the lowest growth at 2.6 percent. The disparity between real and current-dollar GDP growth rates can often be attributed to varying levels of inflation across states, though the consistent positive trend in both measures signals a healthy economic climate.

Personal Income Reflects Household Prosperity
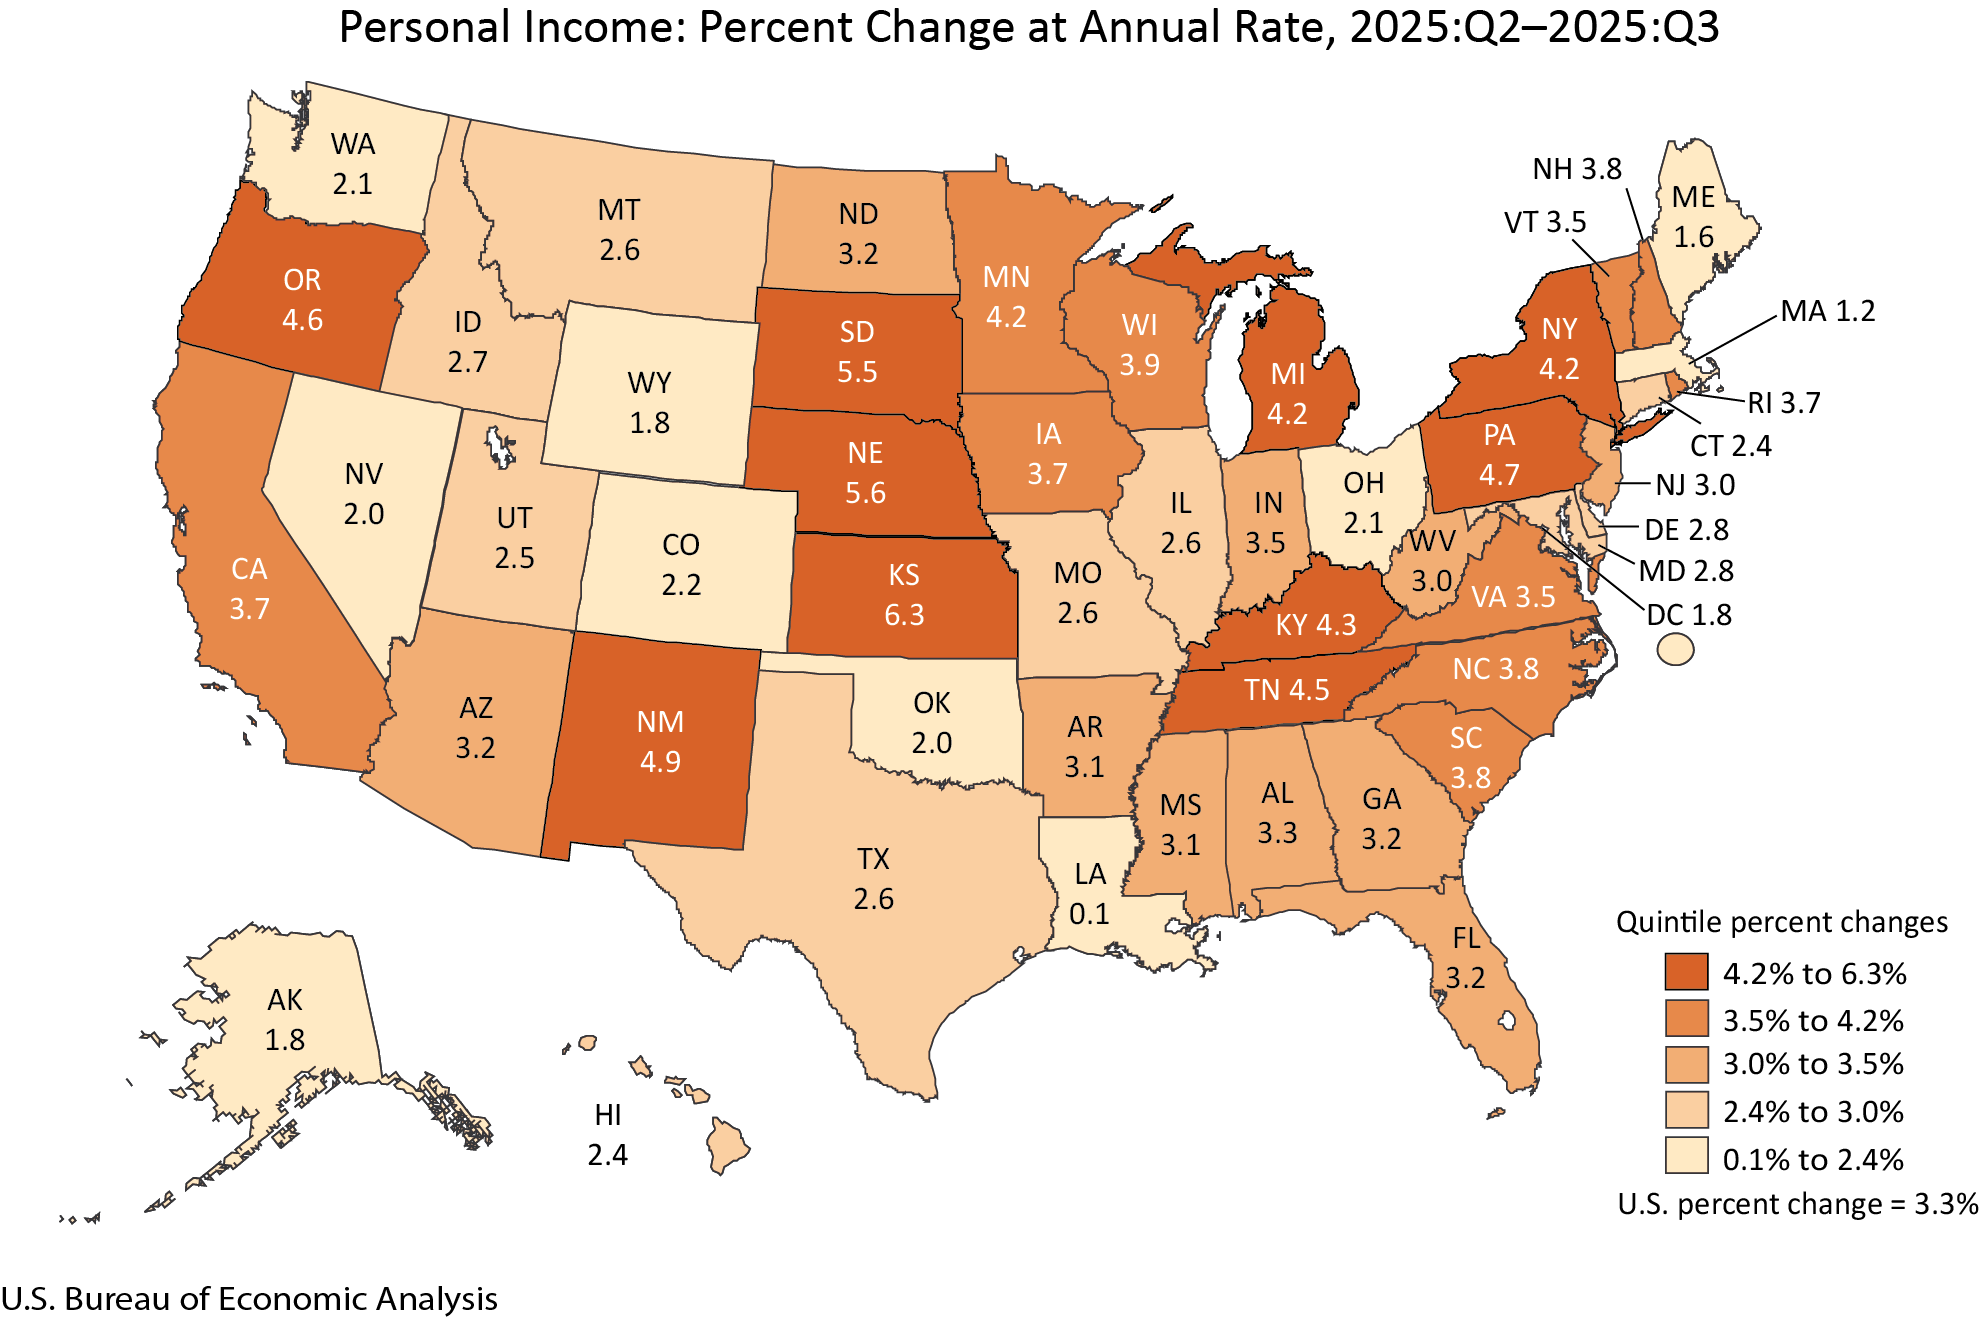
Complementing the strong GDP figures, personal income also saw widespread gains across all 50 states and the District of Columbia during the third quarter of 2025. Current-dollar personal income increased at an annual rate of 3.3 percent nationwide. This rise in income is a critical indicator of household economic well-being and consumer spending potential. Kansas again distinguished itself with the highest personal income growth rate at 6.3 percent, while Louisiana experienced the slowest growth at a modest 0.1 percent.
The BEA’s detailed breakdown of personal income components reveals that all three major categories—earnings, transfer receipts, and property income (which includes dividends, interest, and rent)—contributed positively to the national increase. Earnings, the largest component of personal income and a direct reflection of labor market strength, grew in every state and the District of Columbia. This suggests a robust job market and increasing wages across the country, providing a solid foundation for household financial stability and consumer confidence. The consistent growth in transfer receipts and property income further bolsters household financial resources, contributing to overall economic activity.
Contextualizing the Data: A Look Back and Ahead
The release of the third-quarter 2025 GDP and personal income data by state arrives at a crucial juncture in the nation’s economic cycle. Following a period of post-pandemic recovery and subsequent inflationary pressures, the consistent and broad-based growth observed in this quarter suggests a maturation of the economic expansion. The BEA’s methodology, which relies on a vast array of source data including surveys, administrative records, and economic indicators, aims to provide the most accurate snapshot of economic activity at the state and national levels.
The BEA’s commitment to providing timely and accurate economic statistics is further exemplified by the simultaneous release of revised quarterly estimates for personal income for the first and second quarters of 2025. These revisions incorporate newly available and more detailed source data, ensuring that the national and state estimates remain consistent and reflective of the latest economic realities. This iterative process of data collection and revision is fundamental to understanding the trajectory of the U.S. economy.
Evolution of BEA Reporting
In a significant move to enhance data accessibility and provide a more holistic view of economic performance, the BEA announced a forthcoming change in its reporting structure. Beginning April 9, 2026, national and state-level economic statistics, including GDP, GDP by industry, corporate profits, and state GDP and personal income, will be released concurrently. This consolidated release aims to offer a more integrated and comprehensive understanding of the U.S. economy, eliminating the need for users to consult separate reports on different days. This initiative is part of a broader effort by the BEA to streamline its publications and improve user experience.
Furthermore, the BEA is transitioning its data presentation, moving away from embedding tables directly within news releases. Instead, data users will be directed to the BEA’s Interactive Data Application, a robust platform that offers customizable tables, full time-series data, and various download formats (PDF, Excel, CSV). This digital-first approach is designed to increase efficiency, reduce duplication, and empower data users with more flexible and detailed analytical tools. The recent release already reflects this shift, with direct links to the Interactive Data Application replacing traditional tables in the body of the news release.
Broader Implications and Future Outlook
The robust GDP growth across all states in the third quarter of 2025, coupled with rising personal incomes, suggests a period of economic resilience and expansion. The leading contributions from information, finance, and professional services indicate a continued shift towards a knowledge-based economy, while the impact of durable-goods manufacturing points to a potential resurgence in foundational industries.
For policymakers, these figures provide a strong signal of economic health, potentially influencing decisions on fiscal and monetary policy. For businesses, the broad-based growth indicates a favorable environment for investment, expansion, and hiring. Consumers can likely anticipate continued stability in employment and income, supporting ongoing spending and economic activity.
However, it is important to note that while growth is widespread, the varying rates across states underscore the diverse economic landscapes within the United States. Factors such as industry concentration, labor market dynamics, and regional economic policies continue to shape individual state performances. The BEA’s detailed data allows for a granular understanding of these differences, enabling more targeted economic analysis and strategic planning.
The next major release from the BEA, scheduled for April 9, 2026, will cover the fourth-quarter 2025 and preliminary annual 2025 GDP and personal income statistics. This release will mark the transition to the new combined national and state reporting format, offering an even more integrated perspective on the nation’s economic trajectory. The data archived from the third quarter will then be accessible through BEA’s Data Archive, ensuring historical continuity for researchers and analysts.
The continued availability of detailed, timely, and accessible economic data from the BEA is indispensable for understanding the complexities of the U.S. economy. The latest quarterly report serves as a testament to the nation’s ongoing economic vitality, with positive indicators observed across a multitude of metrics and geographic regions.
Additional Information and Data Access
For a deeper dive into the methodologies, definitions, and statistical conventions employed by the BEA in compiling these state-level economic statistics, users are encouraged to visit the "Additional Information" section on the BEA website. This resource provides essential context for interpreting the data and understanding its applications.
The BEA’s Interactive Data Application serves as the primary portal for accessing the detailed tables associated with this release. Users can explore GDP by state and personal income by state through various interactive tools, allowing for customized data retrieval and analysis. Specific tables highlighted include:
- Table SQGDP1: Quarterly GDP by State—Percent Change at Annual Rates From Preceding Period in Real GDP
- Table SQGDP1: Quarterly GDP by State—Percent Change at Annual Rates From Preceding Period in Current-Dollar GDP
- Table SQGDP11: Industry Contributions to Percent Change in Real GDP by State
- Table SQINC1: Quarterly Personal Income by State—Percent Change at Annual Rates From Preceding Period
- Table SQINC12: Personal Income Change by Component
These resources are vital for economists, policymakers, business leaders, and the public seeking to understand the intricate workings of the U.S. economy at both the national and sub-national levels. The BEA’s commitment to data transparency and user-friendly access continues to be a cornerstone of its mission to inform economic decision-making and public understanding.