

The U.S. Bureau of Economic Analysis (BEA) has unveiled its latest comprehensive report on the nation’s outdoor recreation economy, revealing a robust sector that accounted for a significant 2.4 percent of the current-dollar Gross Domestic Product (GDP) in 2024. This translates to a substantial $696.7 billion in economic value added nationwide. The report, which meticulously details contributions across all 50 states and the District of Columbia, underscores the pervasive and vital role outdoor activities play in the American economic landscape.
A Deep Dive into the Numbers: National and State Performance
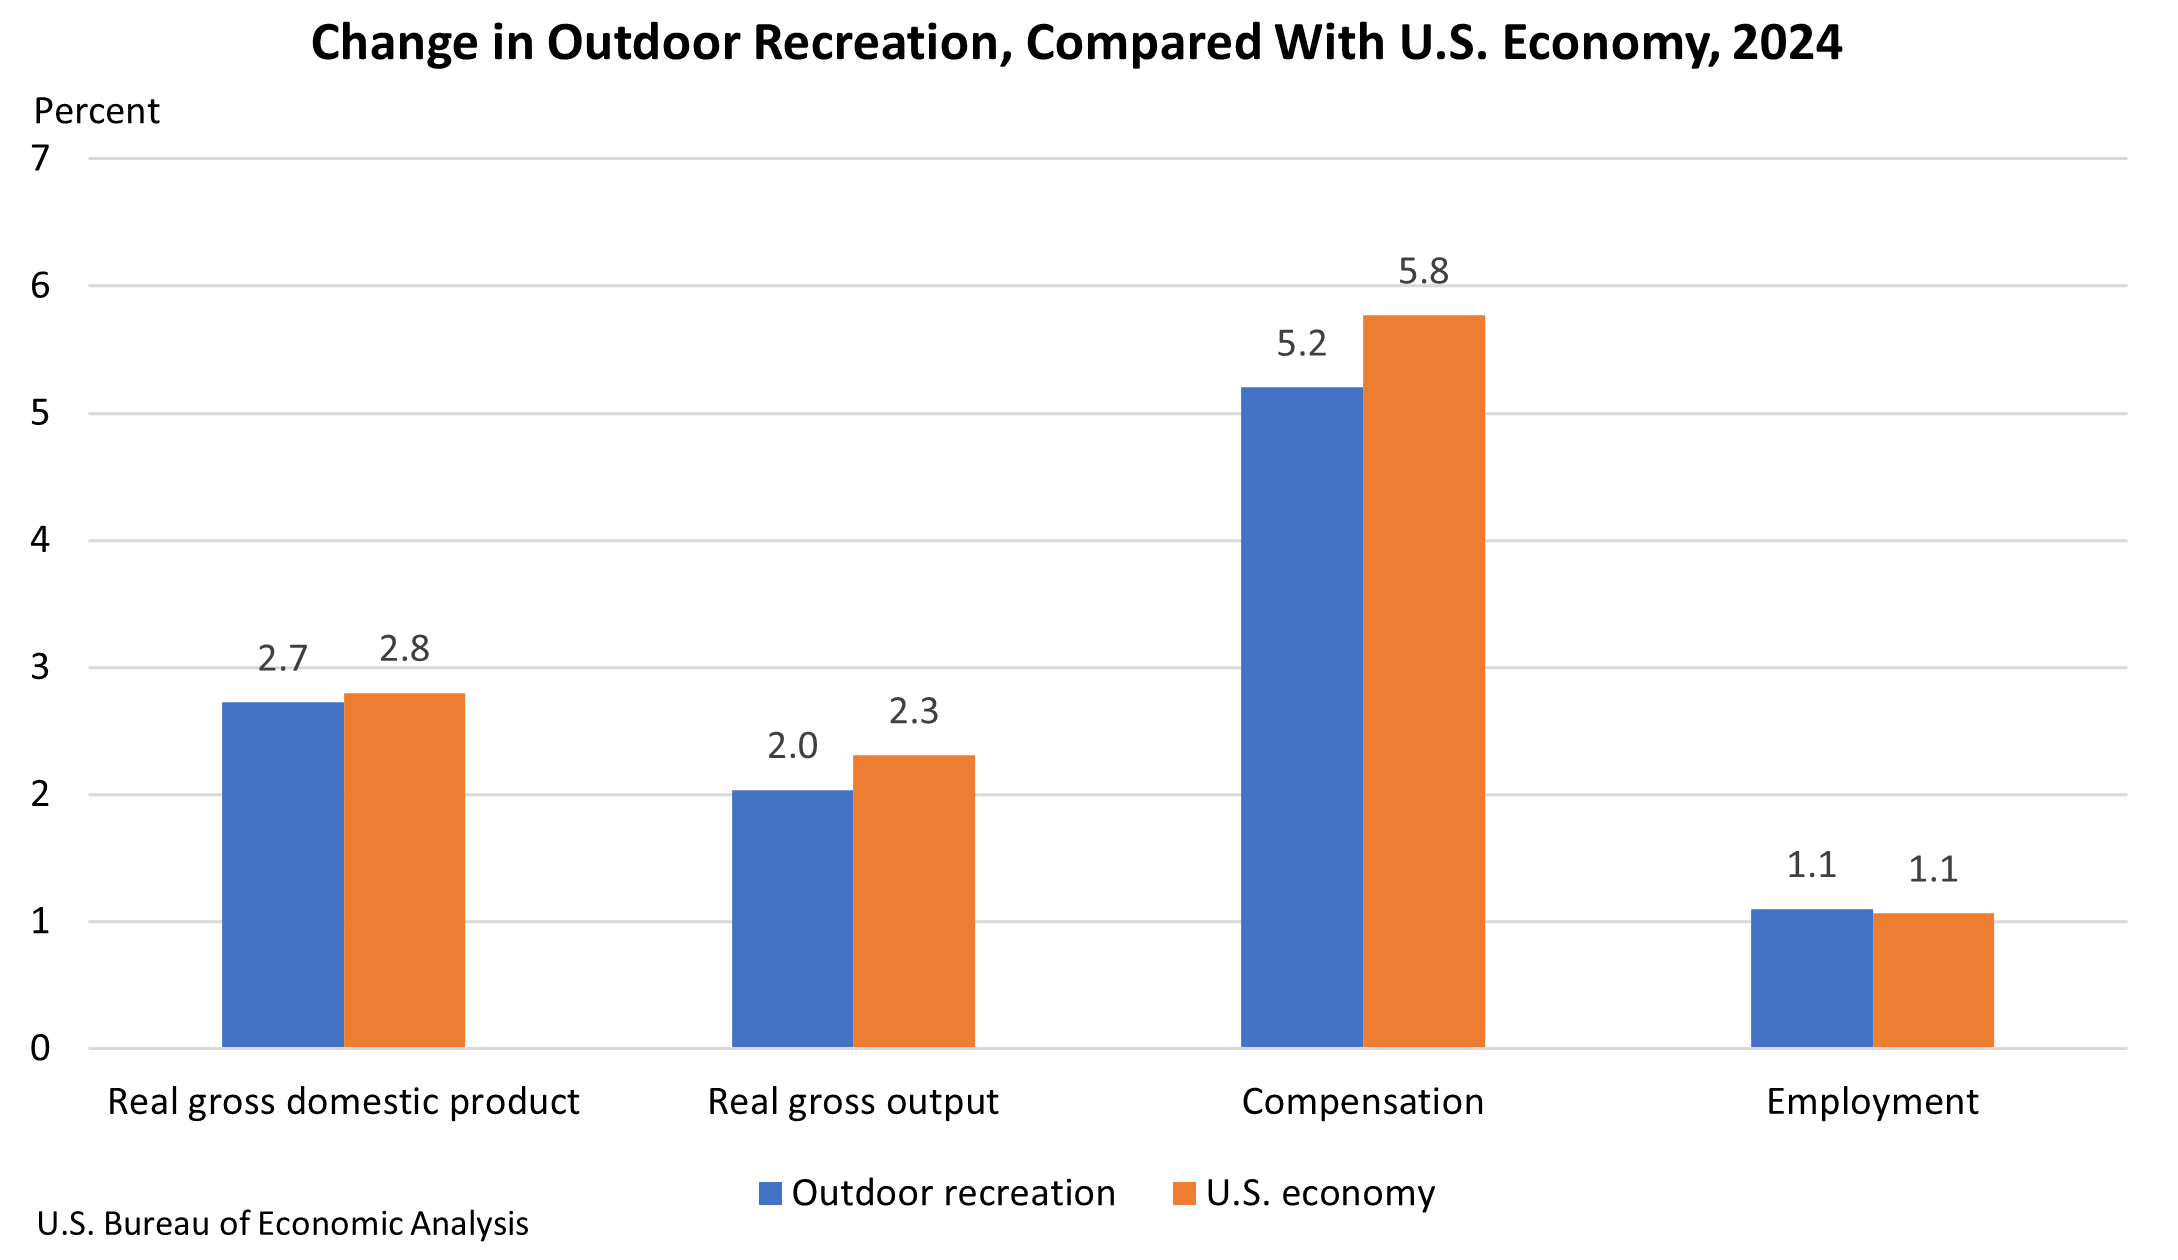
At the national level, the data indicates that the inflation-adjusted, or "real," GDP for the outdoor recreation economy saw a 2.7 percent increase in 2024. While this growth rate slightly trailed the overall U.S. economy’s 2.8 percent expansion, it signifies a continued upward trajectory, albeit at a more measured pace compared to the impressive 5.3 percent surge observed in 2023. This deceleration suggests a maturation of the sector following a period of exceptional post-pandemic recovery.
The BEA’s findings also highlight the broader economic impacts beyond direct value added. Real gross output for the outdoor recreation economy experienced a 2.0 percent increase. Crucially, compensation within the sector rose by a healthy 5.2 percent, and employment saw a 1.1 percent uptick. These figures suggest that while growth in output may be moderating, the sector is still creating jobs and generating income for its workforce.
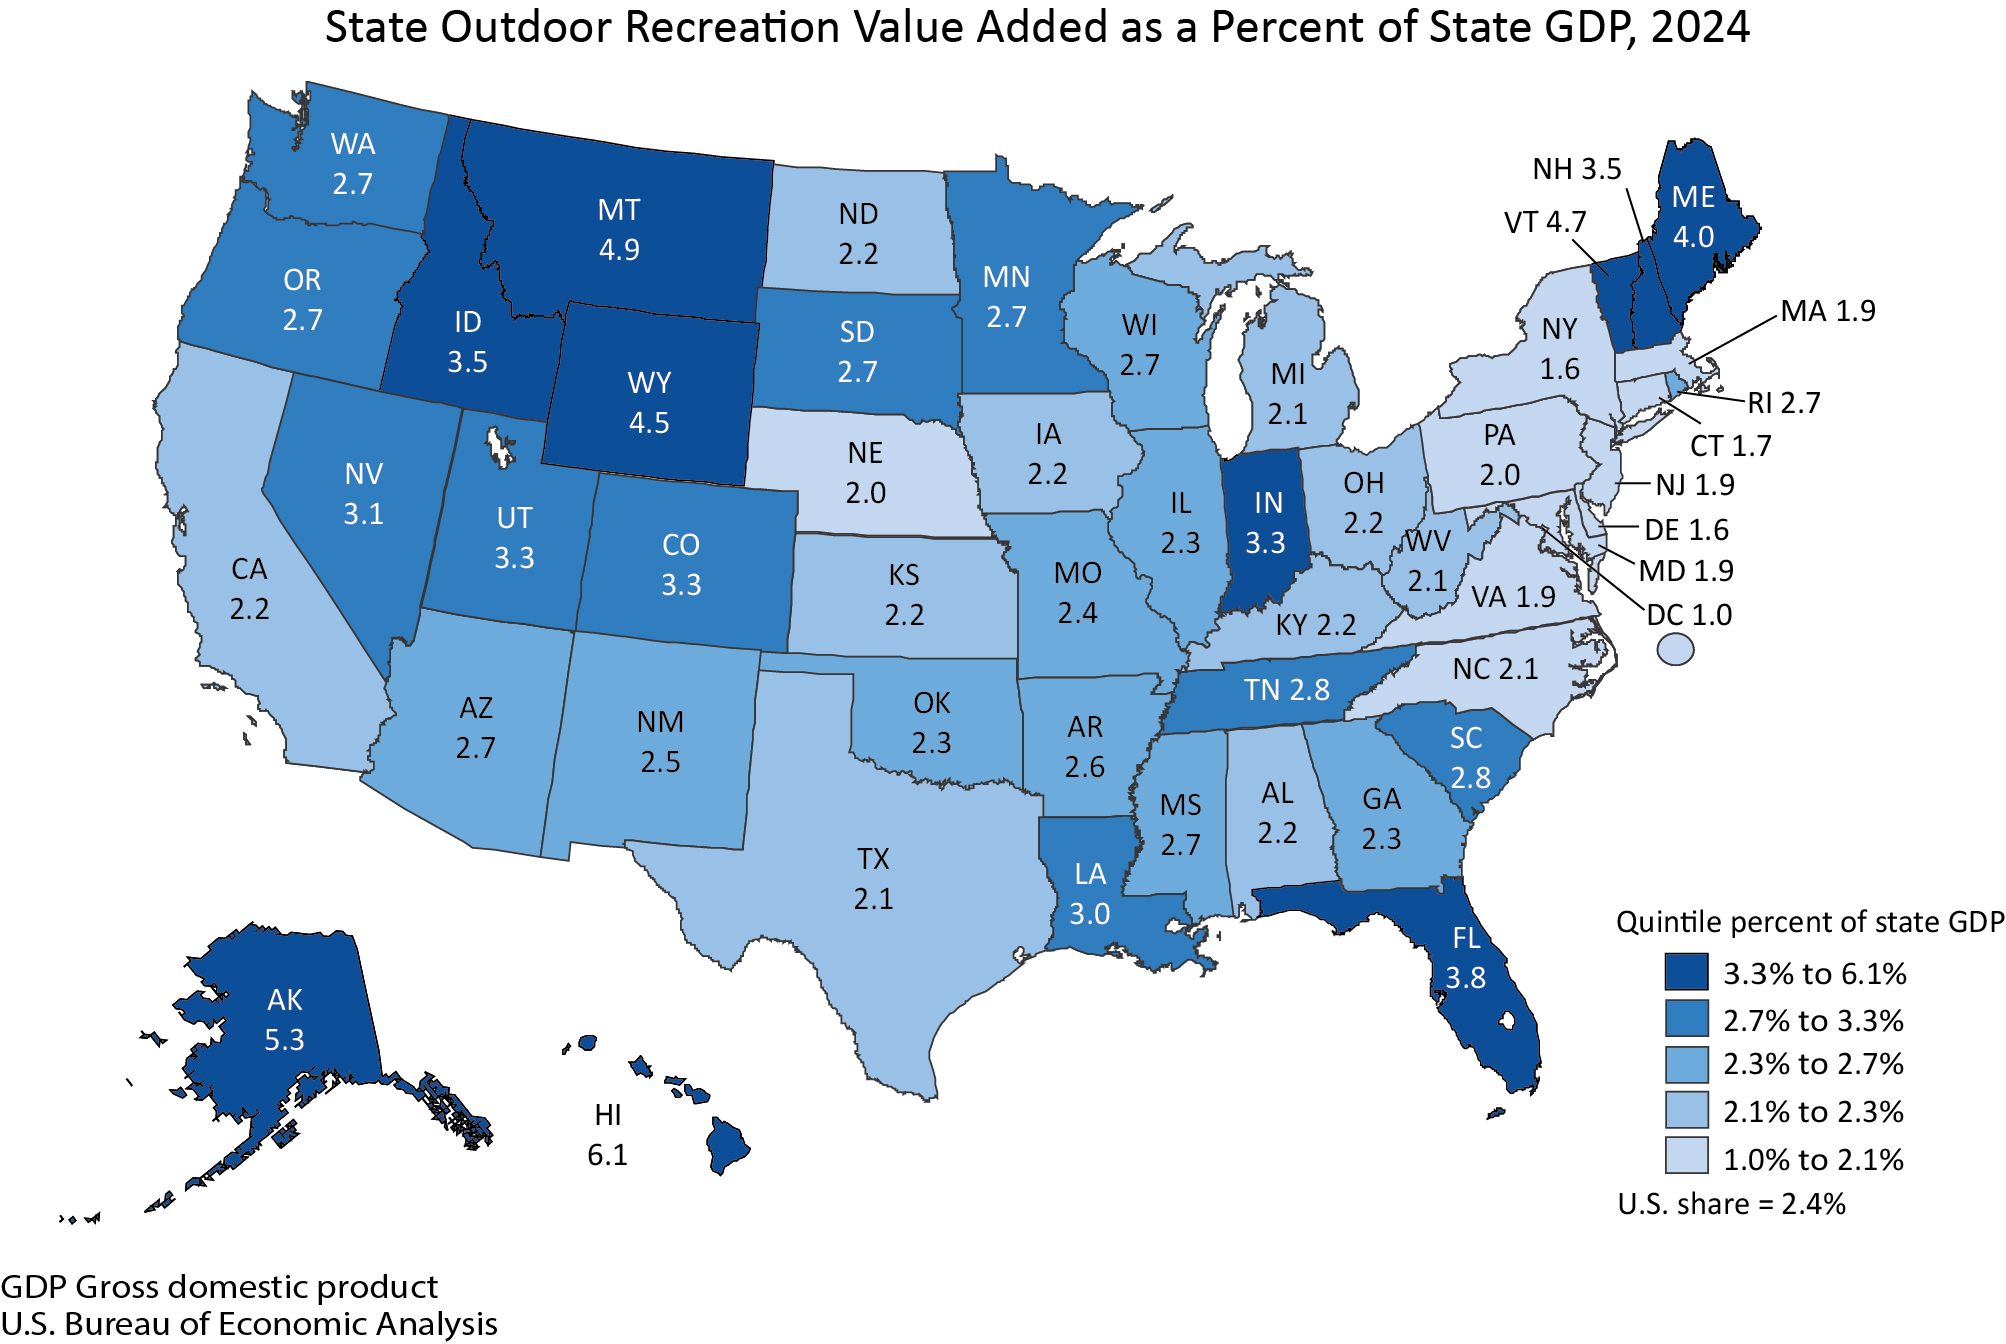
The state-by-state analysis reveals a diverse economic footprint for outdoor recreation. The value added of outdoor recreation as a share of a state’s GDP varied considerably, with Hawaii leading the pack at a remarkable 6.1 percent. This high percentage in Hawaii is likely attributable to its significant tourism industry, which heavily relies on its unique natural landscapes and outdoor activities like surfing, hiking, and snorkeling. Conversely, the District of Columbia registered the lowest share at 1.0 percent, a figure influenced by its urban environment and primary economic drivers being governmental and professional services.
Employment Trends: A Mixed Bag Across the Nation
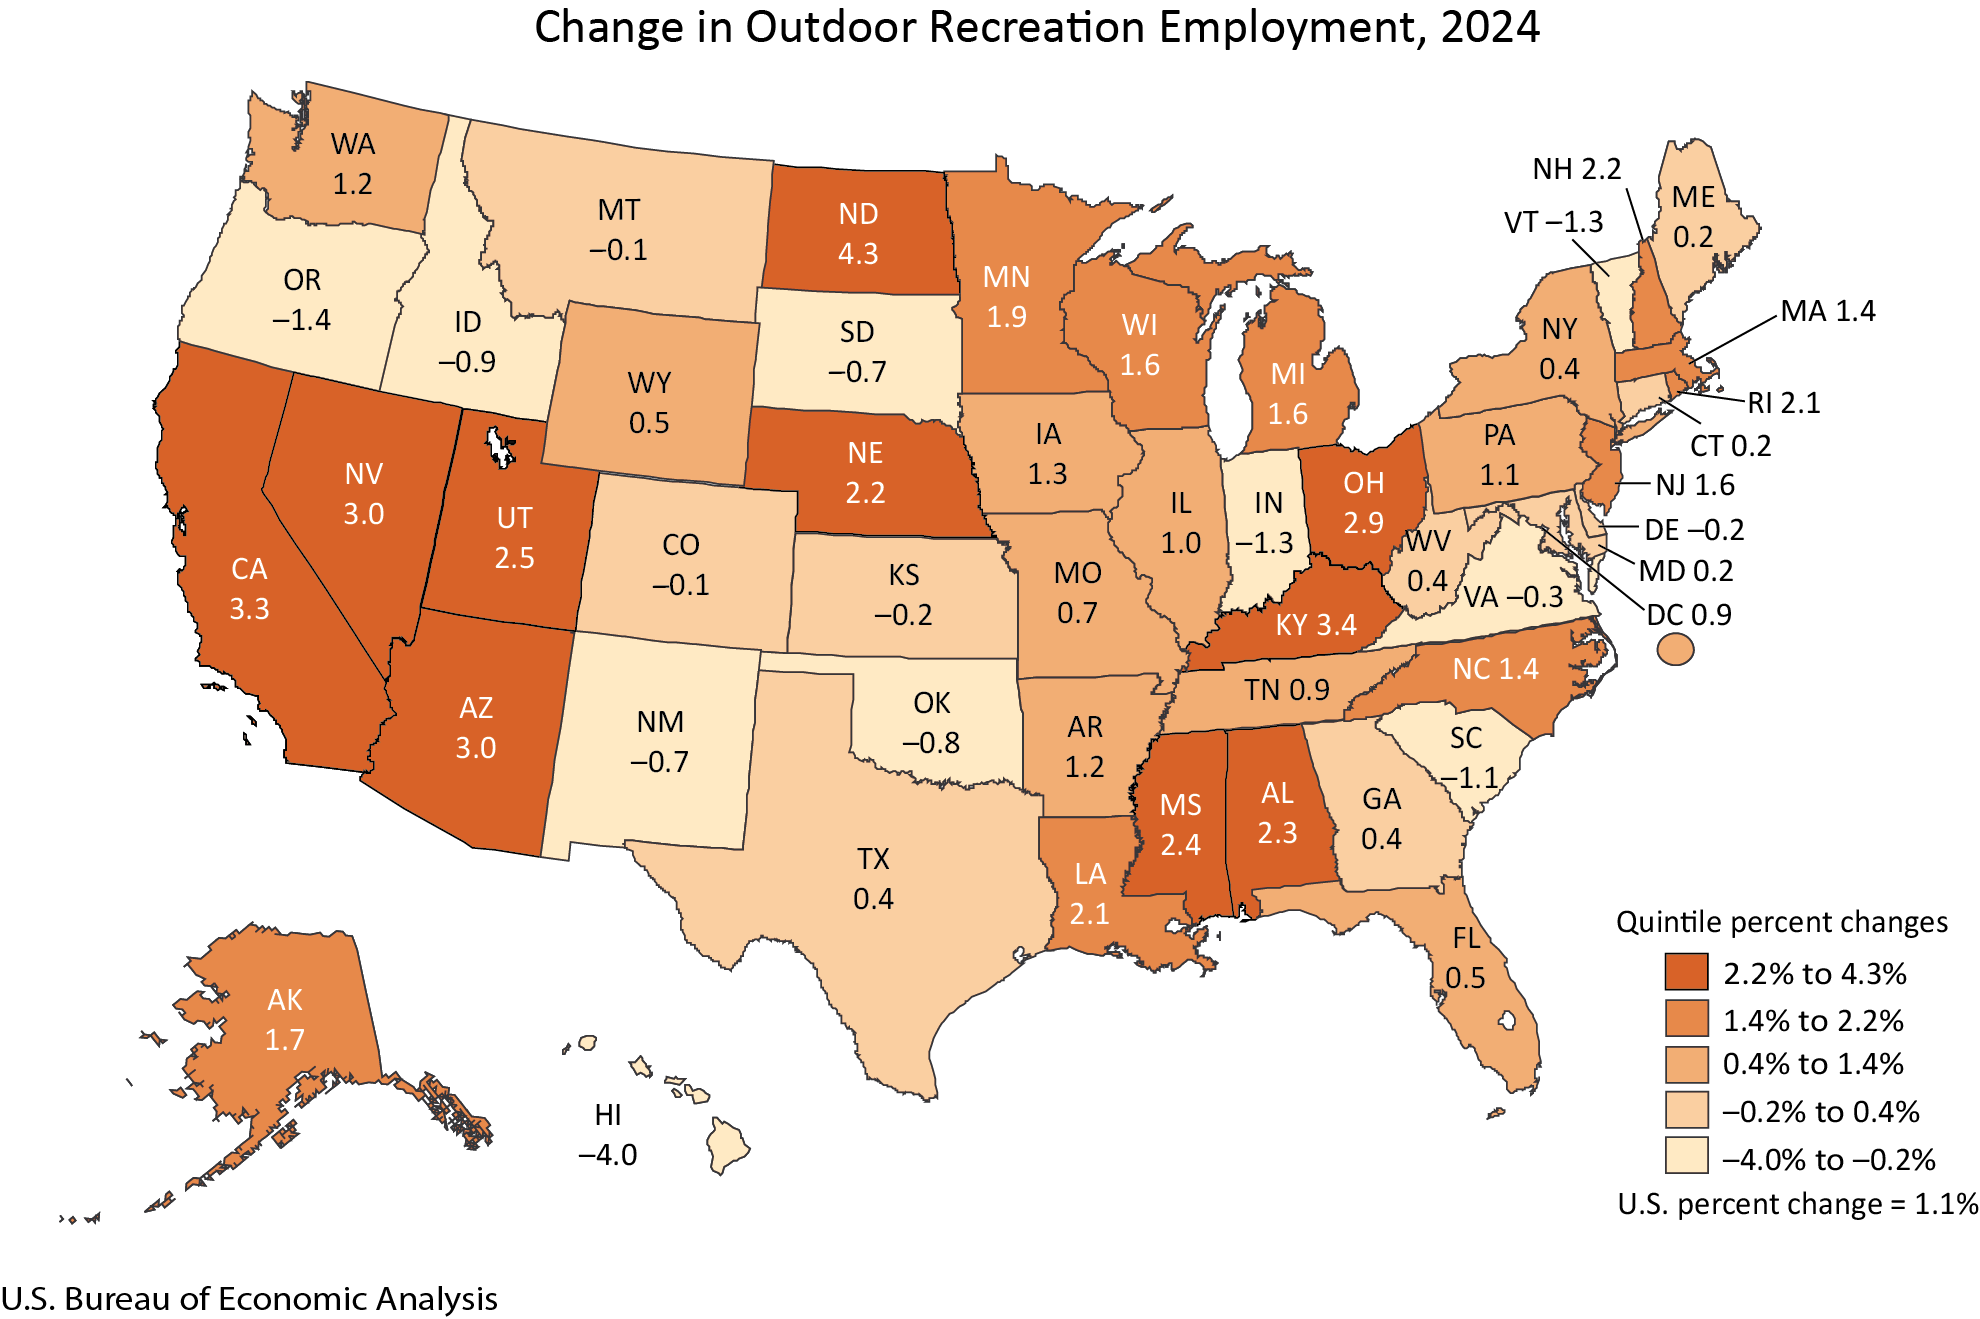
Examining employment trends provides further insight into the sector’s dynamism. In 2024, outdoor recreation employment expanded in 36 states and the District of Columbia. This widespread job growth indicates that the benefits of the outdoor recreation economy are reaching many corners of the country. The percentage change in outdoor recreation employment ranged from an impressive 4.3 percent increase in North Dakota to a notable decline of 4.0 percent in Hawaii.
The strong growth in North Dakota, despite not being a traditional outdoor recreation hotspot like some western states, could be linked to specific activities or investments within the state. Conversely, the decline in Hawaii, while seemingly counterintuitive given its high overall contribution, might reflect shifts in tourism patterns, increased automation in certain service sectors, or a rebound in other economic areas that temporarily suppressed outdoor recreation employment figures. These regional variations underscore the importance of tailored strategies to foster and sustain outdoor recreation economies at the local and state levels.
Deconstructing the Outdoor Recreation Economy: Activities and Industries
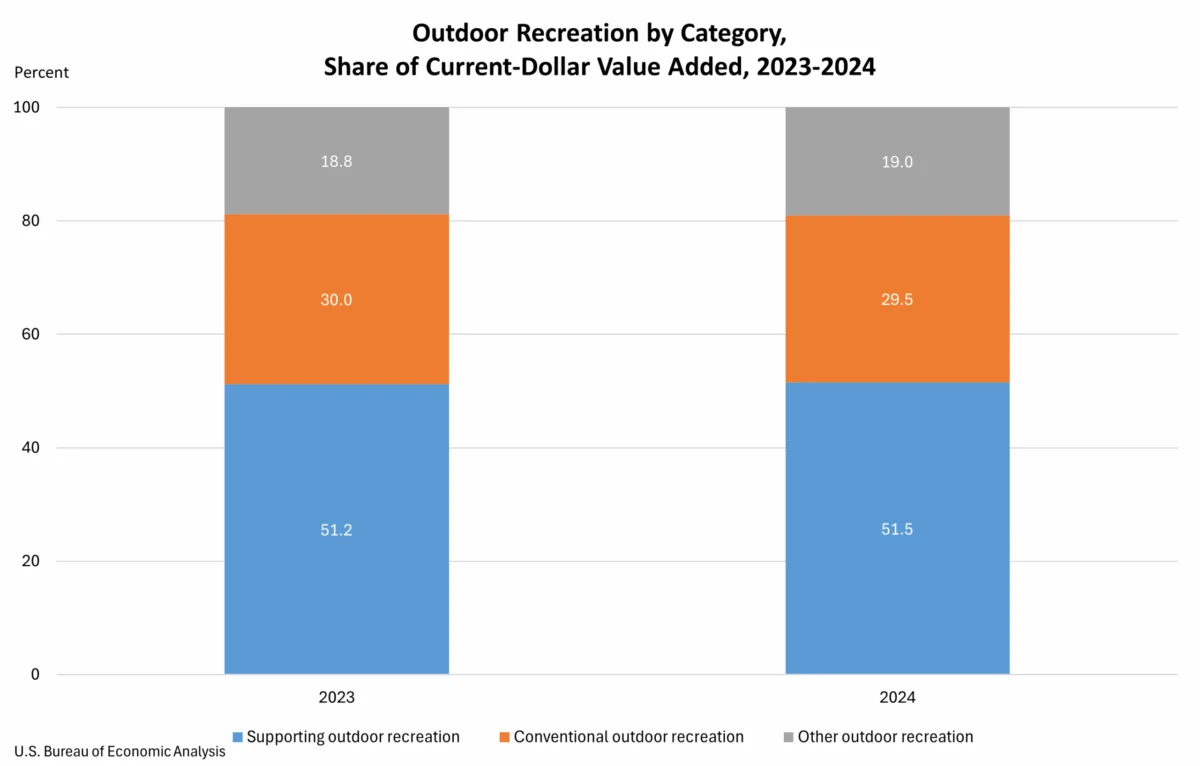
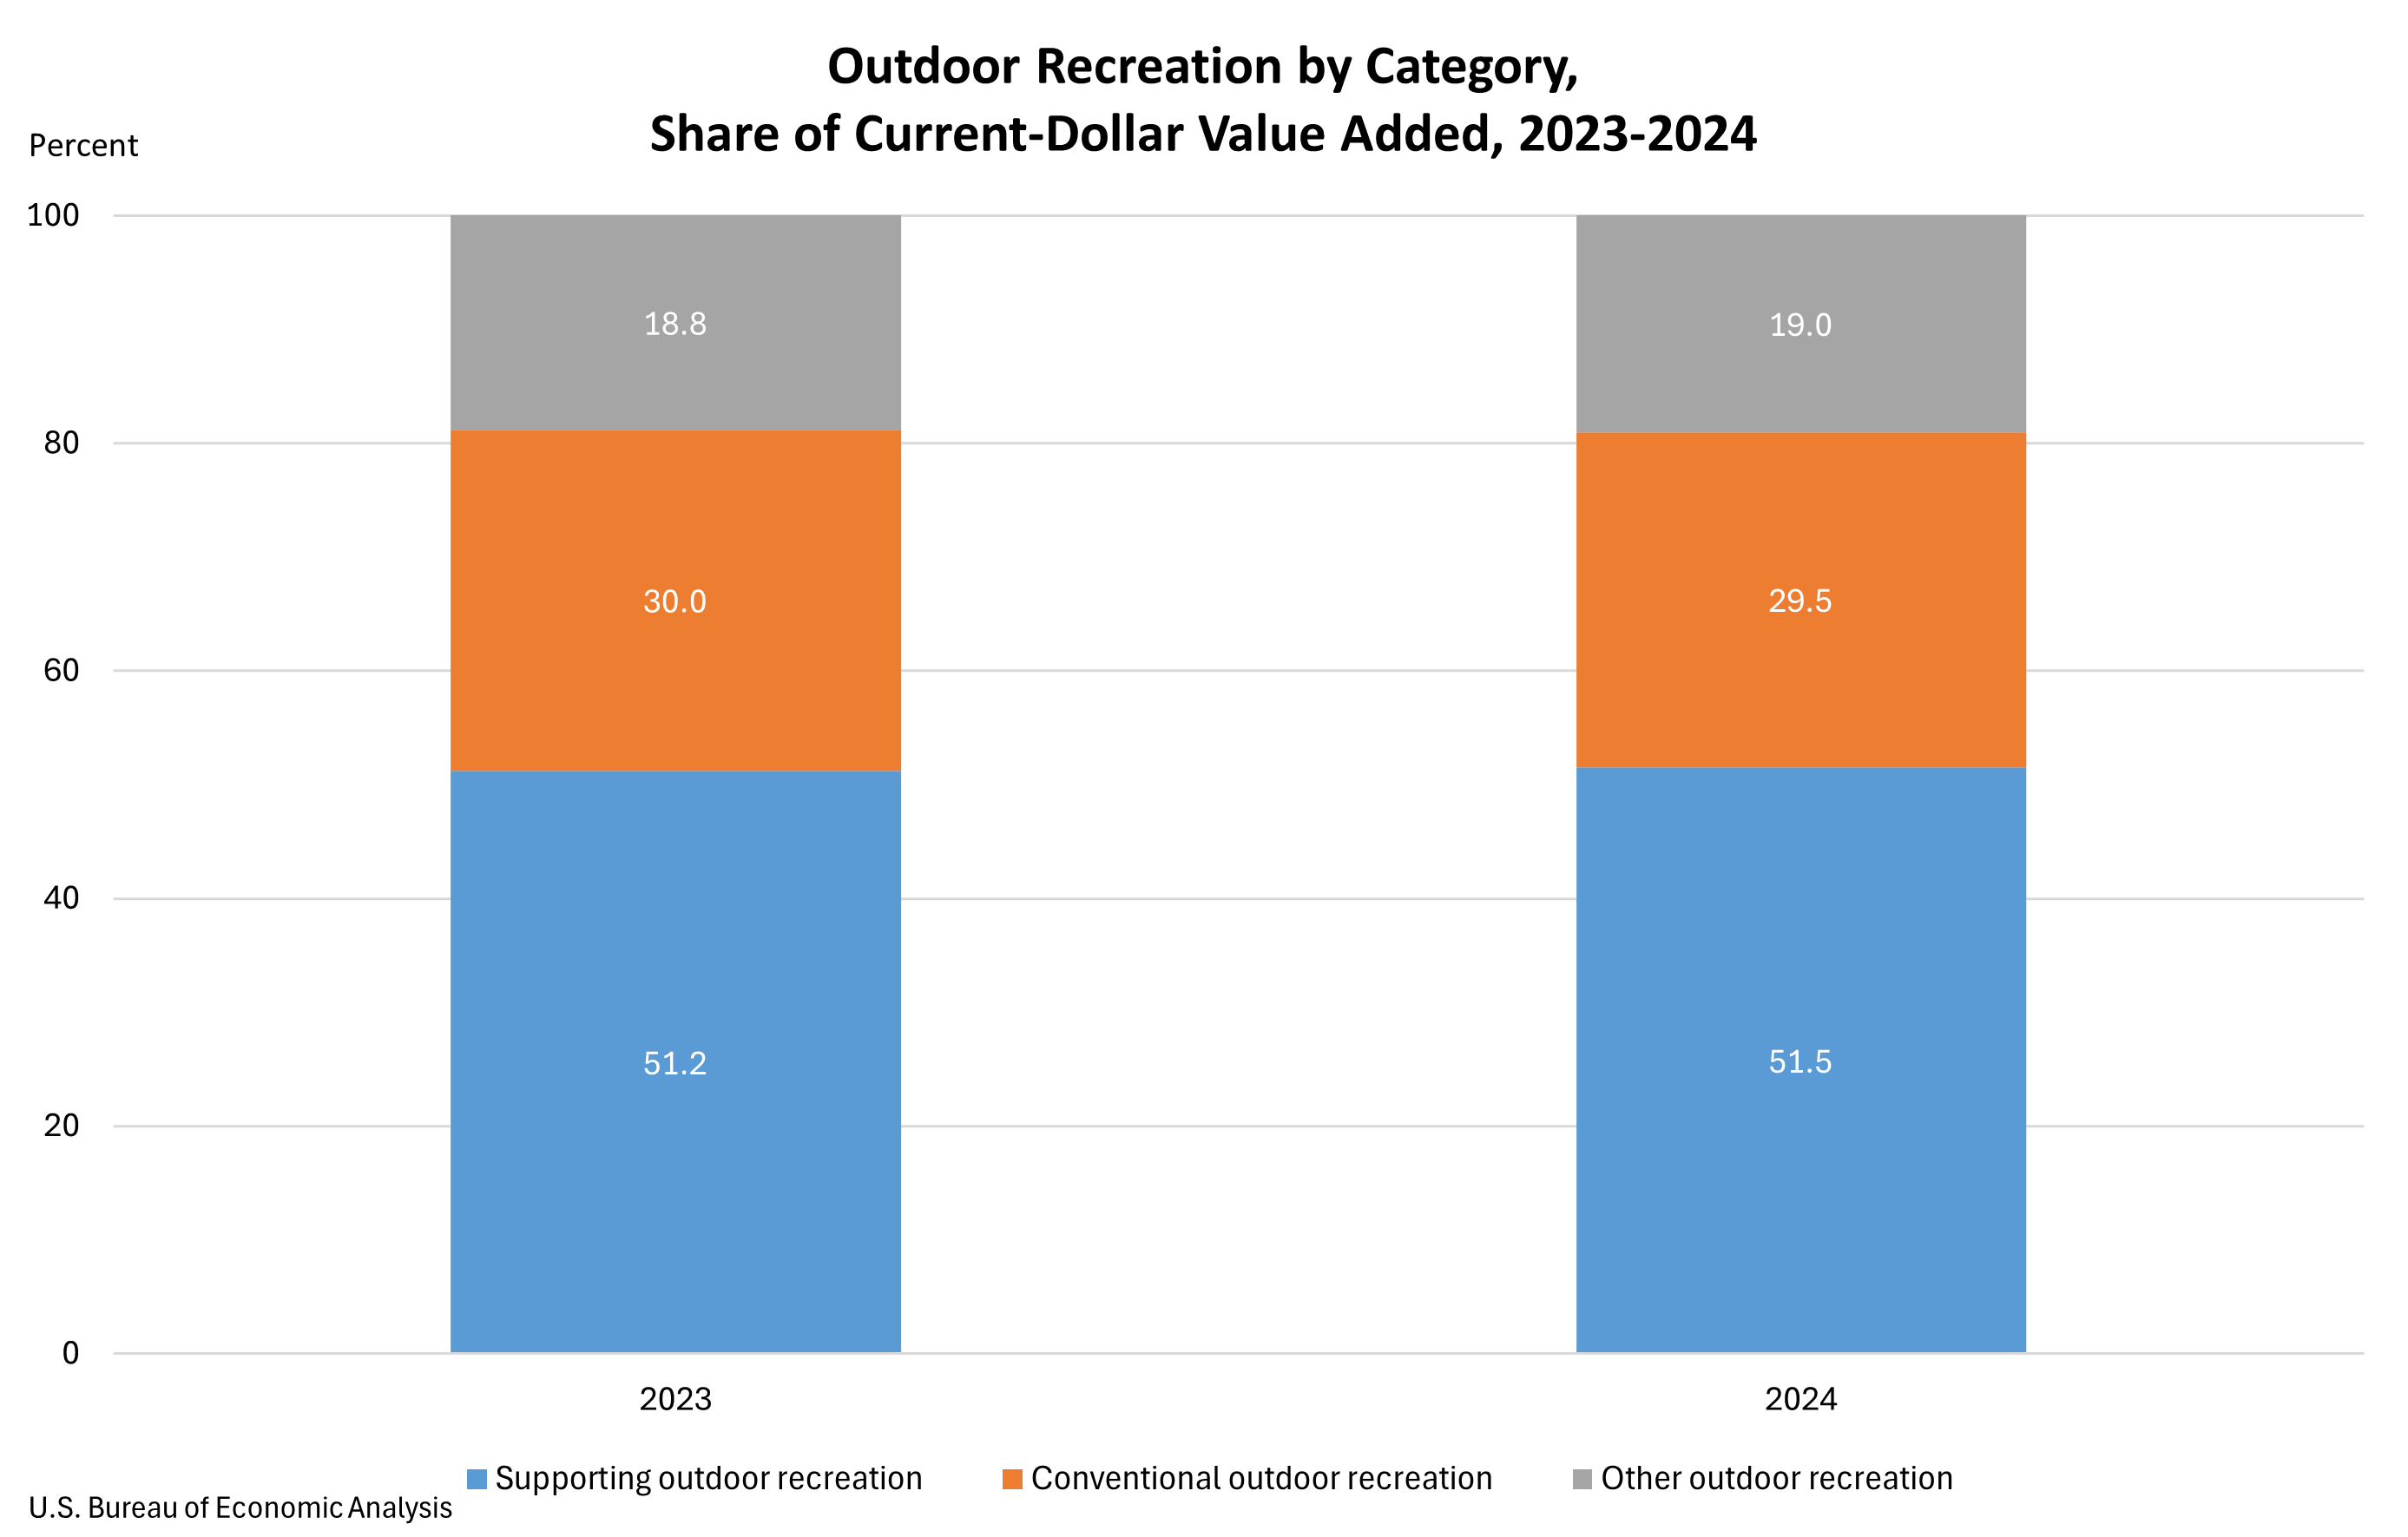
The BEA categorizes outdoor recreation activities into three broad groups: conventional activities, other activities, and supporting activities.
-
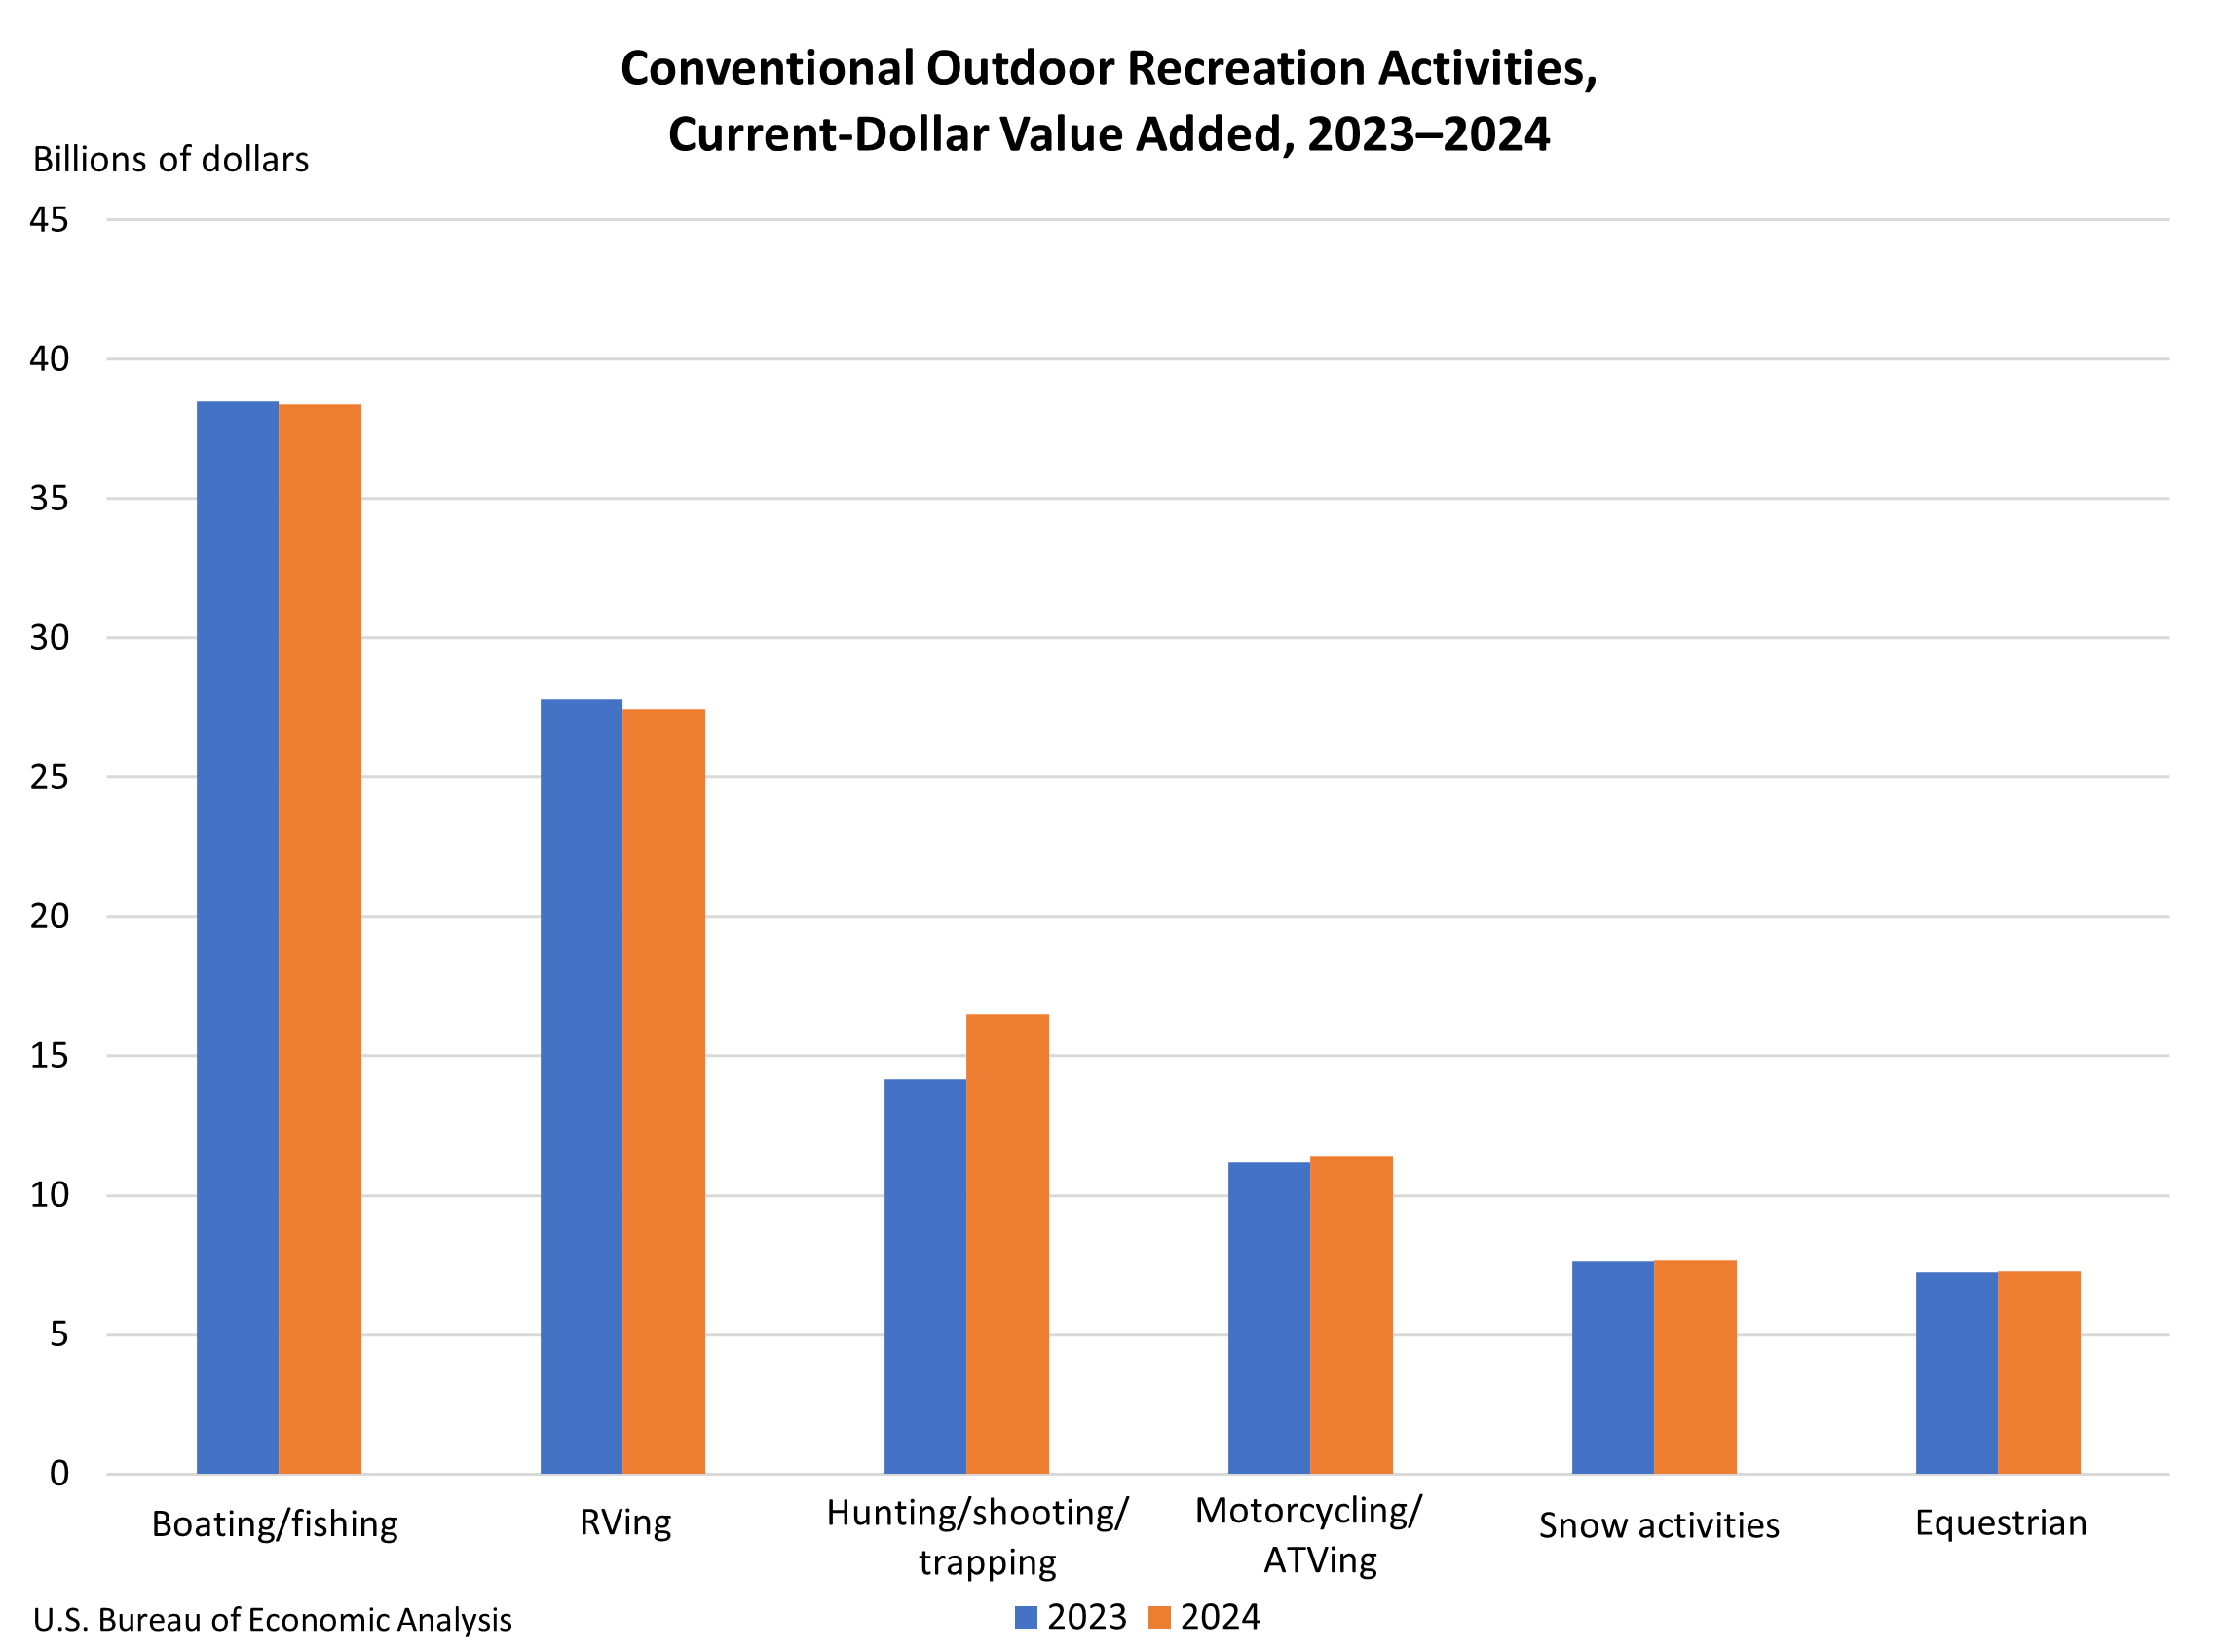
Conventional Activities: This category encompasses traditional pursuits such as bicycling, boating, hiking, hunting, fishing, and camping. In 2024, conventional outdoor recreation accounted for 29.5 percent of the U.S. outdoor recreation value added, a slight decrease from 30.0 percent in 2023. This suggests a relative shift in consumer spending towards other segments of the outdoor recreation market.
-
Other Outdoor Activities: This group includes activities like gardening, outdoor concerts, and other leisure pursuits that might not fit the "conventional" definition but are enjoyed outdoors. This segment saw a slight increase, representing 19.0 percent of value added in 2024, up from 18.8 percent in 2023. This indicates a growing interest in a broader spectrum of outdoor leisure experiences.
-
Supporting Activities: This is the largest and perhaps most complex category, encompassing industries that enable and facilitate outdoor recreation. It includes construction (e.g., building trails, campgrounds, ski resorts), travel and tourism (transportation, accommodation, food services), local trips, and government expenditures related to public lands and recreation infrastructure. Supporting activities accounted for a substantial 51.5 percent of value added in 2024, a marginal increase from 51.2 percent in 2023. The growth within this category was particularly driven by travel and tourism, fueled by increased spending on transportation, hotels, and restaurants. This highlights the interconnectedness of the outdoor recreation economy with broader consumer spending and travel trends.
Industry Contributions: The Pillars of the Outdoor Recreation Economy
The BEA’s analysis also breaks down the outdoor recreation economy by industry, revealing which sectors are most instrumental in its success.
The arts, entertainment, recreation, accommodation, and food services industry group emerged as the leading contributor to U.S. outdoor recreation value added in 2024, generating $174.4 billion, or 25.0 percent of the total. This segment is directly tied to providing experiences and amenities for outdoor enthusiasts, from theme parks and museums to restaurants and lodging near natural attractions. At the state level, this industry group was the dominant force in 23 states and the District of Columbia. California ($24.1 billion), Florida ($22.7 billion), and New York ($11.8 billion) reported the largest contributions from this sector, reflecting their status as major tourism and recreation destinations.
Following closely behind, retail trade secured the second-largest share of national outdoor recreation value added, contributing $169.1 billion, or 24.3 percent. This industry encompasses businesses that sell goods essential for outdoor activities, such as sporting goods, apparel, camping equipment, and vehicles. Retail trade proved to be the largest industry contributor in 24 states, indicating its widespread importance. California ($19.3 billion), Texas ($14.4 billion), and Florida ($13.4 billion) again appeared among the top states for retail’s contribution to the outdoor recreation economy, underscoring their large consumer bases and diverse recreational opportunities.
Manufacturing ranked as the third-largest industry group, contributing $91.3 billion, or 13.1 percent of national value added. This sector is crucial for producing a wide array of outdoor recreation equipment, from bicycles and kayaks to recreational vehicles and outdoor apparel. While manufacturing was the primary industry driver in only two states, Indiana and Louisiana, its national impact is significant. Texas ($13.1 billion), California ($11.6 billion), and Indiana ($9.1 billion) showed the largest contributions from manufacturing to their respective outdoor recreation economies. Indiana’s strong showing here is likely tied to its robust recreational vehicle (RV) manufacturing sector.
Context and Methodology: The Annual Update
The release of these comprehensive statistics is part of the BEA’s ongoing commitment to tracking the economic impact of outdoor recreation. The 2024 data incorporates updates from the 2025 annual update of the National Economic Accounts, which includes the National Income and Product Accounts and the Industry Economic Accounts. This process involves incorporating newly available and revised source data, ensuring the accuracy and relevance of the estimates.
Similarly, the state-level statistics have been refined to reflect these updated national figures, alongside the 2025 annual update of the Regional Economic Accounts and newly available regional source data. This meticulous annual revision process provides policymakers, businesses, and the public with the most current and reliable information to understand the evolving landscape of the outdoor recreation economy. The BEA also makes previously published estimates available in its Data Archive for historical comparison and analysis.
Implications and Future Outlook
The BEA’s detailed report provides a granular view of the outdoor recreation economy’s significance. The substantial contribution to GDP, robust job creation, and steady growth in compensation highlight its role as a vital economic engine. The diverse range of activities and industries involved underscores its broad economic impact, extending far beyond traditional outdoor pursuits.
The increasing importance of supporting activities, particularly travel and tourism, suggests that investments in infrastructure, hospitality, and transportation networks will continue to be critical for maximizing the economic benefits of outdoor recreation. State and local governments can leverage this data to identify areas for targeted investment, such as developing new recreational facilities, improving access to public lands, or promoting tourism.
For businesses operating within or adjacent to the outdoor recreation sector, understanding these trends is paramount. The shift in value added towards supporting and "other" outdoor activities, alongside the consistent strength of retail and the arts/entertainment sectors, suggests opportunities for diversification and innovation. For instance, businesses could explore partnerships with tourism operators, develop new outdoor experiences, or expand their offerings to cater to a wider range of outdoor interests.
As the nation continues to prioritize health, wellness, and sustainable tourism, the outdoor recreation economy is poised for continued growth. The BEA’s ongoing efforts to track and report on this sector will be indispensable for informed decision-making and strategic planning, ensuring that the full economic potential of America’s natural and recreational assets is realized. The next release of Outdoor Recreation Economic Statistics, covering 2025 data for the U.S. and states, is anticipated in Fall 2026.


