


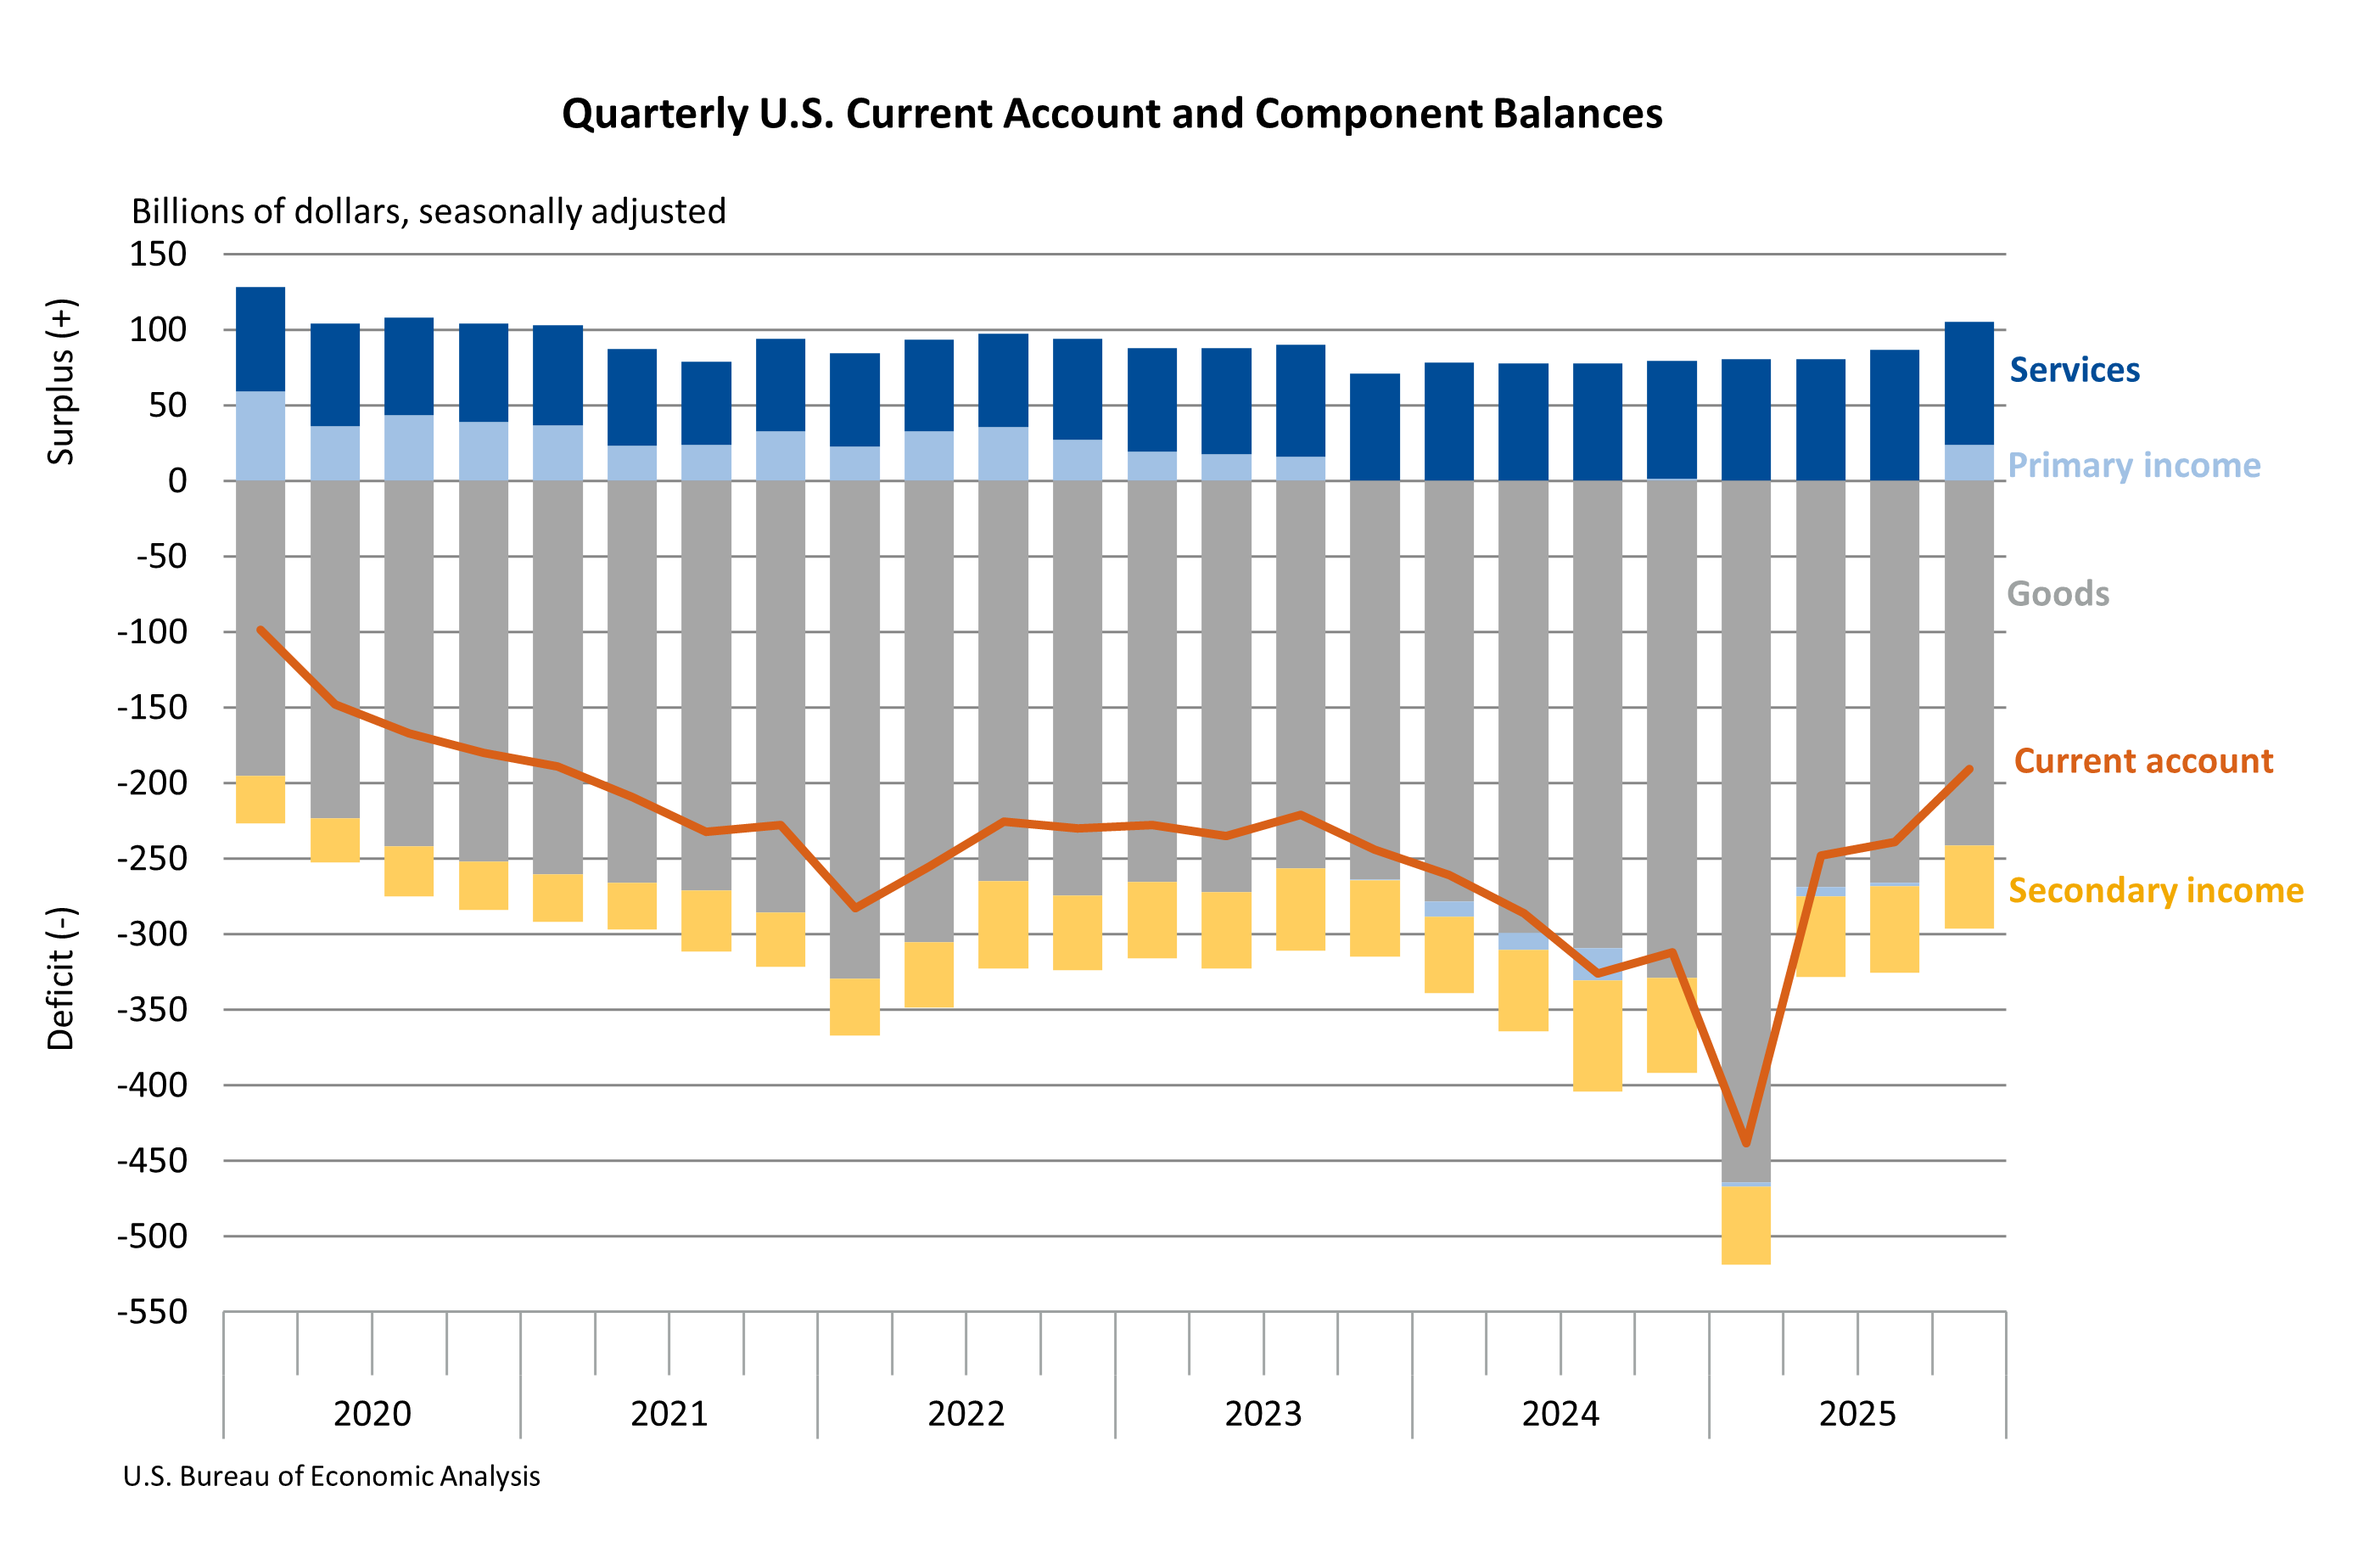
The U.S. current-account deficit, a key measure of a nation’s economic transactions with the rest of the world, experienced a notable contraction in the fourth quarter of 2025. According to statistics released by the U.S. Bureau of Economic Analysis (BEA), the deficit narrowed by $48.4 billion, or 20.2 percent, to $190.7 billion. This improvement marks a significant shift from the revised third-quarter deficit of $239.1 billion, indicating a healthier balance in the nation’s international dealings as the year concluded. The deficit’s share of current-dollar gross domestic product (GDP) also decreased, falling to 2.4 percent from 3.1 percent in the preceding quarter.
This substantial narrowing was primarily attributed to two key factors: a positive swing in the balance on primary income, which moved from a deficit in the third quarter to a surplus in the fourth, and a reduction in the deficit related to the trade of goods. These developments suggest a strengthening of U.S. earnings from its foreign investments and a more favorable goods trade balance, collectively contributing to a more robust international economic posture.
Key Drivers of the Fourth-Quarter Improvement
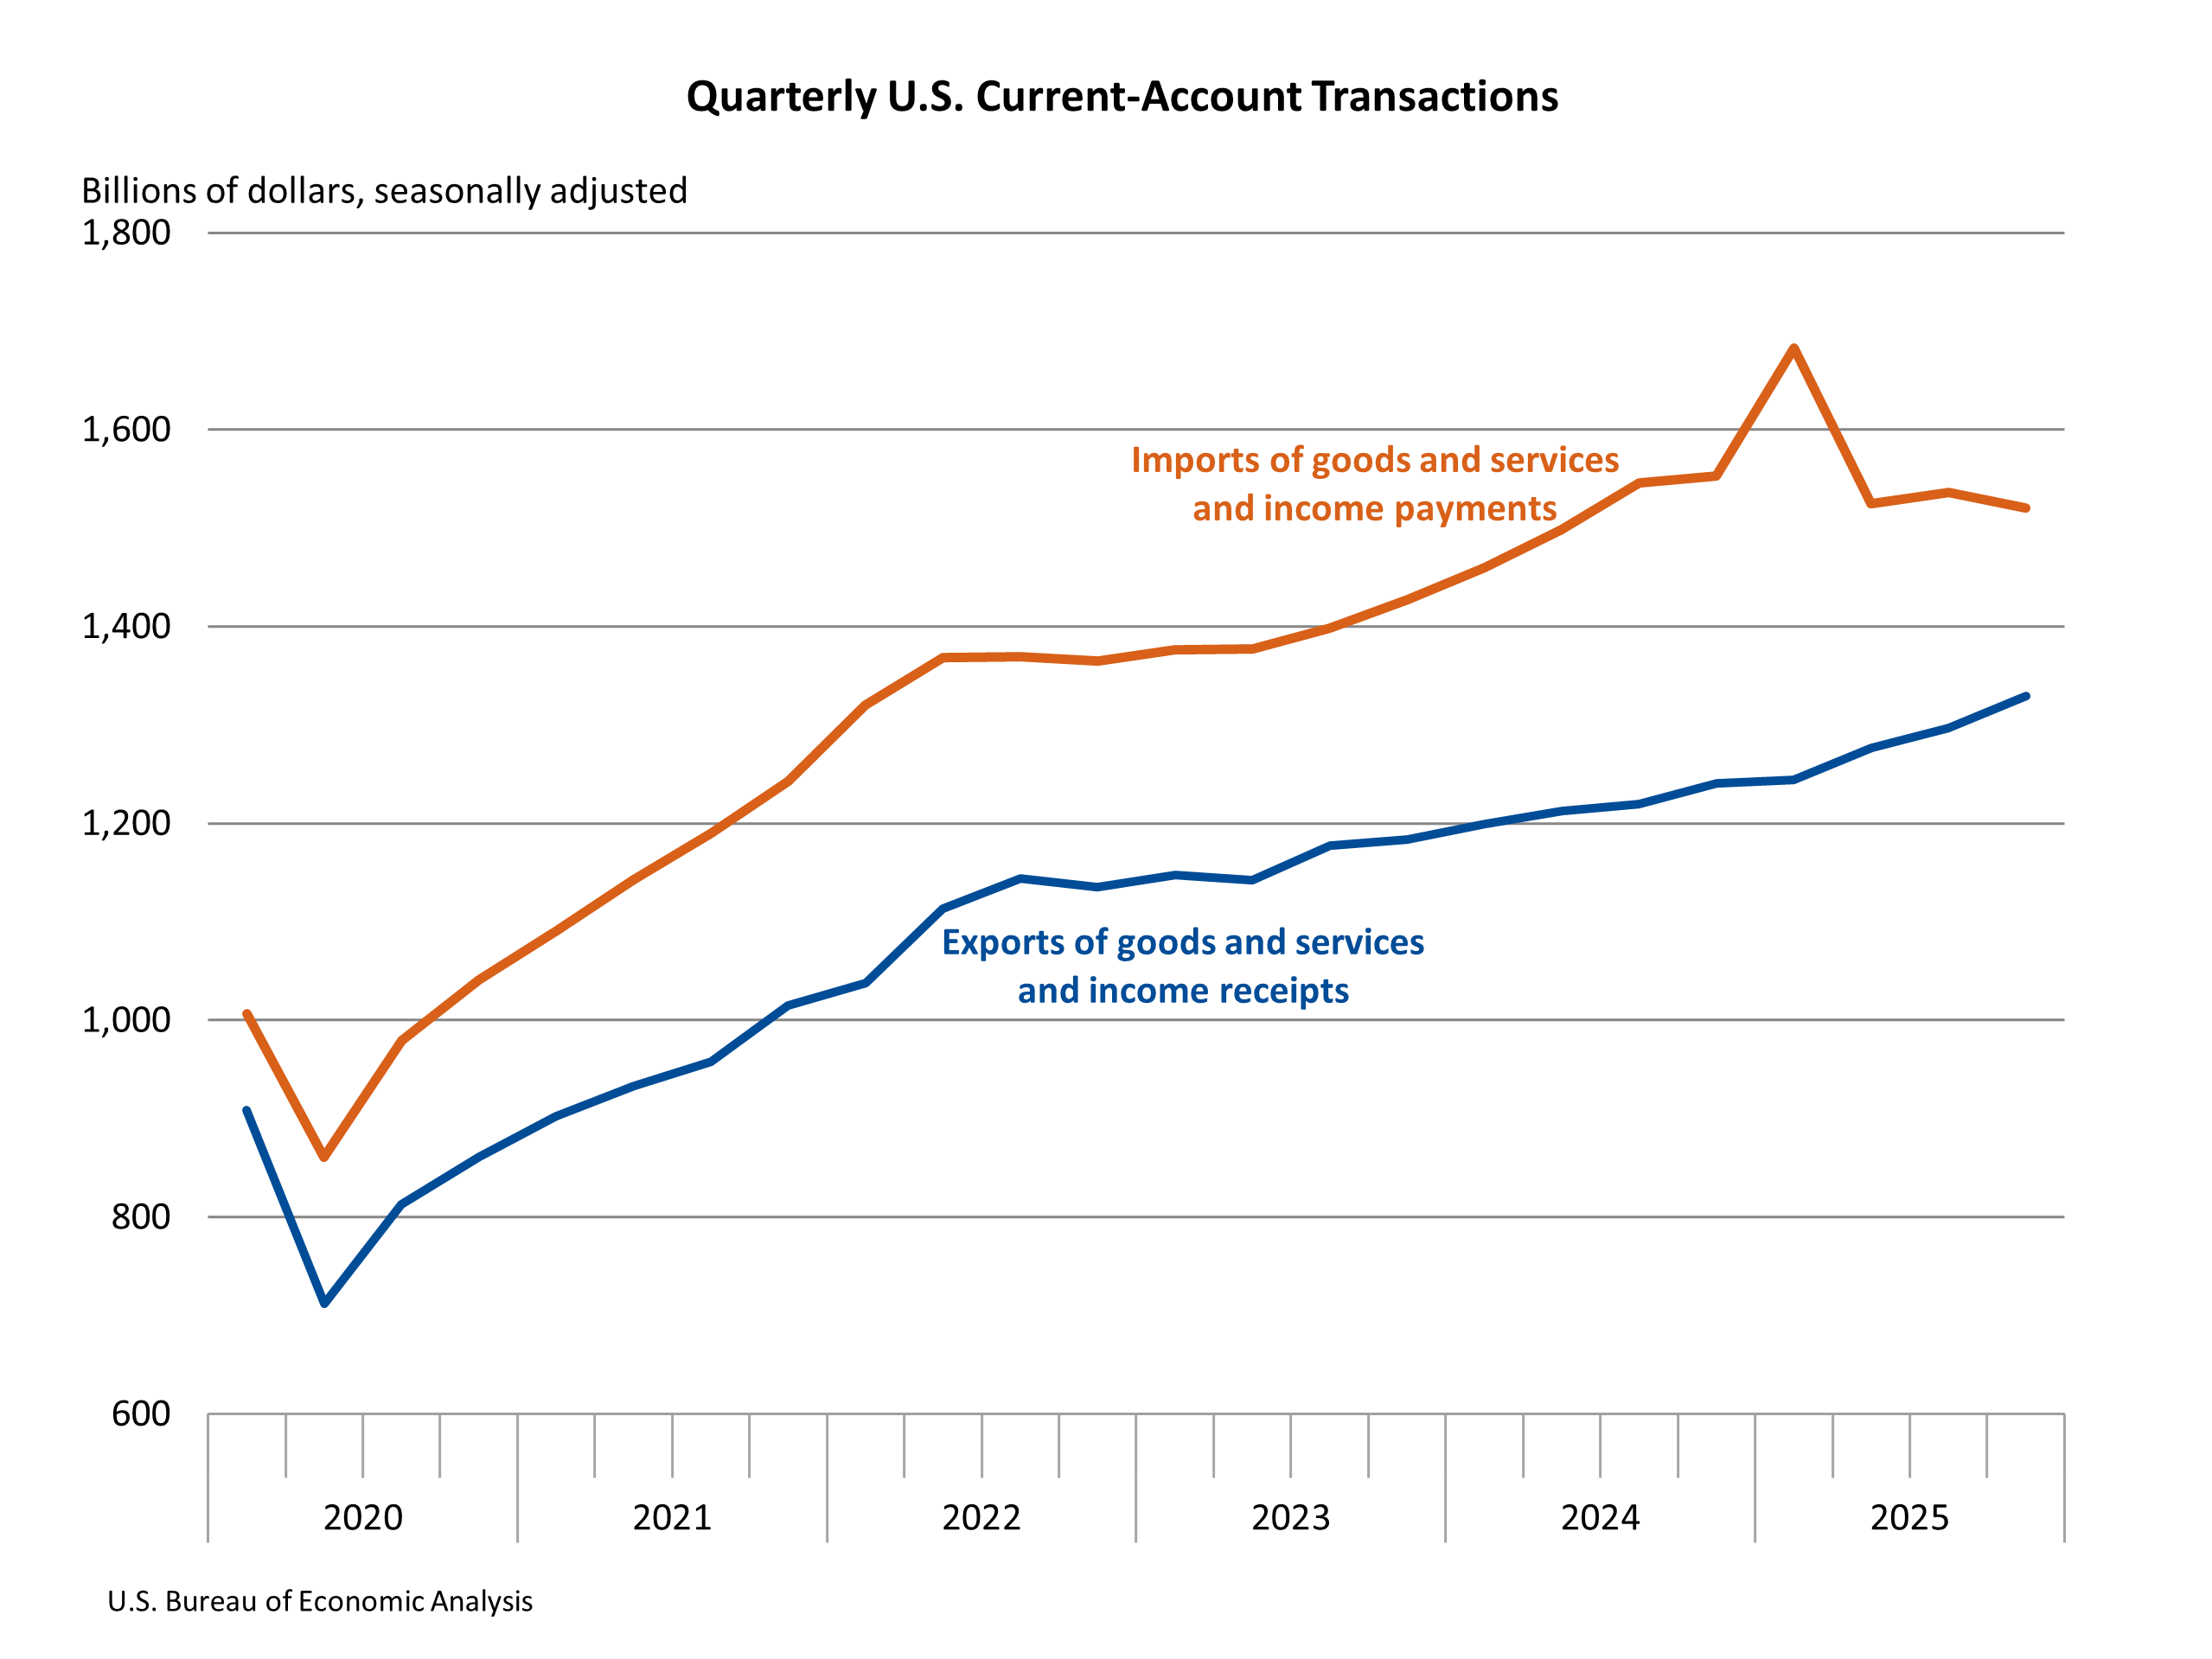
The BEA’s detailed breakdown reveals that exports of goods and services, along with income received from foreign residents, saw a significant increase of $32.4 billion, reaching a total of $1.33 trillion in the fourth quarter. This surge was fueled by robust growth in goods exports and a notable uptick in primary (earned) income receipts. Primary income encompasses earnings from foreign direct investments, portfolio investments (dividends and interest), and compensation of employees. The rise in these receipts indicates that U.S. assets held abroad are generating more income, a positive sign for the nation’s investment returns.
Conversely, imports of goods and services, along with income paid to foreign residents, experienced a decrease of $16.0 billion, settling at $1.52 trillion. This reduction was driven by lower primary income payments and a decline in goods imports. The decrease in income payments suggests that U.S. liabilities held by foreign entities are generating less income for their owners, further contributing to the improved primary income balance. The dip in goods imports, while contributing to the overall deficit reduction, could also signal shifts in domestic demand or supply chain adjustments.
The balance on primary income, which includes investment income and compensation of employees, shifted from a deficit of $2.5 billion in the third quarter to a surplus of $21.4 billion in the fourth quarter, a turnaround of $23.9 billion. This swing is a crucial element in understanding the overall improvement in the current account. The goods balance, a consistent driver of the U.S. current-account deficit, also saw a positive adjustment, narrowing by $1.5 billion to a deficit of $265.9 billion, reflecting the increase in goods exports and the decrease in goods imports. The services balance, a traditional area of U.S. strength, saw a slight decrease in its surplus from $86.5 billion to $85.1 billion, indicating continued robust performance in services exports.
Financial Account Dynamics and Net International Investment Position
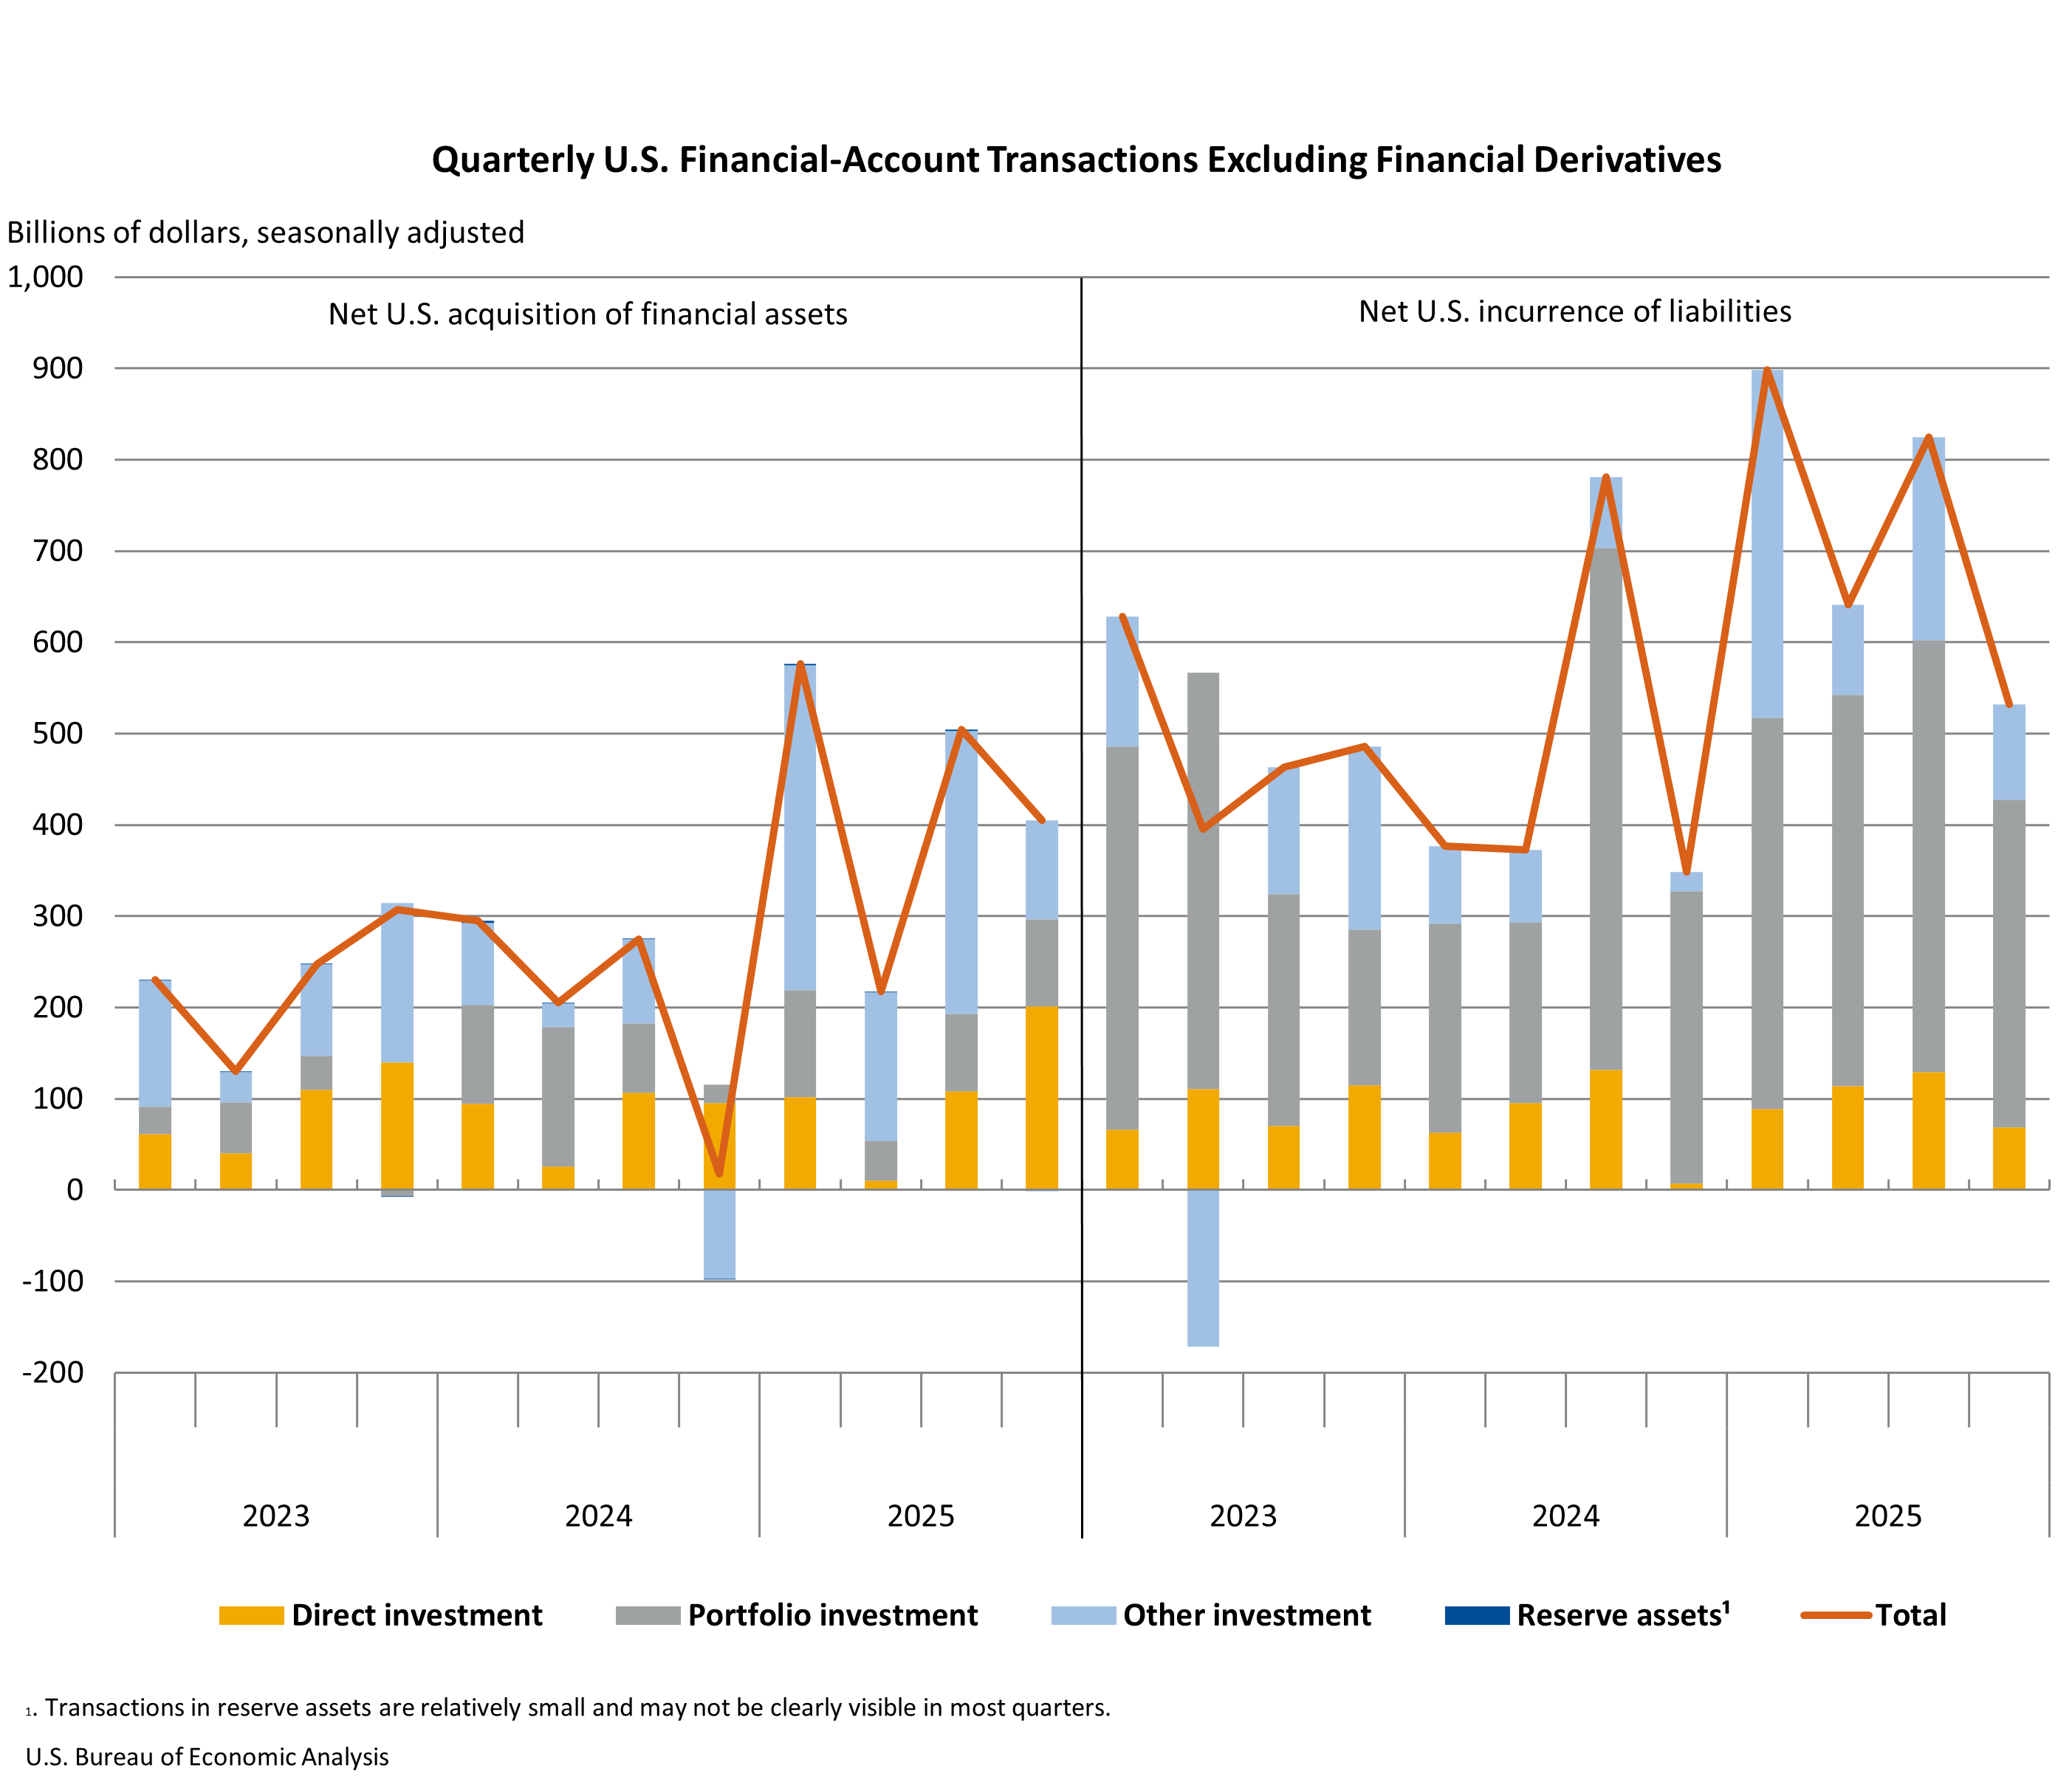
Beyond the current account, the U.S. financial account also provides insights into international economic flows. In the fourth quarter of 2025, net financial-account transactions registered at -$135.9 billion. This figure signifies net U.S. borrowing from foreign residents, meaning that the increase in U.S. liabilities to foreigners exceeded the increase in U.S. assets held abroad. During this period, U.S. residents increased their foreign financial assets by $405.0 billion, while simultaneously increasing their liabilities to foreign residents by $532.0 billion. This outflow of capital for investment abroad, coupled with increased foreign investment in the U.S., contributes to the net borrowing position.
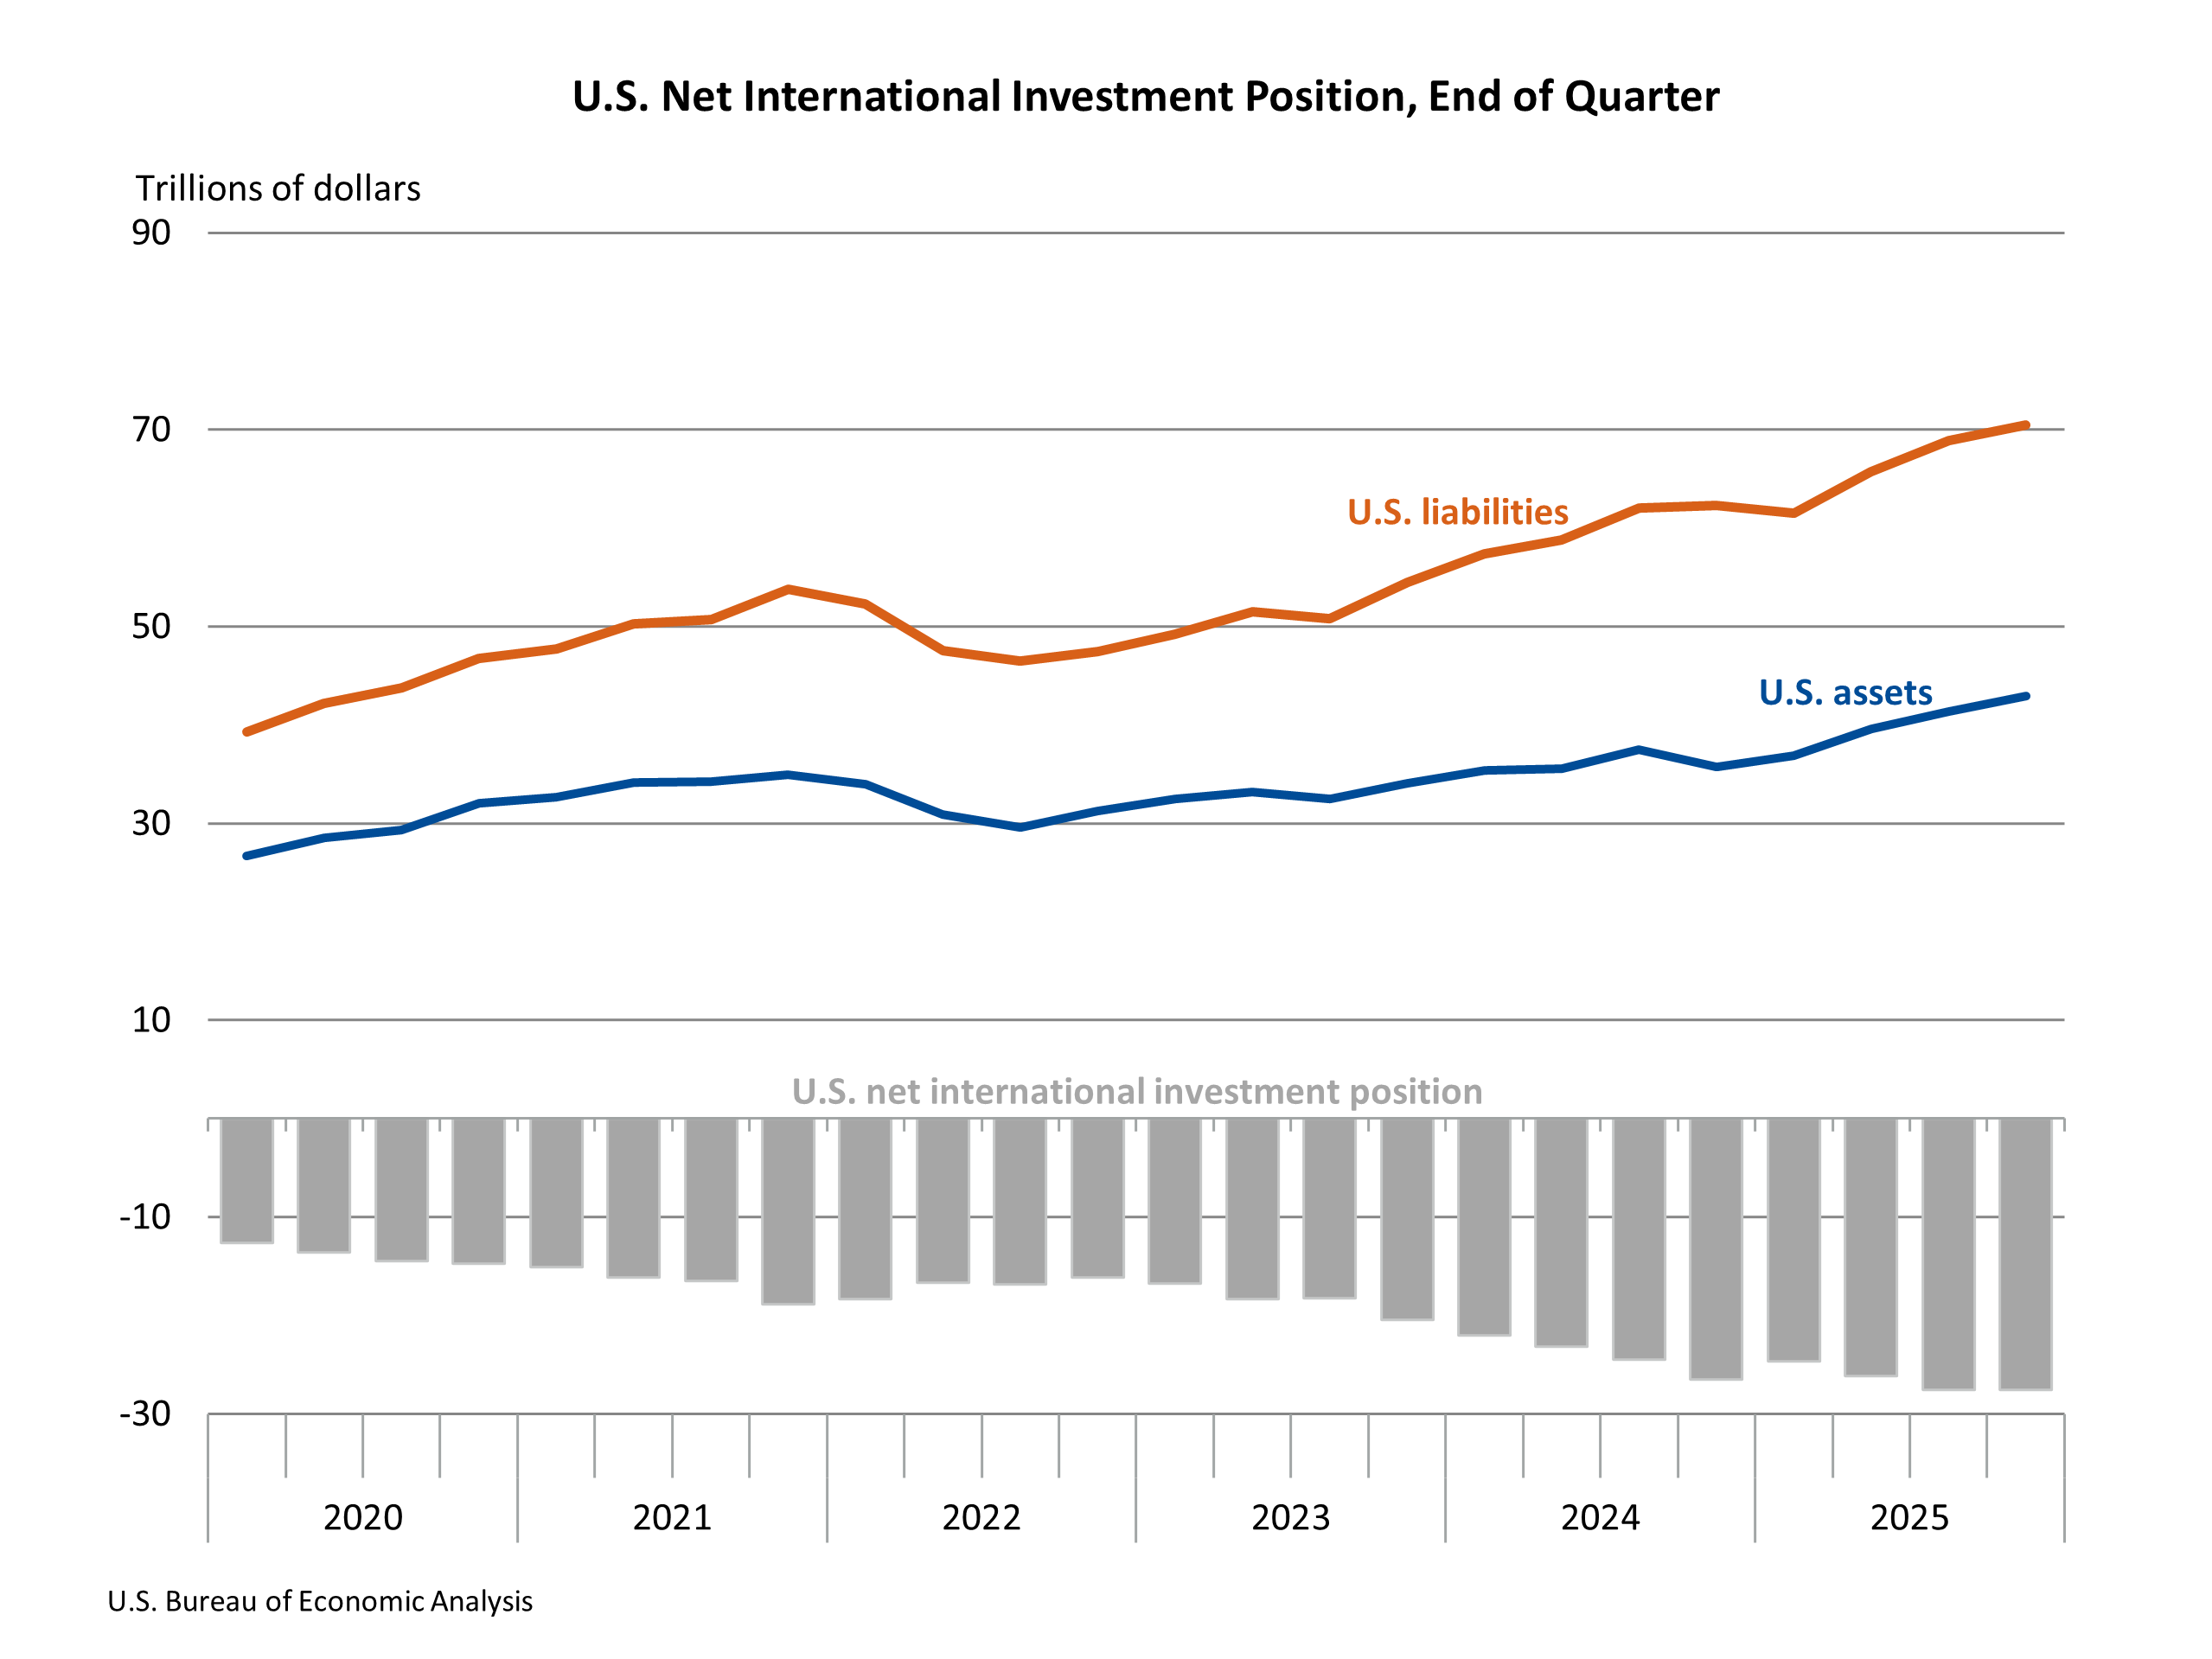
The U.S. net international investment position, which represents the difference between U.S. residents’ foreign financial assets and liabilities, stood at -$27.54 trillion at the end of the fourth quarter of 2025. This substantial negative position reflects a long-standing trend of the U.S. owing more to foreigners than foreigners owe to the U.S. At the close of the quarter, U.S. assets abroad totaled $42.96 trillion, while U.S. liabilities to foreign residents reached $70.49 trillion. This position saw a slight improvement from the revised third-quarter position of -$27.55 trillion, indicating a marginal reduction in the net indebtedness.
The changes in the international investment position are driven by both financial transactions and valuation changes. In the fourth quarter, U.S. assets increased by $1.62 trillion, driven by increases across major investment categories, particularly direct investment and portfolio investment. This growth was a combination of price changes ($1.10 trillion) and financial transactions ($405.0 billion). Similarly, U.S. liabilities increased by $1.61 trillion, also influenced by broad increases in investment categories, especially portfolio investment. Valuation changes accounted for $631.6 billion of this increase, with financial transactions contributing $532.0 billion. The substantial impact of valuation changes, particularly price appreciation in asset and liability holdings, played a significant role in the overall movement of the net international investment position.
Full-Year 2025 Performance
Looking at the full year 2025, the U.S. current-account deficit narrowed by $69.3 billion, or 5.8 percent, to $1.12 trillion. This annual reduction indicates a more sustainable international economic balance for the year compared to 2024, when the deficit represented 4.0 percent of current-dollar GDP. In 2025, the deficit settled at 3.6 percent of GDP.
Throughout 2025, both exports and imports of goods and services, along with income flows, saw substantial increases. Exports of goods and services to, and income received from, foreign residents rose by $276.2 billion to $5.15 trillion. Concurrently, imports of goods and services from, and income paid to, foreign residents increased by $206.9 billion to $6.26 trillion. While both sides of the international ledger grew, the faster growth in exports and income receipts contributed to the overall deficit reduction for the year.
Capital-transfer receipts saw a decrease of $3.6 billion to $9.2 billion in 2025, while capital-transfer payments decreased by $1.0 billion to $8.2 billion. These transfers, while smaller in magnitude compared to trade and income flows, represent one-way transactions without any corresponding return service or good.
Net financial-account transactions for the full year 2025 were -$1.21 trillion, indicating continued net borrowing from foreign residents. Over the year, U.S. residents increased their foreign financial assets by $1.7 trillion and their liabilities to foreign residents by $2.90 trillion. This substantial net outflow of capital underscores the ongoing role of foreign investment in financing U.S. economic activities.
The U.S. net international investment position at the end of 2025 was -$27.54 trillion, a slight widening from -$26.54 trillion at the end of 2024. This widening occurred despite the reduction in the current-account deficit. U.S. assets increased by a significant $7.24 trillion to $42.96 trillion by year-end 2025, while U.S. liabilities saw a larger increase of $8.24 trillion, reaching $70.49 trillion. The greater increase in liabilities relative to assets contributed to the deterioration of the net investment position over the year.
Revisions and Methodological Updates
The BEA also provided revised estimates for the third quarter of 2025, reflecting updated source data. The current-account balance for the third quarter was revised to a deficit of -$239.1 billion, a widening from the preliminary estimate of -$226.4 billion. This revision was primarily driven by a shift in the primary income balance from a preliminary surplus of $5.2 billion to a revised deficit of -$2.5 billion. The goods balance was also slightly revised downward, while the services and secondary income balances saw minor adjustments.
Net financial-account transactions for the third quarter were revised to -$376.4 billion from a preliminary -$409.9 billion. Similarly, the U.S. net international investment position was revised to -$27.55 trillion from a preliminary -$27.61 trillion. These revisions highlight the dynamic nature of economic data and the importance of updated information in providing a more accurate picture of economic activity.
A significant methodological update noted by the BEA is the inclusion of seasonally adjusted financial transactions in "Table 1.3. Change in the U.S. Net International Investment Position." This enhancement allows for a more granular analysis of quarterly financial flows, enabling economists and policymakers to better discern underlying trends from seasonal fluctuations. The BEA emphasized that the primary differences between seasonally adjusted and unadjusted data in this table are confined to specific components of direct investment and changes in volume and valuation.
Looking Ahead: Annual Updates and Future Releases
The BEA announced that the annual updates of the U.S. International Transactions Accounts (ITAs) and International Investment Position (IIP) Accounts, along with preliminary estimates for the first quarter of 2026, are scheduled for release on June 24, 2026. A preview of these comprehensive annual updates will be available in the Survey of Current Business in April 2026. These annual updates are crucial for incorporating a broader range of source data and ensuring the accuracy and consistency of the accounts over time.
The BEA also highlighted its commitment to providing accessible data through its Interactive Data Application. All statistics, including those for the fourth quarter and full year 2025, are available for users to explore. It is important to note that with the upcoming release of first-quarter 2026 data, the current figures will be superseded. Historical data featured in this release can be accessed in the BEA’s Data Archive.
The release of these figures provides critical insights into the U.S. economy’s engagement with the global marketplace. The narrowing of the current-account deficit, driven by improvements in income flows and trade, suggests a more balanced international economic performance in the latter part of 2025. While the U.S. continues to maintain a significant net international investment liability, the interplay of trade, investment income, and capital flows offers a complex but important picture of the nation’s economic health and its position within the global financial system. The ongoing updates and revisions underscore the continuous effort by the BEA to refine its data and provide the most accurate economic intelligence to policymakers, businesses, and the public.


