The annual revelation of state and local tax collection figures by the U.S. Census Bureau serves as a critical barometer of fiscal policy and economic health across the nation. While the April 15th deadline for federal and most state income tax filings often dominates public consciousness regarding taxation, it represents merely a fraction of the complex web of levies that support government services. Throughout the calendar year, state and local jurisdictions amass revenue through a diverse portfolio of taxes, funding everything from public education and infrastructure to healthcare and public safety. The most recent data for Fiscal Year 2023 underscores a profound divergence in per capita collections, with figures varying dramatically across the 50 states and the District of Columbia. This disparity reflects not only differences in tax rates and bases but also fundamental policy decisions, economic capacities, and the scope of public services each state chooses to provide.
Main Findings: A Snapshot of FY 2023
The U.S. Census Bureau’s latest report, covering Fiscal Year 2023, paints a vivid picture of the varying fiscal landscapes across the United States. This data, which is the most current available, allows for a comprehensive comparison of how much state and local governments collect per person, offering insights into the financial burden and public service provision in each jurisdiction. Understanding these per capita figures is crucial because they normalize collections across states with vastly different populations and economic scales, providing a more apples-to-apples comparison of tax effort.
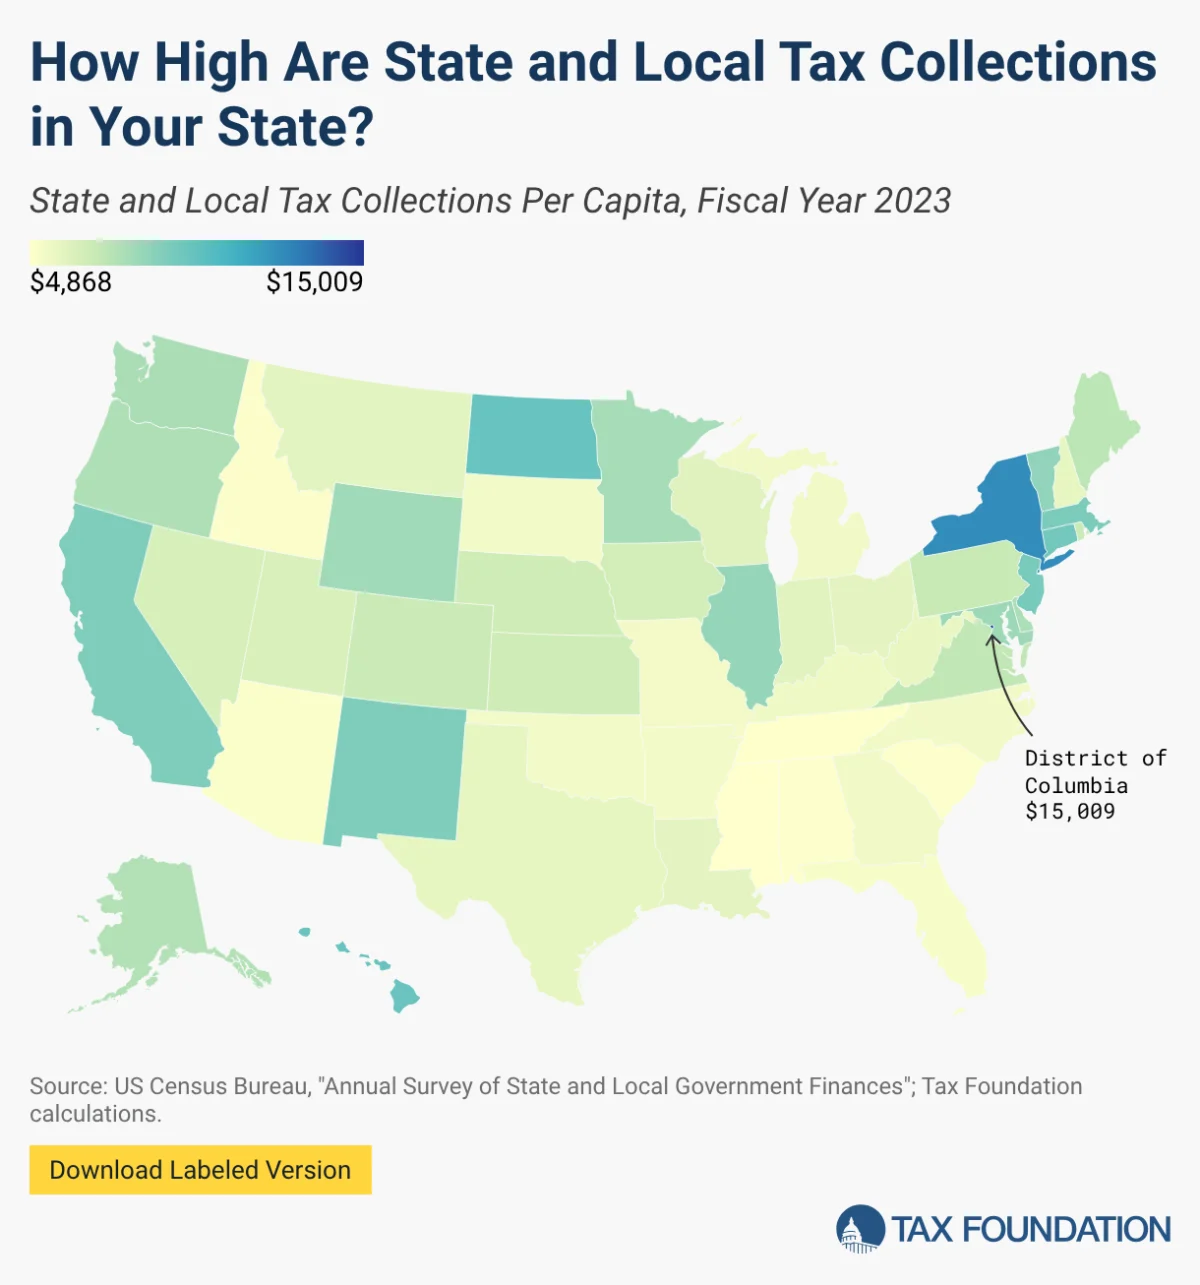
The national average for total state and local tax collections stood at $7,038 per capita in FY 2023. This figure encompasses a broad range of revenue streams, including individual and corporate income taxes, sales taxes, property taxes, and various excise taxes. However, this national average masks significant regional and state-specific variations that are critical for a nuanced understanding of America’s fiscal topography.
The National Average and Top Performers
At the pinnacle of per capita tax collections, the District of Columbia significantly outpaced all states, recording an impressive $15,009 per capita. This exceptionally high figure for DC is often attributed to its unique status as the nation’s capital, its dense urban environment, a substantial non-resident workforce contributing to income and sales taxes, and a robust demand for municipal services typical of a major city. Following DC, the five states with the highest per capita tax collections were:
- New York: $12,506
- North Dakota: $9,834
- Hawaii: $9,758
- Connecticut: $9,388
- New Jersey: $9,178
These states, with the exception of North Dakota, generally share characteristics such as highly progressive income tax structures and a greater reliance on a broad spectrum of public sector services, including extensive public transit systems and comprehensive social welfare programs. New York and New Jersey, for instance, are densely populated states with high costs of living and substantial urban infrastructure needs, which naturally translate to higher demands on public funding. Connecticut, while also featuring a progressive income tax, operates within a slightly different economic context, yet maintains a commitment to public services that necessitate substantial revenue. Hawaii’s unique island economy, coupled with a progressive income tax and a broad General Excise Tax that impacts many business-to-business transactions, further bolstered by significant tourism revenues, positions it among the highest.
North Dakota stands as a notable outlier among the high-collection states. Despite having one of the lowest top marginal individual income tax rates in the country (2.5 percent), its per capita collections are significantly elevated due to substantial severance tax revenue derived from its booming oil and gas production. This natural resource-driven revenue structure, combined with a relatively small population, allows the state to generate substantial collections per resident without imposing a heavy direct income tax burden on its citizens. This exemplifies how a state’s economic base, particularly reliance on specific industries, can profoundly shape its fiscal profile.
States with the Lowest Collections
Conversely, at the opposite end of the spectrum, a distinct set of states reported significantly lower per capita tax collections, often reflecting different policy philosophies, economic structures, and service priorities. The five states with the lowest tax collections per capita were:
- Mississippi: $4,868
- Tennessee: $4,912
- Alabama: $4,950
- South Carolina: $4,984
- Arizona: $5,006
These states generally exhibit a preference for more limited government intervention and often employ tax policies designed to foster economic growth by attracting residents, workers, and businesses through lower tax burdens. Many of them eschew or are actively reducing individual income taxes, instead relying more heavily on consumption-based taxes like sales taxes. For example, Tennessee imposes no individual income tax, and Arizona features a low, flat-rate individual income tax. Both states compensate for this by having relatively higher combined state and local sales tax rates, at 9.61 percent and 8.52 percent respectively, which constitute a larger share of their overall revenue. Mississippi and South Carolina have also been actively pursuing multi-year individual income tax rate reductions, with ambitious long-term goals of potentially eliminating these taxes entirely, contingent on revenue triggers.
Understanding the Diverse Tax Landscape
The broad range in per capita tax collections across states is a testament to the diverse approaches to public finance within the U.S. Each state crafts its own unique tax landscape, balancing the need for revenue with economic development goals and the political preferences of its populace.
Beyond Income Taxes: A Mix of Revenue Streams
While individual income taxes often grab headlines, state and local governments depend on a multifaceted revenue portfolio. This includes:
- Sales Taxes: Levied on the sale of goods and some services, these taxes are a significant revenue source for many states, particularly those without income taxes or with low income tax rates. They are often criticized for being regressive, as lower-income households tend to spend a larger proportion of their income on taxable goods.
- Property Taxes: Primarily a local government revenue source, property taxes fund schools, local infrastructure, and municipal services. They are typically based on the assessed value of real estate and are a stable, predictable source of funding.
- Corporate Income Taxes: Taxes on business profits contribute to state revenues, though their rates and structures vary widely, influencing business location decisions.
- Excise Taxes: Specific taxes on goods like gasoline, tobacco, alcohol, and sometimes services, these are often earmarked for specific purposes (e.g., gasoline taxes for road maintenance).
- Severance Taxes: Taxes on the extraction of natural resources (like oil, gas, coal), these are highly volatile and depend heavily on commodity prices and production levels, as seen in North Dakota.
Nationally, property taxes tend to be the largest source of local government revenue, while state governments often rely more heavily on sales and individual income taxes. The blend of these taxes, and the rates at which they are applied, fundamentally shapes a state’s fiscal identity and its capacity to fund public services.
The Role of Economic Drivers and Demographics
The economic capacity of a state plays a pivotal role in its tax collection figures. States with robust, diversified economies, higher median incomes, and significant commercial activity tend to generate more tax revenue. Demographic factors, such as population density, age distribution, and tourism levels, also heavily influence revenue streams. For instance, states with aging populations may face higher healthcare costs, while those with younger populations might prioritize education spending. Tourism-dependent economies, like Hawaii, can leverage taxes on visitors to fund services for residents, a concept known as "tax exporting."
Deeper Dive: Explaining the Outliers
A closer examination of the states at the extremes of the per capita collection spectrum reveals specific policy choices and economic realities driving their positions.
High-Tax States: Services, Progressivity, and Unique Factors
The states consistently appearing at the top of the per capita tax collection rankings often do so by design, reflecting a societal preference for comprehensive public services and a willingness to fund them through higher taxation.
- New York, New Jersey, and Connecticut: These Northeastern states are characterized by high costs of living, dense populations, and extensive public infrastructure. Their progressive income tax structures mean that higher earners contribute a larger percentage of their income, enabling the funding of robust social safety nets, quality education systems, and substantial investments in public transportation, which is particularly critical in their urban centers. Public officials in these states frequently argue that the higher tax burden is justified by the superior quality and breadth of public services, contributing to a high quality of life for their residents, despite the cost.
- Hawaii: The Aloha State’s high per capita collections stem from a confluence of factors. Its progressive income tax is supplemented by the unique General Excise Tax (GET), which is unusually broad, applying not only to retail sales but also to many business-to-business transactions, leading to a phenomenon known as "tax pyramiding." Furthermore, Hawaii’s economy is heavily reliant on tourism, generating significant tax revenue from non-residents through various levies on accommodations, car rentals, and other visitor-related expenditures. This allows the state to export a substantial portion of its tax burden to tourists.
- North Dakota: As previously noted, North Dakota’s position is an anomaly driven almost entirely by its natural resource wealth. The state’s oil and gas severance taxes provide an enormous revenue stream relative to its small population. This allows North Dakota to maintain a very low individual income tax rate while still having high per capita collections. This model effectively transfers a significant portion of the tax burden to companies extracting resources, and indirectly, to consumers of those resources globally, rather than directly taxing its residents’ incomes or consumption heavily.
Low-Tax States: Growth Strategies and Revenue Composition
States with lower per capita tax collections often pursue a fiscal strategy centered on limited government and economic competitiveness, aiming to attract businesses and residents with lower tax burdens.
- Tennessee and Arizona: These states exemplify the "no income tax" or "low income tax" model. Tennessee has no individual income tax, while Arizona has shifted to a low, flat-rate income tax. To compensate for the absence or minimization of income tax revenue, both states lean heavily on sales taxes. While this approach can be attractive to high-income earners and businesses, it can place a disproportionately higher burden on lower-income households due to the regressive nature of sales taxes. Proponents of this model often highlight its role in fostering economic growth, attracting new residents, and stimulating business investment by offering a more tax-friendly environment.
- Mississippi, Alabama, and South Carolina: These Southern states have historically had lower per capita incomes and a more limited public service footprint compared to their Northeastern counterparts. Mississippi and South Carolina are currently engaged in significant tax reform efforts, including multi-year individual income tax rate reductions with the ultimate goal of elimination. This trend reflects a broader regional movement towards reducing reliance on income taxes, aiming to enhance economic competitiveness and population growth. Alabama also maintains a relatively low tax burden through a combination of low property taxes and a moderate sales tax.
The "Tax Exporting" Phenomenon
A crucial concept in understanding per capita tax collections is "tax exporting." This refers to the practice where a state generates tax revenue from non-residents or out-of-state entities, effectively shifting a portion of its tax burden beyond its resident population.
- Severance Taxes: As seen in North Dakota, taxes on natural resource extraction are largely "exported" to consumers of those resources, wherever they may be located, and to investors in the resource extraction companies.
- Tourism Taxes: States like Hawaii and Florida heavily rely on tourism-related taxes (e.g., hotel occupancy taxes, rental car taxes, sales taxes on tourist purchases). These taxes are paid primarily by visitors who do not reside in the state and thus have no political recourse. This can make a state appear to have a high per capita tax collection, even though its residents may bear a relatively low direct burden.
- Business Taxes: Corporate income taxes or certain business property taxes can also be exported. Businesses may pass these costs on to consumers through higher prices, to employees through lower wages, or to shareholders through reduced dividends, often impacting individuals and entities outside the taxing state.
The distinction between legal incidence (who is legally required to pay the tax) and economic incidence (who ultimately bears the cost of the tax) is vital. States with significant tax exporting capabilities can maintain robust public services with a lower direct burden on their resident voters, making their per capita collection figures potentially misleading as a measure of resident tax burden.
Recent Trends and Policy Shifts
The fiscal landscape of state and local taxation is not static; it is continually evolving in response to economic conditions, demographic changes, and political priorities.
The Push for Income Tax Reduction
A significant trend in recent years, particularly in Southern and Mountain West states, has been the push for individual income tax reductions or outright elimination. States like Mississippi, South Carolina, Iowa, and others have either implemented or are considering substantial income tax reforms, often moving towards flatter rates or a complete phase-out. This movement is frequently driven by the desire to improve a state’s ranking in business climate indices, attract high-income earners, and stimulate economic growth. The underlying philosophy is that lower income taxes make a state more attractive for both individuals and businesses, leading to increased investment and population growth. However, this often necessitates a greater reliance on other revenue sources, such as sales or property taxes, which can have different distributional impacts.
The Ongoing Debate: Services vs. Economic Competitiveness
The wide disparity in tax collections reflects an enduring ideological debate in American governance: the balance between providing extensive public services funded by higher taxes versus fostering economic competitiveness through lower tax burdens and more limited government. States at the higher end of the per capita collection spectrum typically prioritize a comprehensive suite of public services, often including robust social safety nets, extensive infrastructure, and higher levels of public education spending. They argue that these investments create a higher quality of life and attract skilled labor. Conversely, states at the lower end emphasize economic freedom, lower costs of doing business, and the belief that a lighter tax touch stimulates private sector growth and innovation.
Implications for Residents, Businesses, and State Governance
The varied approaches to taxation have profound implications for virtually every aspect of life within a state.
Impact on Interstate Migration and Economic Development
Tax policy is undeniably a factor in interstate migration. While quality of life, job opportunities, and family ties often dominate relocation decisions, tax burden can be a tipping point, particularly for high-income earners and retirees. States with lower income taxes often market themselves as destinations for those seeking to minimize their tax liabilities. Businesses also consider state and local tax environments when making location decisions, weighing tax rates against the quality of infrastructure, workforce, and public services funded by those taxes. The migration patterns observed over the past decade, with significant population shifts towards Southern and Southwestern states, are often linked, in part, to these states’ more favorable tax climates, although other factors like climate and housing affordability also play a crucial role.
The Balance of Burdens and Benefits
Ultimately, the per capita tax collection figures are not merely abstract statistics; they represent the collective decision of a state’s residents and their elected officials regarding the level of public services they desire and how they choose to fund them. A state with high per capita collections might offer superior public education, well-maintained roads, and extensive social programs. A state with lower collections might have a more limited public sector but potentially offer a lower cost of living and greater individual economic freedom. The challenge for policymakers is to strike a balance that aligns with the preferences of their constituents, supports sustainable economic growth, and provides the necessary resources for essential government functions. The concept of economic incidence reminds us that the "true cost" of taxes is not always evident in who writes the check, but rather in who ultimately bears the burden and what benefits are received in return.
Conclusion: A Continually Evolving Fiscal Picture
The U.S. Census Bureau’s FY 2023 data on state and local tax collections per capita offers a revealing snapshot of the nation’s diverse fiscal strategies. From the service-rich, progressively taxed environments of the Northeast to the resource-driven wealth of North Dakota and the low-tax, growth-focused states of the South, each jurisdiction crafts a unique approach to public finance. As states continue to navigate economic fluctuations, demographic shifts, and evolving public demands, the ongoing debate over tax structures, public service provision, and economic competitiveness will undoubtedly continue to shape these figures in the years to come, making the annual release of this data an essential resource for policymakers, businesses, and citizens alike.