Candice Horbacz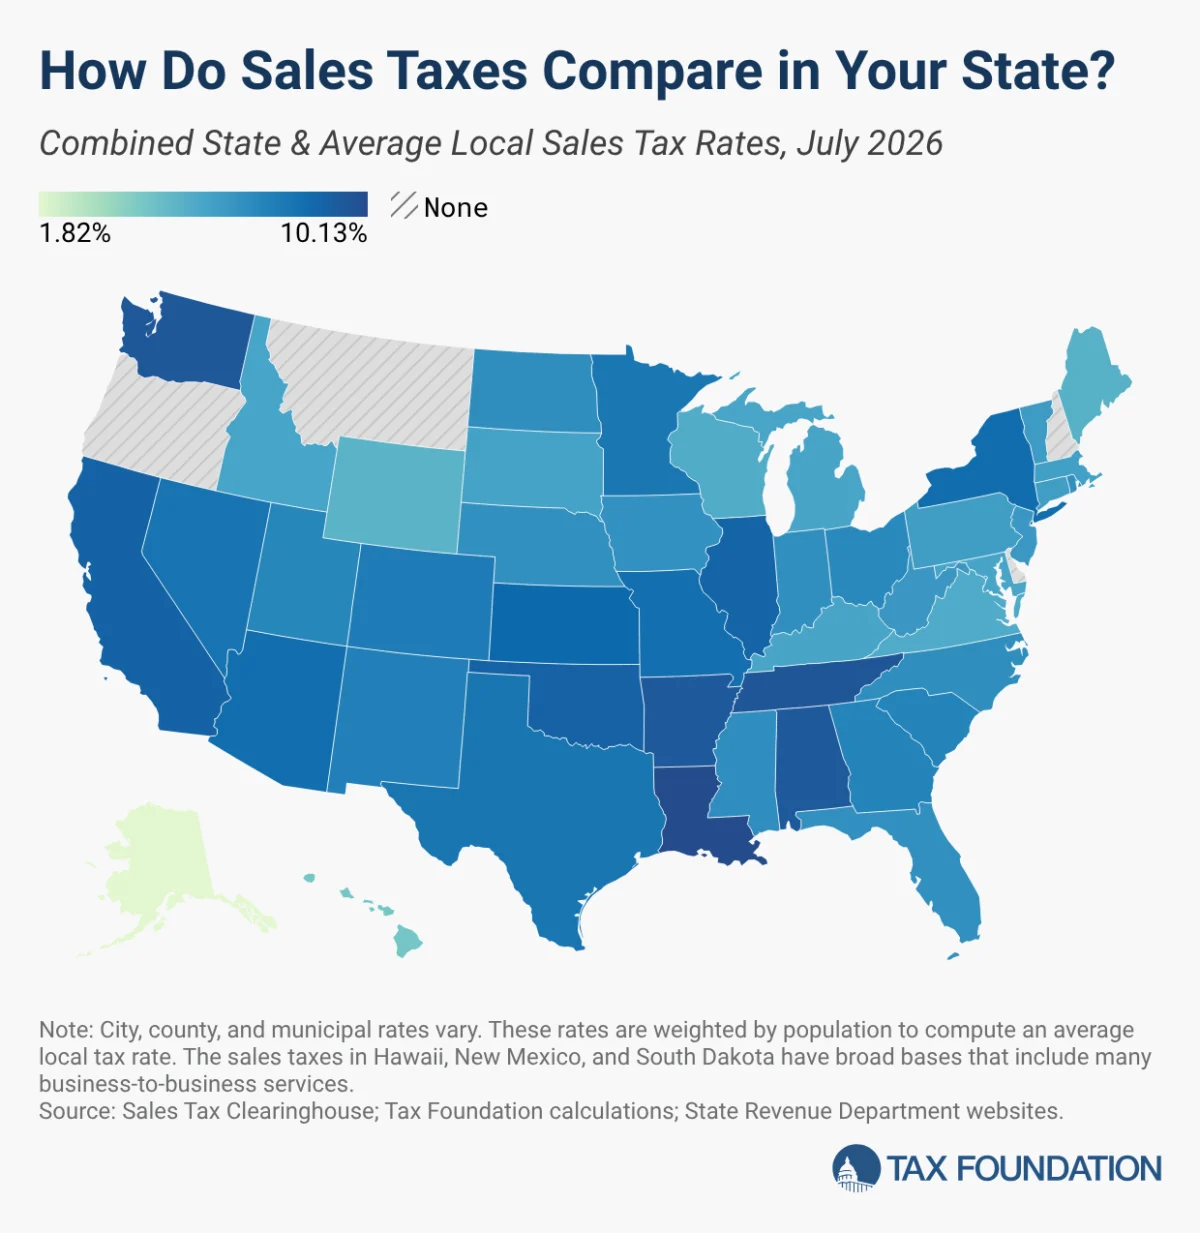
Retail sales taxes stand as a formidable pillar of public finance for most states across the United States, constituting a significant 32 percent of total state tax collections and 13 percent of local tax collections, culminating in 24 percent of combined state and local revenue streams. These taxes are frequently lauded by economists as being more pro-growth than income taxes, primarily because their structure tends to introduce fewer economic distortions, thereby theoretically encouraging investment and economic activity.
The vast majority of states, 45 to be precise, implement a state-level sales tax, while 38 states empower their local jurisdictions to levy additional sales taxes. This dual-layer taxation can lead to substantial local rates that, in numerous instances, either rival or even surpass the statewide rates. Consequently, states with seemingly moderate statewide sales tax figures can, in practice, impose some of the nation’s highest combined state and local rates when local levies are factored in. This intricate tapestry of taxation underscores the complexity of state fiscal landscapes and the varying burdens placed on consumers and businesses.
Understanding the Landscape: Combined State and Local Rates
As of July 1, 2026, a detailed analysis reveals the states bearing the highest average combined state and local sales tax rates. Louisiana leads the nation with an average combined rate of 10.13 percent, making it the most expensive state for sales tax in the country. Following closely are Tennessee at 9.61 percent, Washington at 9.57 percent, Arkansas at 9.48 percent, and Alabama at 9.46 percent. These figures highlight regions where consumers face a significantly higher sales tax burden on their purchases. Nationwide, the population-weighted average combined sales tax rate hovers at 7.53 percent, offering a benchmark against which individual state rates can be measured.
The period since January 2026 has witnessed several states experiencing minor adjustments in their combined sales tax rates, predominantly due to shifts in local sales taxes. Notable increases in combined rates were observed in North Carolina, which experienced a four-place change in its national ranking, as well as in Georgia, Washington, California, and Vermont. Conversely, Wyoming stood out as the sole state to record a reduction in its combined rate, a result of multiple jurisdictions within the state opting to decrease their local option tax rates during February and July. These changes, though often small individually, collectively reflect ongoing adjustments in local fiscal strategies and economic conditions.
Sales Taxes in Broader Context: A Piece of the Fiscal Puzzle
It is crucial to consider sales taxes not in isolation but as an integral component of a state’s overall tax mix. States often strategically balance various tax types to meet their revenue needs while aiming for economic competitiveness. For instance, Tennessee exemplifies this balancing act by imposing high sales taxes but notably refraining from levying an individual income tax. In stark contrast, Oregon operates without a sales tax but compensates with comparatively high income taxes. While myriad factors influence business location and investment decisions—ranging from labor costs and regulatory environments to infrastructure and quality of life—sales taxes represent a direct lever policymakers can control, with the potential for immediate economic impacts on consumer behavior and business profitability.
Recent Shifts and Policy Dynamics: January to July 2026
The first half of 2026 brought a series of localized adjustments that subtly reshaped the sales tax landscape across the U.S. These changes, primarily at the local level, illustrate the dynamic nature of state and municipal fiscal policies.
- North Carolina’s Ascent: The slight increase in North Carolina’s combined rate, leading to a four-place rank change, underscores the cumulative effect of minor local adjustments. While specific legislative actions for these local changes were not detailed, they likely stemmed from county or municipal decisions to fund local services or infrastructure projects, reflecting localized revenue needs.
- Georgia’s Floating Local Option Sales Tax (FLOST): Several counties in Georgia saw their sales tax rates climb by up to one percentage point. This was largely attributable to the implementation or reauthorization of the Floating Local Option Sales Tax (FLOST). FLOST is an optional countywide sales tax, typically levied for up to five years, explicitly designed to provide property tax relief to residents. The revenue generated is shared between the levying county and its constituent municipalities, creating a direct link between sales tax increases and property tax mitigation efforts. This mechanism highlights a common strategy among states to diversify revenue sources and ease the burden on property owners.
- Wyoming’s Reduction: Wyoming’s distinction as the only state to experience a reduction in its combined rate was due to several jurisdictions reducing their local option tax rates. This move, occurring in February and July, suggests a localized effort to potentially stimulate economic activity, enhance competitiveness, or respond to improved fiscal health at the municipal or county level, demonstrating a rare instance of tax relief in the current environment.
- Other Incremental Increases: Washington, California, and Vermont also observed marginal increases in their combined rates, driven by a series of small, localized adjustments. These could be attributed to a range of factors, including funding for specific public services, infrastructure improvements, or local budget balancing initiatives, reflecting the decentralized nature of sales tax administration in many states.
These granular changes, while not always altering statewide rankings dramatically, are critical for local economies and demonstrate the ongoing efforts of jurisdictions to manage their budgets and respond to local needs.
State-Level Sales Tax Trends: A Closer Look
While local rates contribute significantly to the overall tax burden, the state-level sales tax forms the foundational component. Five states notably stand apart by having no statewide sales tax: Alaska, Delaware, Montana, New Hampshire, and Oregon. Among these, only Alaska permits its localities to impose local sales taxes, offering a unique blend of no statewide tax with potential local levies.
At the other end of the spectrum, California imposes the highest state-level sales tax rate at 7.25 percent. Four states share the second-highest spot at 7 percent: Indiana, Mississippi, Rhode Island, and Tennessee. Conversely, Colorado boasts the lowest non-zero state-level rate at 2.9 percent, followed by five states at 4 percent: Alabama, Georgia, Hawaii, New York, and Wyoming. These variations underscore diverse state philosophies regarding sales tax reliance and their overall revenue strategies.
Notable State Policy Actions and Reforms: A Chronology
The period leading up to 2026 has seen several states undertake significant reforms or adjustments to their sales tax rates, often as part of broader fiscal packages.
- Louisiana’s Major Overhaul (January 2025): Louisiana stands out as the most recent state to implement a statewide sales tax rate increase. Effective January 2025, the state rate climbed from 4.45 percent to 5 percent, reversing a reduction that had been in effect since July 2018. This increase was not an isolated event but a critical component of a comprehensive tax reform package. This ambitious package also included the adoption of a 3 percent flat individual income tax, a 5.5 percent corporate income tax, the introduction of full expensing provisions, and the repeal of the state’s franchise tax. The multifaceted nature of Louisiana’s reform indicates a strategic effort by policymakers to simplify the tax code, enhance economic competitiveness, and ensure long-term fiscal stability, demonstrating a holistic approach to state revenue generation.
- South Dakota’s Temporary Reduction (2023): In 2023, South Dakota implemented a reduction in its state sales tax rate. However, this measure is set to sunset in June 2027, highlighting a legislative tendency towards temporary tax adjustments, often in response to budget surpluses or specific economic conditions. Such temporary changes allow states flexibility while mitigating long-term revenue risks.
- New Mexico’s Gross Receipts Tax Adjustment (July 2022): New Mexico, which levies a hybrid tax it refers to as its gross receipts tax (functioning similarly to a sales tax but with a broader application), lowered its state-level rate from 5.125 percent to 4.875 percent in July 2022. A unique contingency clause accompanies this reduction: if the revenue generated from the gross receipts tax in any single fiscal year from 2026 to 2029 falls below 95 percent of the previous year’s revenue, the state’s rate will automatically revert to 5.125 percent on the subsequent July 1. This mechanism illustrates a cautious approach to tax cuts, building in safeguards against unforeseen revenue shortfalls and reflecting a commitment to fiscal prudence.
- The Broader Trend: Interestingly, there was no state-wide tax rate change between January 2026 and July 2026. In recent years, sales tax rate reductions have been relatively uncommon. State lawmakers have generally prioritized income tax cuts, which are often perceived to yield greater economic benefits by directly influencing investment and labor decisions, thereby encouraging economic growth more directly than sales tax adjustments.
Local Sales Tax Dynamics: The Unseen Variable
While statewide rates often grab headlines, local sales taxes represent a substantial, and often overlooked, component of the total tax burden. These local levies significantly influence the combined average rates and can vary dramatically even within a single state.
- Highest Average Local Rates: The states with the highest average local sales tax rates include Alabama (5.46 percent), Louisiana (5.13 percent), Colorado (4.99 percent), Oklahoma (4.56 percent), and New York (4.54 percent). These figures underscore the considerable fiscal autonomy granted to local jurisdictions in these states and their reliance on sales tax revenue to fund local services.
- Illinois’ Food Tax Elimination (January 1, 2026): Effective January 1, 2026, Illinois eliminated its one percent sales tax on food items, a move widely lauded as a measure to ease the financial burden on low-income households. However, many local jurisdictions within Illinois swiftly chose to impose their own local taxes on food. This illustrates a common challenge in tax reform: while a state may reduce a tax, local entities often have the authority and need to implement their own versions, potentially mitigating the intended relief at the local level.
- New Jersey’s Urban Enterprise Zones: Some cities in New Jersey host "Urban Enterprise Zones," designated areas where qualifying sellers collect sales tax at half the statewide rate (3.3125 percent). This targeted tax reduction is designed to stimulate economic development and job creation in distressed urban areas. This is reflected as a small negative adjustment to the average local rate in statewide calculations, highlighting specific policy tools used to foster regional economic growth.
Louisiana, despite its recent statewide increase, continues to maintain the highest combined state and average local sales tax rate among all states at 10.11 percent, cementing its position at the top of the combined tax burden rankings.
The Role of Competition in Setting Sales Tax Rates
The phenomenon of sales tax avoidance is a critical consideration for policymakers, particularly in areas where there is a significant disparity between jurisdictions’ rates. Research consistently demonstrates that consumers are not passive actors; they can and do alter their purchasing behavior, often traveling to lower-tax areas for major purchases. This behavior is commonly observed in transitions from cities to suburbs or across state lines.
- The Chicago Example: A stark illustration of this occurs in the Chicago metropolitan area, where consumers often make significant purchases in surrounding suburbs or increasingly online to circumvent Chicago’s substantial 10.25 percent sales tax rate. This "leakage" of sales revenue represents a direct loss for the city’s coffers.
- New England’s Interstate Dynamics: The New England region provides another compelling example of interstate sales tax competition. Despite Interstate 91 running predominantly along the Vermont side of the Connecticut River, a disproportionately higher number of retail establishments choose to locate on the New Hampshire side. New Hampshire, notably, has no sales tax. One study highlighted that per capita sales in border counties in sales-tax-free New Hampshire have tripled since the late 1950s, while per capita sales in neighboring Vermont border counties have remained stagnant. This stark divergence underscores the powerful influence of sales tax differentials on retail location decisions and regional economic development.
- Delaware’s "Tax-Free Shopping": Delaware has historically leveraged its sales-tax-free status as a marketing advantage, famously reminding motorists via its highway welcome sign that it is the "Home of Tax-Free Shopping." This illustrates how the absence of a sales tax can become a unique selling proposition for a state, attracting both consumers and businesses.
These examples serve as a cautionary tale for state and local governments: raising rates too high relative to neighboring jurisdictions can be counterproductive. Such actions may not only yield less revenue than anticipated but, in extreme cases, can lead to actual revenue losses despite the higher nominal tax rate, as economic activity shifts to more tax-friendly environments.
Sales Tax Bases: The Other Half of the Equation
While sales tax rates are frequently discussed, the sales tax base—what is actually taxed—is an equally critical, though often less understood, factor influencing revenue collection and economic impact. This report primarily ranks states based on tax rates and does not fully account for variations in tax bases, which can differ significantly across states.
- Variations in Taxable Items: States exhibit considerable diversity in defining what constitutes a taxable item. For instance, most states exempt groceries from sales tax, recognizing their essential nature and aiming to mitigate the regressive impact of sales taxes on lower-income households. Others tax groceries at a reduced rate, while some apply the standard sales tax rate to all food items. Similarly, some states exempt clothing or tax it at a reduced rate, further complicating the tax landscape.
- Ideal Sales Tax Structure: Tax experts generally advocate for sales taxes to apply broadly to all final retail sales of goods and services, while simultaneously exempting intermediate business-to-business transactions within the production chain. This "broad-based" approach aims for a "right-sized" tax system where each product is taxed once and only once throughout its journey to the final consumer. This structure minimizes economic distortions, such as "tax pyramiding" (where a tax is applied multiple times at different stages of production), which can artificially inflate prices and harm competitiveness.
- Challenges in Application: Despite theoretical agreement on an ideal structure, the practical application of most state sales taxes deviates significantly from this ideal. Many states struggle to modernize their sales tax regimes to align with evolving consumption patterns, which have increasingly shifted from goods to services. This misalignment can lead to an erosion of the tax base and an inefficient allocation of the tax burden.
- Hawaii’s Broad Base Dilemma: Hawaii presents a unique case with the broadest sales tax base in the United States. However, its General Excise Tax (GET) system, which functions like a sales tax, applies to many products multiple times throughout the production chain. By one estimate, this system ultimately taxes 119 percent of the state’s personal income, meaning the tax burden exceeds the total income, indicating significant pyramiding. This broadness, while ensuring high revenue, comes at the cost of economic efficiency and fairness, contrasting sharply with the national median where the sales tax applies to approximately 36 percent of personal income.
Modernizing sales tax regimes to better align with contemporary personal consumption patterns in a services-driven economy remains a significant challenge and opportunity for state policymakers.
Methodology for Accurate Data Collection
The data presented in this analysis relies on robust methodology to provide an accurate picture of the average local sales tax rates. Sales Tax Clearinghouse provides quarterly sales tax data at the state, county, and city levels, disaggregated by ZIP code. These raw figures are then weighted according to the most recent Census population figures. This population-weighted approach is crucial as it provides a realistic sense of the prevalence of specific sales tax rates within a given state, reflecting the rates faced by the majority of its residents. This represents a methodological refinement from previous editions that used decennial population figures, although the differences typically amount to minor rounding errors, maintaining broad comparability.
It is important to note that the Census Bureau reports population data using a five-digit identifier that resembles a ZIP code, but is technically a ZIP Code Tabulation Area (ZCTA). ZCTAs are geographical areas designed to approximate ZIP codes for statistical purposes, as many actual ZIP codes do not have resident populations (e.g., a ZIP code for a large business or a P.O. box facility). For the purpose of these calculations, ZIP codes without a corresponding ZCTA population figure are omitted. While these omissions introduce a minor degree of inexactitude, their overall effect on the resultant averages is not significant. This is because proximate ZIP code areas that do have ZCTA population numbers effectively capture the tax rate of those jurisdictions, ensuring the integrity of the weighted averages.
Outlook and Policy Implications
Sales taxes will undoubtedly continue to play a vital role in state and local fiscal health. The ongoing shifts in combined rates, particularly at the local level, underscore the dynamic nature of tax policy and the continuous balancing act faced by policymakers. The tension between the need for revenue, the desire for economic competitiveness, and the pursuit of tax fairness will continue to drive legislative debates. As economies evolve and consumer behaviors change, states will face increasing pressure to modernize their sales tax bases, moving towards broader application to services while mitigating regressive impacts and avoiding economic distortions. Understanding both the rates and the underlying tax bases is essential for informed public discourse and effective policymaking in this critical area of public finance.