

 Lana Rhoades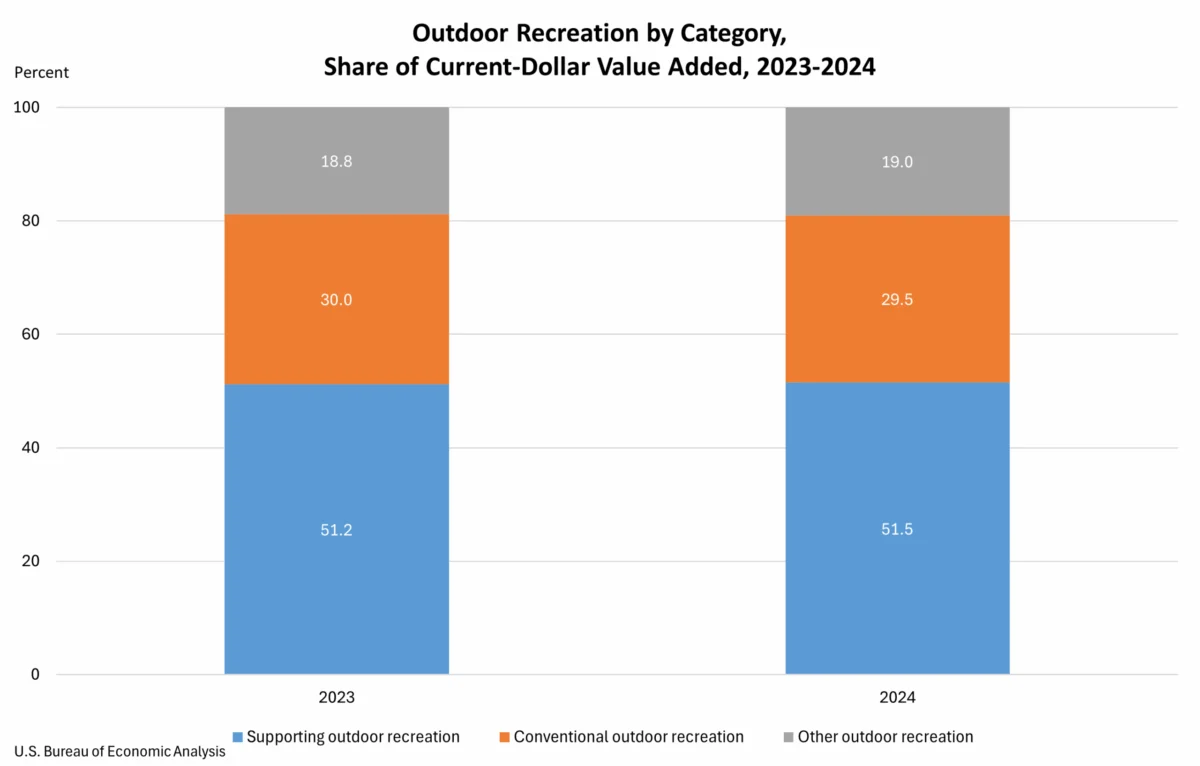
The United States Bureau of Economic Analysis (BEA) has unveiled comprehensive new data detailing the significant and evolving economic footprint of the nation’s outdoor recreation sector. For 2024, the outdoor recreation economy contributed a substantial $696.7 billion, representing 2.4 percent of the nation’s current-dollar Gross Domestic Product (GDP). This robust figure underscores the sector’s vital role in national economic output and employment. The newly released statistics, which cover all 50 states and the District of Columbia, provide an unprecedented granular view of how outdoor activities, from hiking and boating to gardening and outdoor concerts, translate into tangible economic value.
National Economic Impact and Growth Trends
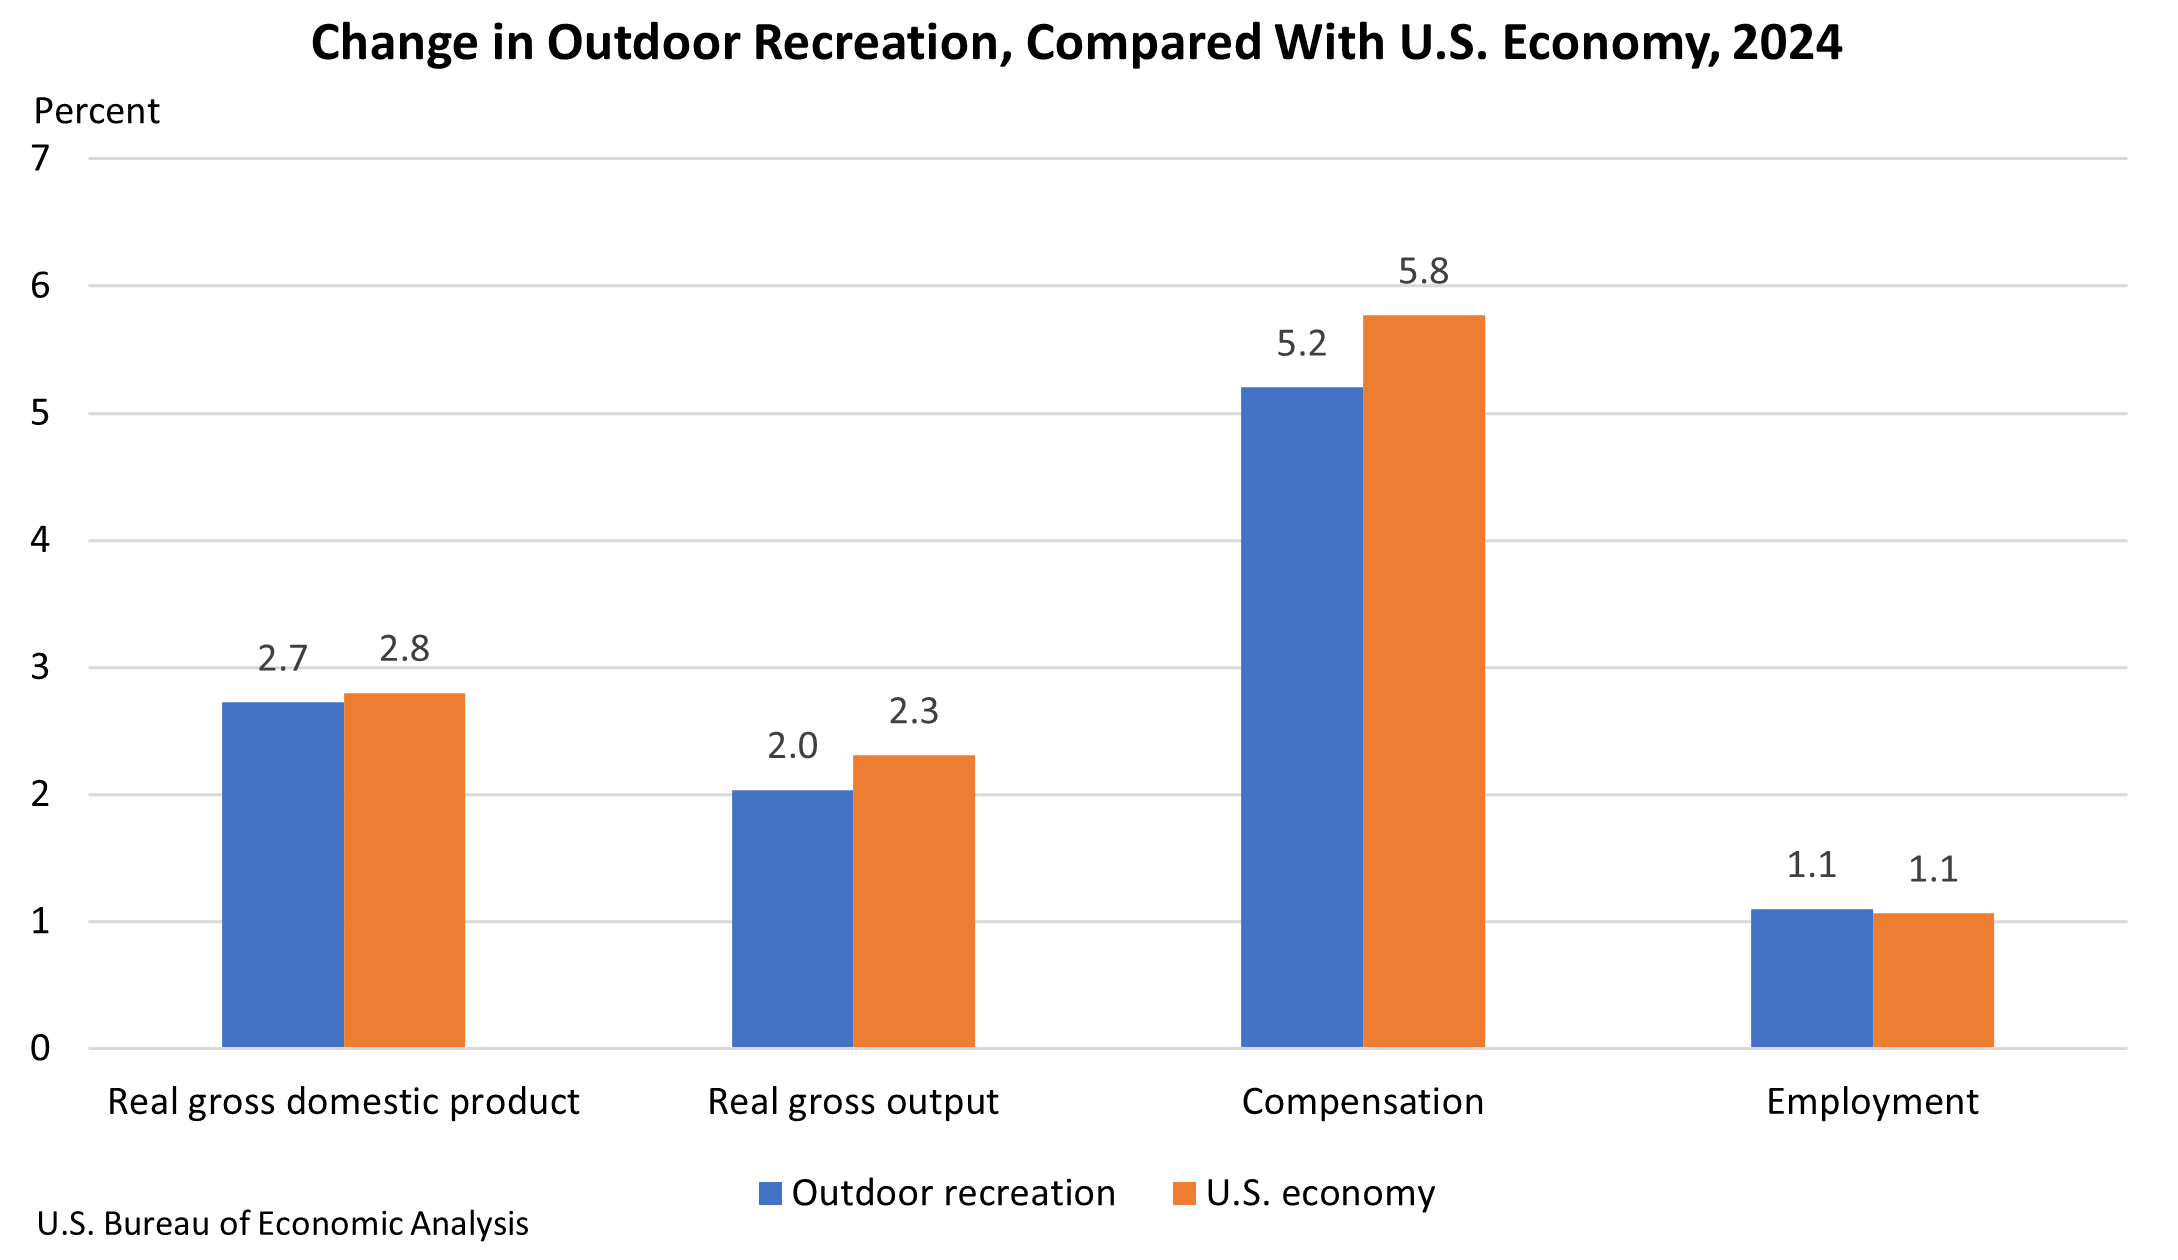
At the national level, the BEA’s report indicates that the inflation-adjusted (real) GDP for the outdoor recreation economy saw an increase of 2.7 percent in 2024. This growth, while slightly trailing the overall U.S. economy’s 2.8 percent expansion, reflects a continued upward trajectory following a more substantial 5.3 percent surge in 2023. This sustained growth highlights the sector’s inherent resilience and its ability to adapt to changing economic conditions and consumer priorities. The real gross output for the outdoor recreation economy also experienced a positive uptick, growing by 2.0 percent.
Further demonstrating the sector’s vitality, outdoor recreation compensation rose by a notable 5.2 percent, and employment within the sector increased by 1.1 percent in 2024. These figures suggest that while the pace of expansion may have moderated from the previous year, the underlying economic health of outdoor recreation remains strong, with continued job creation and increased earnings for its workforce. The BEA’s annual update of its National Economic Accounts, incorporating the latest available source data, provides a more accurate and refined picture of these economic contributions.
State-Level Performance: A Diverse Economic Landscape
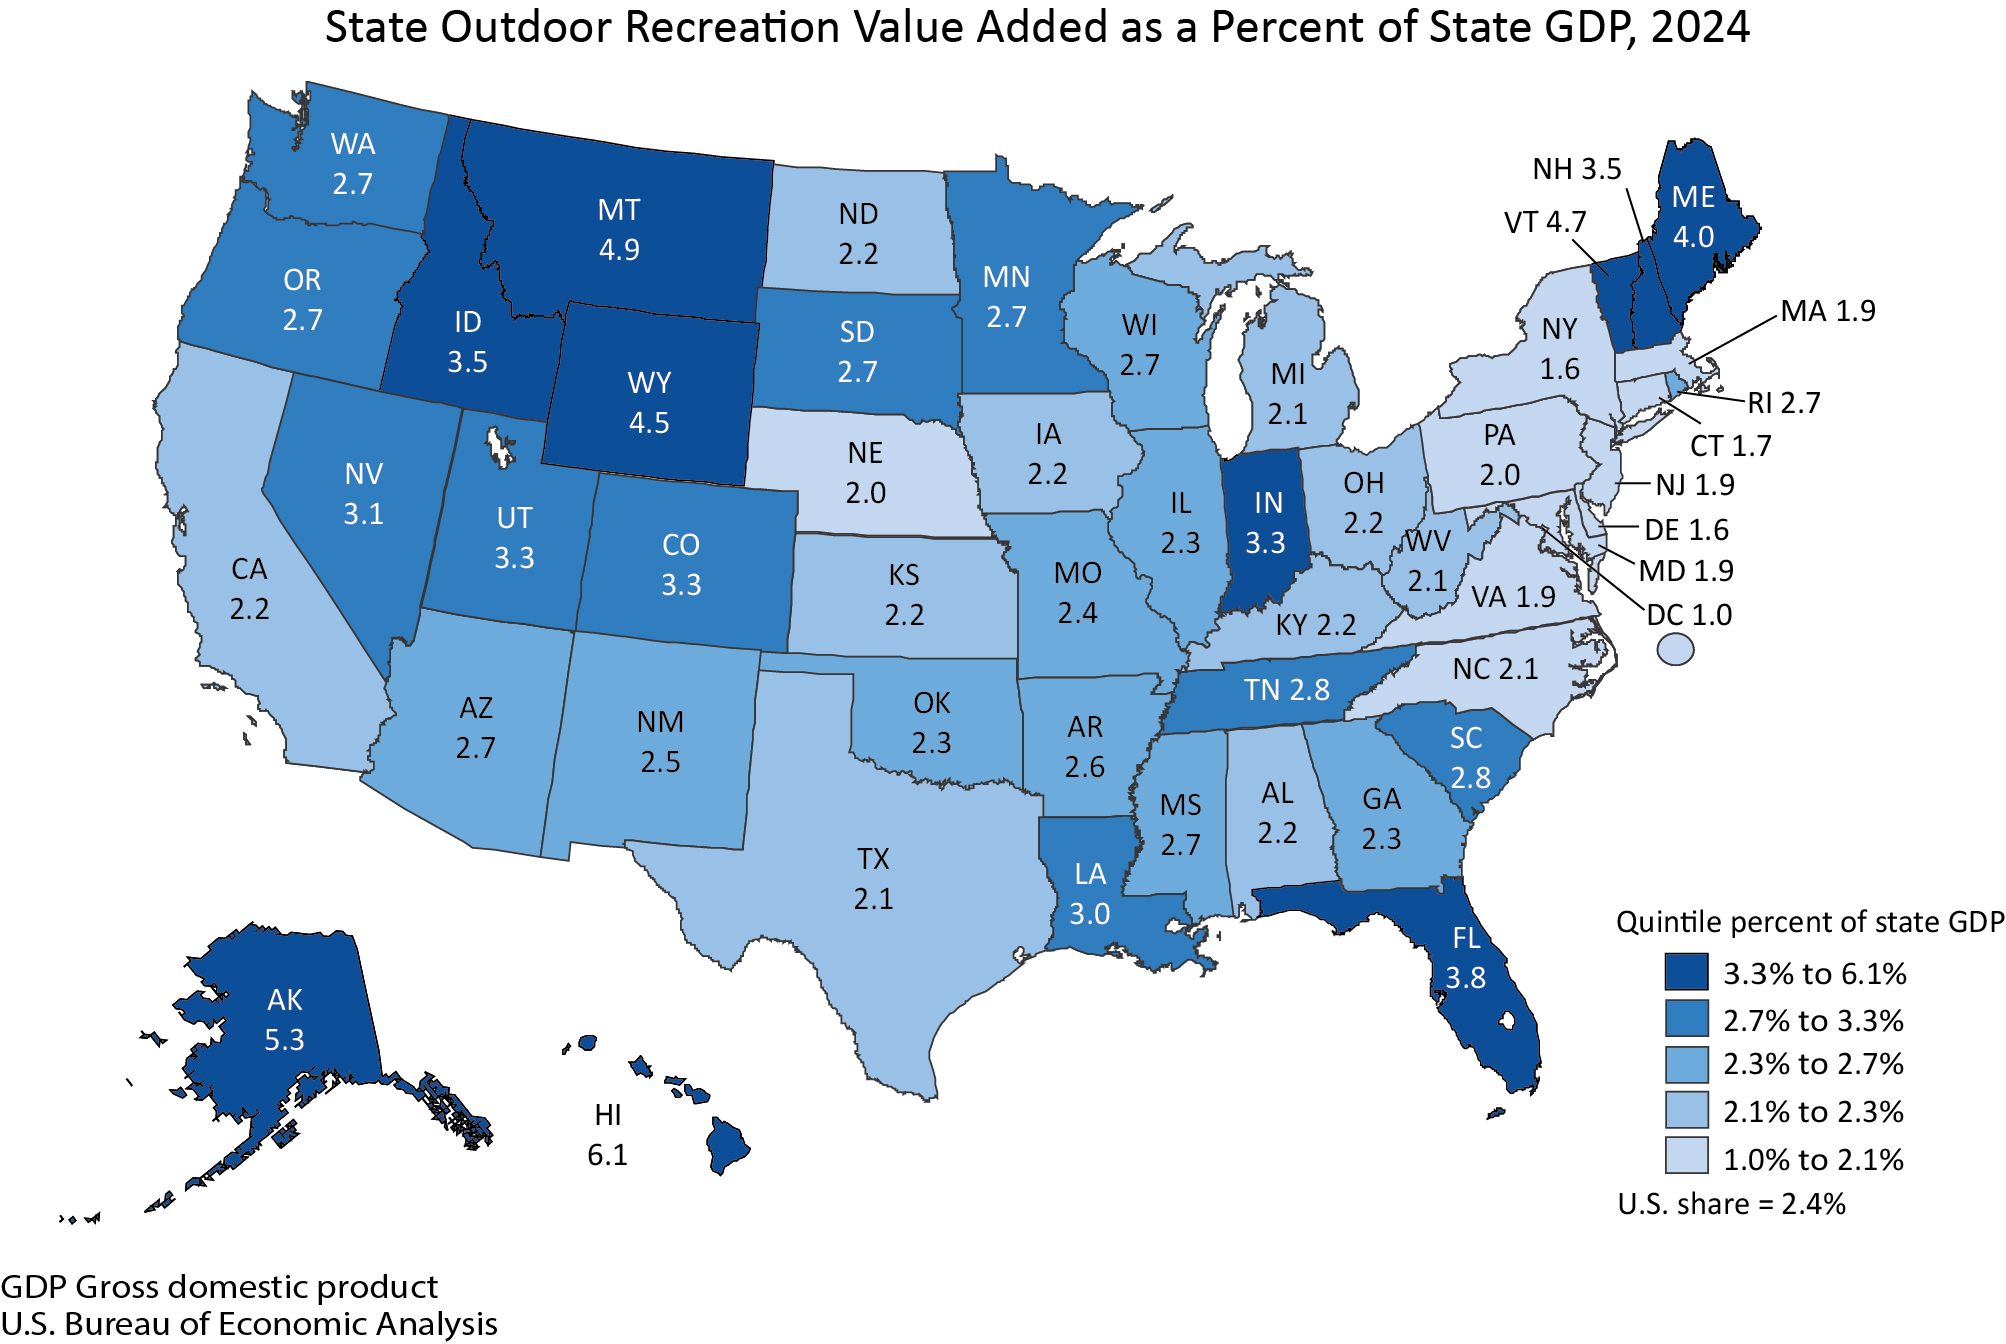
The economic impact of outdoor recreation is not uniform across the nation, with significant variations observed at the state level. Hawaii emerged as a leader, with its outdoor recreation economy accounting for a remarkable 6.1 percent of its state GDP. This strong performance is likely driven by the state’s unique natural attractions, including its beaches, hiking trails, and marine environments, which attract a significant number of tourists and support a thriving local recreation industry.
In contrast, the District of Columbia registered the lowest share at 1.0 percent of its state GDP. This disparity reflects the differing economic structures and natural resource endowments of various states and territories. The BEA’s interactive tables allow for detailed comparisons, revealing the specific contributions of outdoor recreation to each state’s economic output, a crucial metric for policymakers and industry stakeholders.
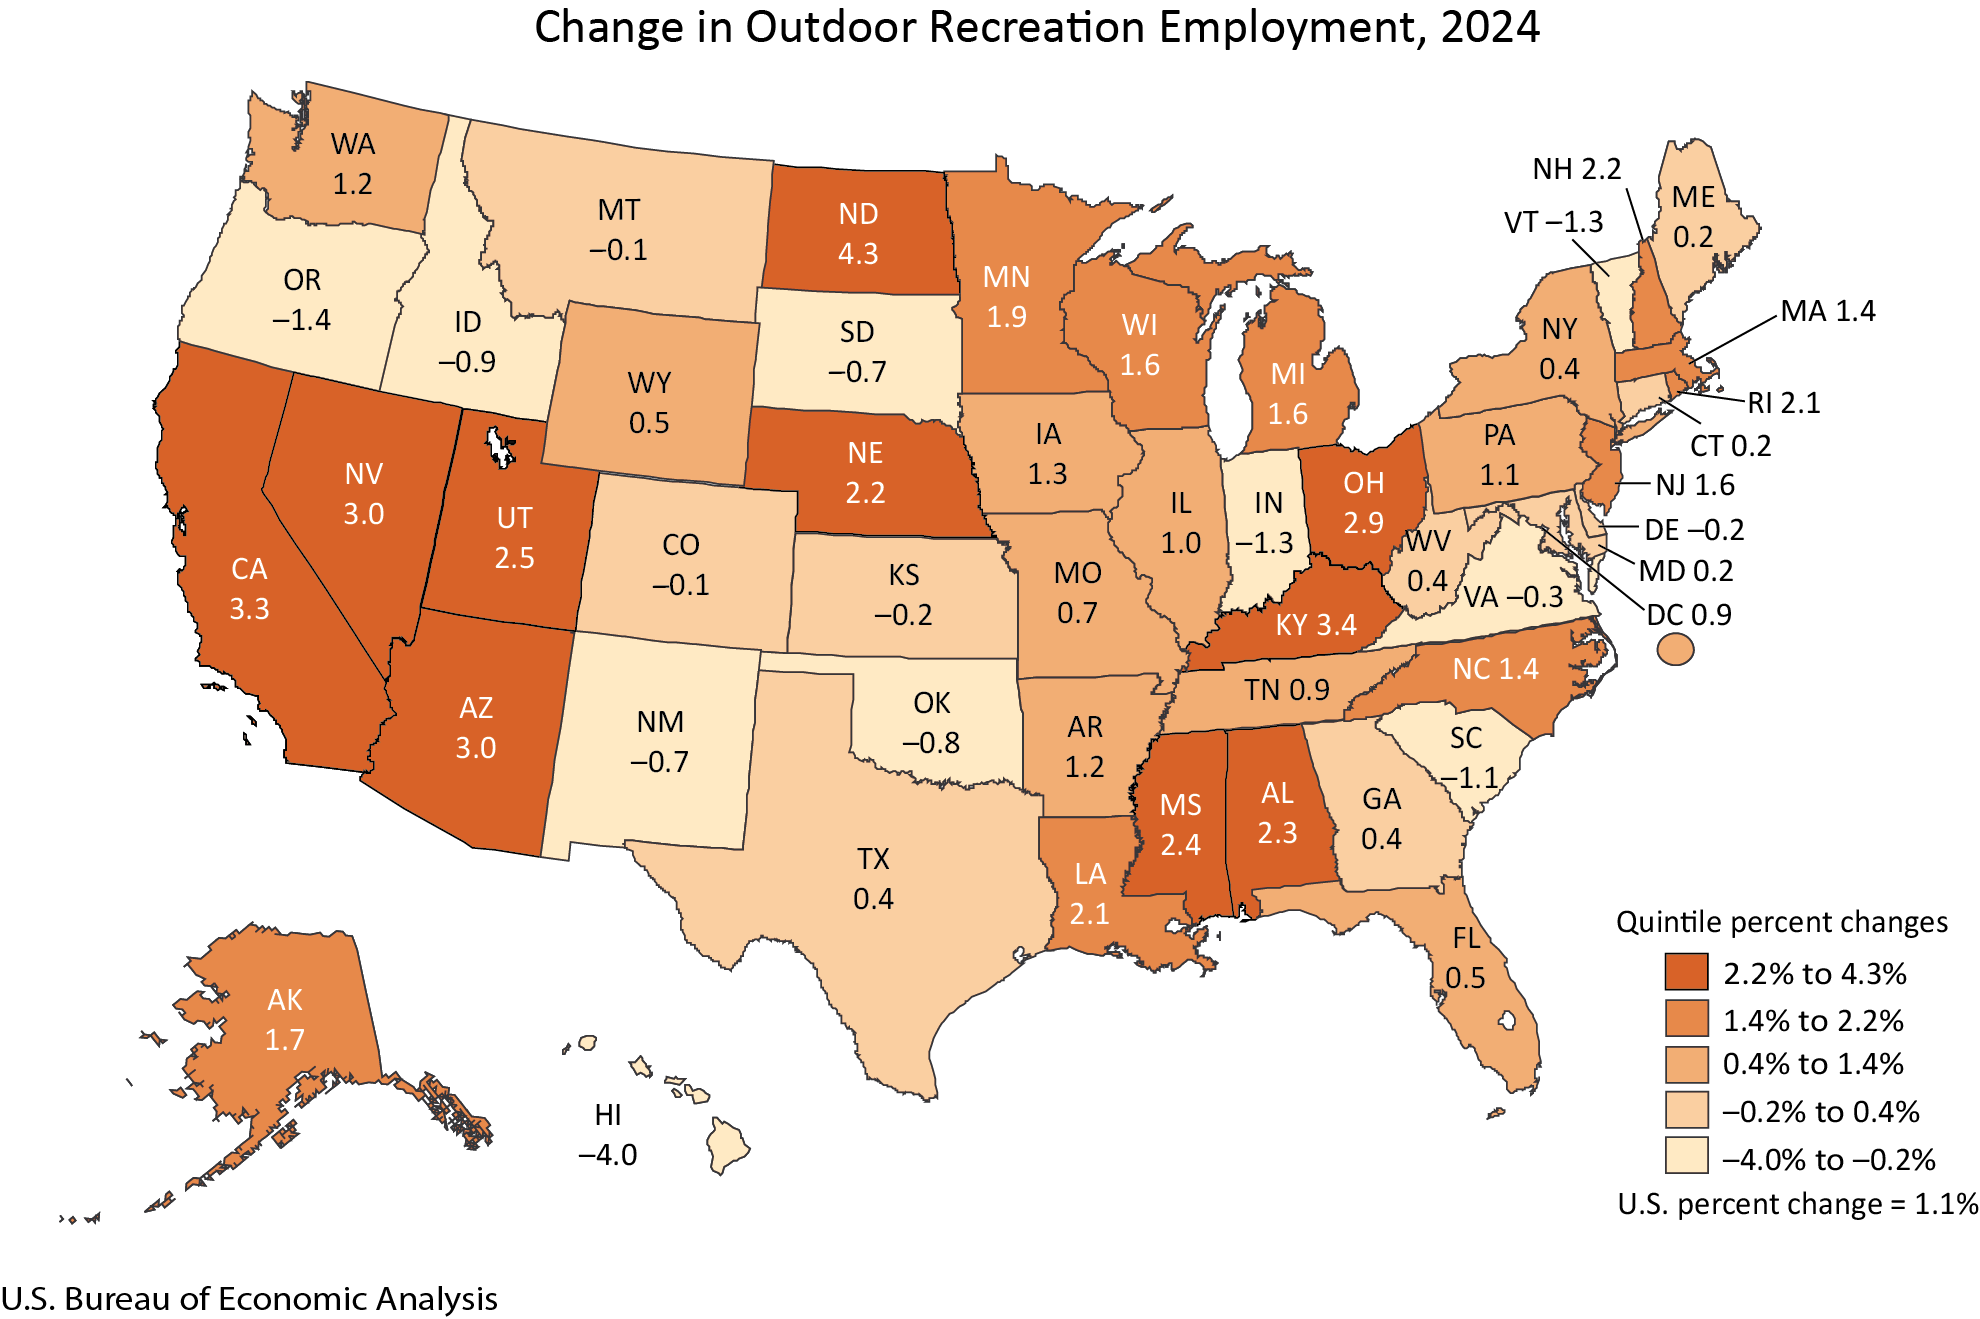
Employment trends also varied considerably across states. In 2024, outdoor recreation employment saw an increase in 36 states and the District of Columbia. North Dakota led this growth with a remarkable 4.3 percent increase in outdoor recreation employment. Conversely, Hawaii experienced a decline of 4.0 percent in its outdoor recreation workforce, a notable exception to the general upward trend. These fluctuations can be attributed to a complex interplay of factors, including local economic conditions, seasonal demands, and specific industry dynamics within each state.
Deconstructing Outdoor Recreation: Activities and Industries
The BEA categorizes outdoor recreation activities into three broad segments:
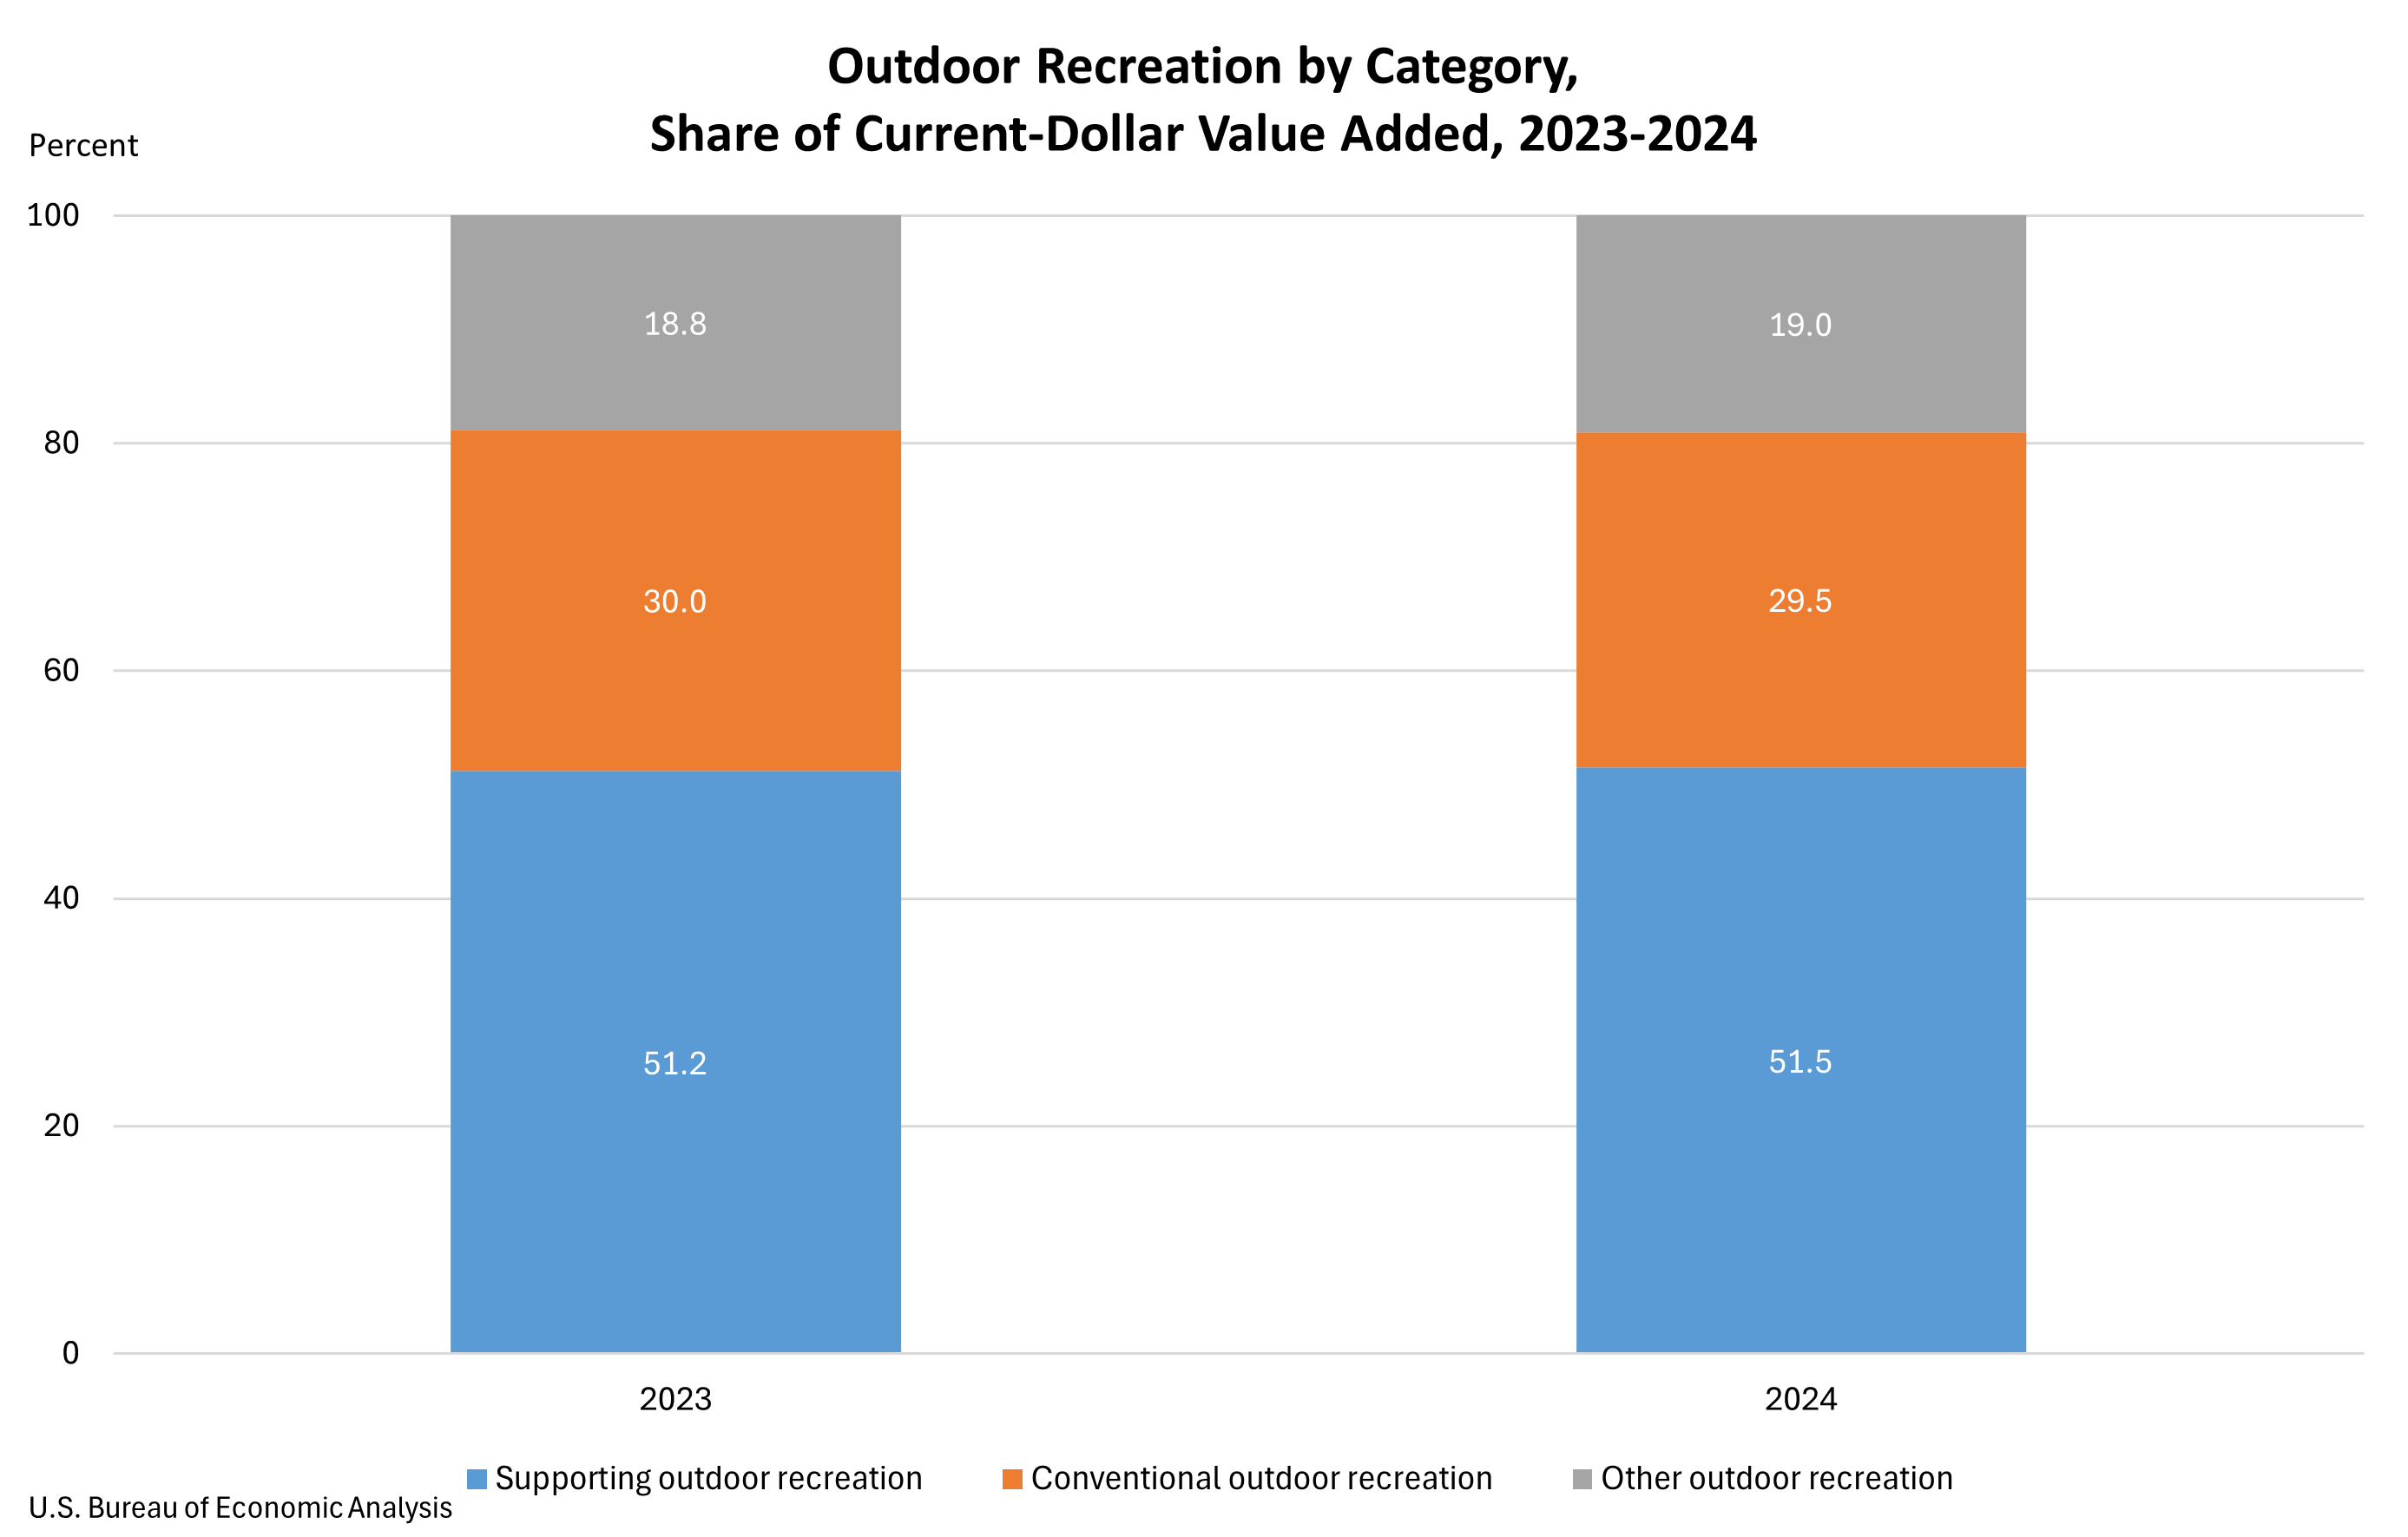
- Conventional Activities: This group encompasses traditional pursuits such as bicycling, boating, hiking, hunting, fishing, camping, and snow sports. In 2024, these activities accounted for 29.5 percent of the total U.S. outdoor recreation value added, a slight decrease from 30.0 percent in 2023.
- Other Outdoor Activities: This category includes a wider range of pursuits like gardening, outdoor concerts, festivals, and wildlife viewing. These activities represented 19.0 percent of value added in 2024, a marginal increase from 18.8 percent in the previous year.
- Supporting Activities: This broad category forms the largest segment, making up 51.5 percent of value added in 2024 (up from 51.2 percent in 2023). It includes essential elements like construction related to outdoor infrastructure, travel and tourism services (transportation, lodging, food services), local trips, and government expenditures on parks and public lands. Growth in this segment was particularly propelled by travel and tourism, fueled by increased spending on transportation, hotels, and restaurants.
This breakdown highlights the interconnectedness of the outdoor recreation ecosystem. While direct participation in activities like hiking or boating is crucial, the broader infrastructure and services that enable these experiences, such as hotels and transportation, represent a significant portion of the sector’s economic contribution. The growth in supporting activities suggests a healthy demand for the services that facilitate outdoor engagement.
Industry Contributions to the Outdoor Recreation Economy
The BEA’s analysis also provides a detailed look at the industries that drive the outdoor recreation economy. For the nation as a whole, the arts, entertainment, recreation, accommodation, and food services industry group emerged as the largest contributor to outdoor recreation value added in 2024, generating $174.4 billion, or 25.0 percent of the total. This sector is intrinsically linked to the direct provision of recreational experiences and hospitality services.
At the state level, this industry group was the leading contributor in 23 states and the District of Columbia. California, with $24.1 billion, Florida, with $22.7 billion, and New York, with $11.8 billion, recorded the highest value added from this sector, underscoring their roles as major tourist destinations and hubs for recreational activities.
The retail trade sector followed as the second-largest contributor nationally, accounting for $169.1 billion, or 24.3 percent of value added. This segment includes businesses that sell outdoor gear, apparel, and equipment. Retail trade was the dominant industry in 24 states, with California ($19.3 billion), Texas ($14.4 billion), and Florida ($13.4 billion) leading in contributions. This indicates a strong consumer demand for products that enable outdoor pursuits.
The manufacturing sector ranked third nationally, contributing $91.3 billion, or 13.1 percent of value added. This segment encompasses the production of vehicles, boats, recreational equipment, and other goods used in outdoor activities. Manufacturing was the primary industry in two states, Indiana and Louisiana. Texas ($13.1 billion), California ($11.6 billion), and Indiana ($9.1 billion) saw the largest contributions from this sector, highlighting the importance of production facilities in supporting the broader outdoor recreation economy.
Context and Evolution of Outdoor Recreation Statistics
The release of these 2024 statistics marks the latest update in the BEA’s ongoing effort to quantify the economic impact of outdoor recreation. These statistics are part of a broader initiative to provide a more comprehensive understanding of this dynamic sector. The BEA began publishing these data in 2017, responding to growing recognition of outdoor recreation’s economic significance and calls from industry and policymakers for more detailed metrics.
The methodology behind these statistics involves integrating data from various sources, including national income and product accounts, industry economic accounts, and regional economic accounts. The annual updates, such as the one incorporated into the 2024 data, reflect the BEA’s commitment to incorporating the latest available source data and refining its estimation methods. This iterative process ensures that the statistics remain as accurate and relevant as possible. The updates incorporate data from the 2025 annual update of the National Economic Accounts and newly available or revised source data, providing a more robust and current picture of economic activity. Similarly, state-level statistics are refined with the 2025 annual update of the Regional Economic Accounts and updated regional source data.
Implications and Future Outlook
The consistent growth of the outdoor recreation economy, even with moderate adjustments in its pace, signals a profound shift in consumer behavior and economic priorities. As societies increasingly value well-being, environmental stewardship, and experiential consumption, the demand for outdoor activities is likely to remain robust. The data suggests that investments in outdoor infrastructure, conservation efforts, and tourism promotion can yield significant economic returns.
For policymakers, these statistics offer a clear roadmap for economic development strategies. States with a high percentage of GDP derived from outdoor recreation can leverage this strength to attract further investment, create jobs, and enhance quality of life. Conversely, states with lower contributions may find opportunities to develop their natural assets and recreational offerings to diversify their economies.
The sector’s reliance on supporting activities, particularly travel and tourism, also underscores the importance of maintaining accessible and well-developed transportation networks, accommodation facilities, and hospitality services. The interconnectedness of these components means that growth in one area can have positive ripple effects throughout the broader economy.
The BEA’s commitment to providing annual updates ensures that stakeholders can monitor trends, adapt to changes, and make informed decisions. The next release, scheduled for Fall 2026, will provide the 2025 outdoor recreation economic statistics for the U.S. and states, offering further insights into the sector’s continued evolution. This ongoing data collection and analysis are instrumental in understanding and fostering the long-term economic vitality of outdoor recreation in the United States. The BEA’s dedication to providing detailed, up-to-date information is crucial for businesses, government agencies, and researchers alike, enabling a deeper appreciation of the economic power inherent in America’s natural landscapes and the activities they inspire.








