Lana Rhoades
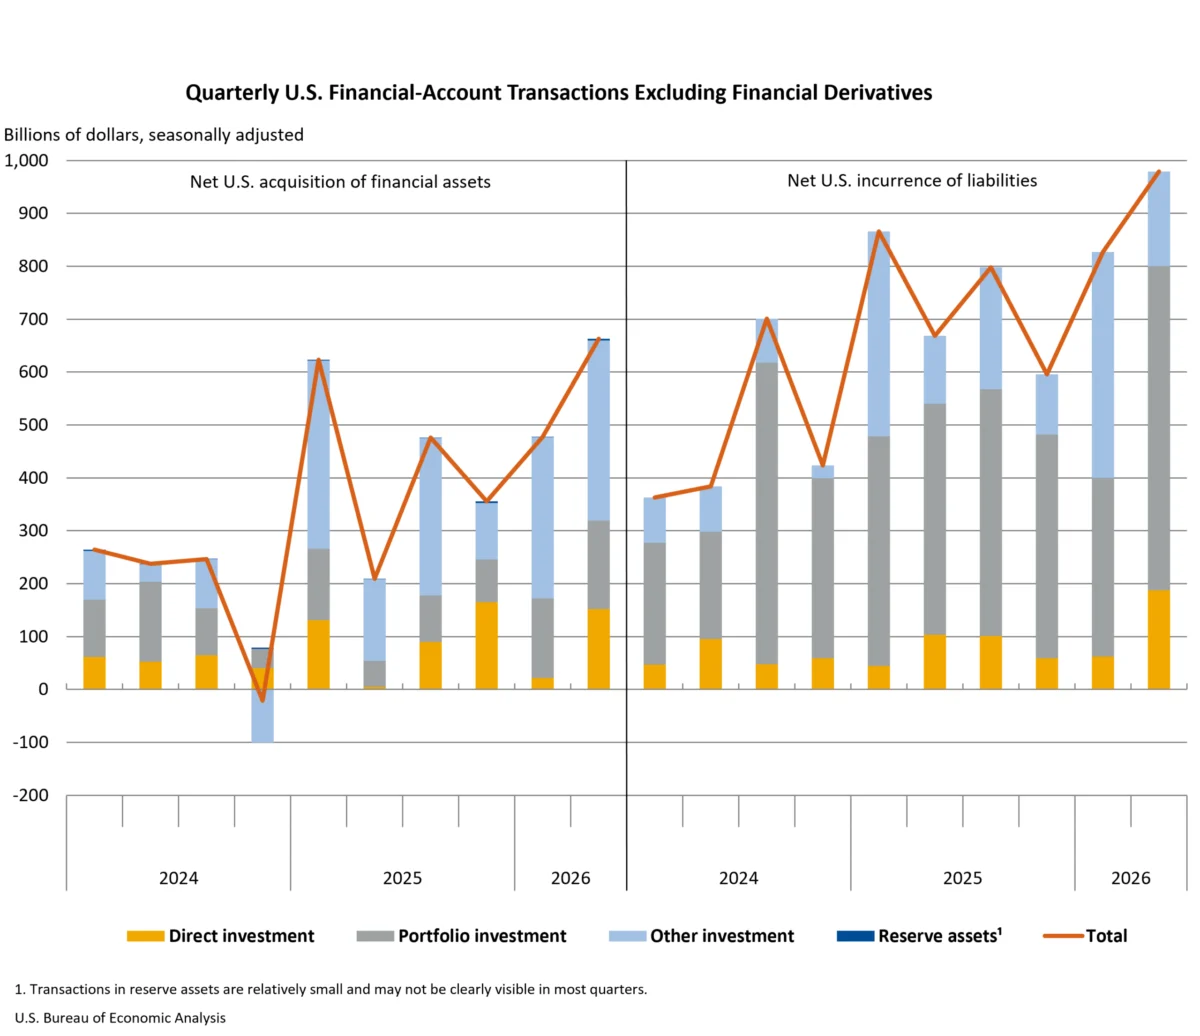
The cumulative level of U.S. direct investment abroad surged by $438.1 billion to a record $7.14 trillion by the close of 2025. Concurrently, foreign direct investment in the United States also experienced robust growth, increasing by $266.0 billion to reach $5.86 trillion. These significant shifts in global capital flows were detailed in statistics released today by the U.S. Bureau of Economic Analysis (BEA). The data provides a comprehensive snapshot of the United States’ interconnectedness with the global economy, highlighting key trends in investment destinations, sectors, and the financial performance of multinational enterprises.
Surge in Outbound U.S. Investment Driven by Europe and Manufacturing
The substantial increase in U.S. direct investment abroad was predominantly fueled by a $350.2 billion expansion in holdings within Europe. This growth was primarily concentrated in the United Kingdom and Luxembourg, underscoring their continued importance as key conduits for American capital. By industry, the manufacturing sector saw the most significant uptake in investment, with chemical manufacturing leading this charge. This suggests a strategic expansion or consolidation of production capabilities by U.S. firms in overseas markets, potentially driven by factors such as access to raw materials, skilled labor, or burgeoning consumer bases.
Historically, U.S. multinational enterprises (MNEs) have established a vast global footprint, with investments spanning nearly every nation. In 2025, however, a significant portion of this outward investment was concentrated in a select few countries. The United Kingdom stood out as the largest destination, boasting a U.S. direct investment position of $1,114.7 billion. This was closely followed by the Netherlands at $1,044.0 billion, Luxembourg at $645.3 billion, Ireland at $511.9 billion, and Canada at $488.1 billion. Collectively, these five nations accounted for more than half of the total U.S. direct investment abroad.
Analyzing the investment by the industry of the directly owned foreign affiliate reveals a notable trend. Holding companies represented the largest share of the overall U.S. direct investment position abroad in 2025, commanding 45.8 percent. Manufacturing affiliates followed, securing 15.9 percent of the total, with finance and insurance affiliates ranking third at 13.5 percent. This indicates a strategic focus on financial management and operational oversight through holding structures, alongside continued investment in tangible production and service industries.
From the perspective of the U.S. parent companies, manufacturing MNEs were the primary drivers of outbound investment, accounting for a substantial 50.2 percent of the total position. MNEs in the finance and insurance sectors followed, representing 15.8 percent. This bifurcated focus highlights the dual engines of U.S. global economic engagement: robust industrial production and sophisticated financial services.
The earnings generated from these overseas investments also reflected strong performance. U.S. MNEs reported earning $660.1 billion in income in 2025 from their cumulative direct investment abroad, marking an impressive 11.1 percent increase from the previous year. The growth in income was most pronounced in holding companies, which saw an increase of $40.0 billion. Conversely, income from finance and insurance affiliates experienced a slight decline of $6.3 billion compared to 2024, suggesting potential market fluctuations or strategic adjustments within these sectors.
Robust Inbound Investment from Europe and Germany Leads Growth
The surge in foreign direct investment (FDI) in the United States was also substantial, with a $266.0 billion increase bringing the total position to $5.86 trillion by the end of 2025. Similar to outbound investment, Europe played a pivotal role in this growth, contributing a $182.4 billion increase to the position.
Breaking down the sources of this inbound capital, German multinationals emerged as the largest contributors, with their investment position in the U.S. expanding by $49.0 billion. Canadian multinationals followed closely, registering a $39.2 billion increase. This inflow from major economic partners signals continued confidence in the U.S. market’s stability and growth potential.
By industry, the manufacturing sector within the U.S. experienced the most significant increase in foreign investment, particularly in the electrical equipment and components manufacturing sub-sector. This indicates a global demand for U.S.-manufactured goods and the underlying production capabilities.
Examining the foreign parent countries, four nations accounted for the lion’s share of FDI in the United States in 2025. Japan led the pack with an investment position of $776.3 billion. The Netherlands followed with $751.8 billion, Canada with $747.3 billion, and the United Kingdom with $738.3 billion. These countries represent key trading partners and established investors in the U.S. economy.
A deeper dive into the ultimate beneficial owner (UBO) basis reveals a more nuanced picture of global capital flows. On this basis, Japan remained the top investing country with $827.1 billion, followed by Canada ($819.8 billion) and Germany ($706.2 billion). Notably, the UBO data indicated that investment originating from the Netherlands and Luxembourg was significantly lower than reported by their respective foreign parents. This suggests that a substantial portion of capital channeled through these countries ultimately belonged to investors from other nations, highlighting the role of financial intermediaries and complex ownership structures in global investment.
The concentration of foreign investment in the U.S. manufacturing sector was particularly pronounced, accounting for 42.8 percent of the total position. Within this sector, chemical manufacturing represented a significant portion, with $835.9 billion, or one-third of the total foreign investment in U.S. manufacturing. Substantial investments were also observed in finance and insurance ($629.7 billion) and wholesale trade ($534.0 billion), reflecting the diverse economic landscape of the United States.
The income generated by foreign MNEs from their cumulative investments in the United States in 2025 totaled $310.1 billion. This figure represents a slight decrease of 1.9 percent compared to 2024, potentially reflecting varied economic conditions or sector-specific performance within the U.S. economy.
Revisiting Past Data: Revisions and Refinements
The BEA’s release also included revisions to previously published statistics for U.S. direct investment abroad and foreign direct investment in the United States for the years 2022 through 2024. These revisions are a standard part of the BEA’s statistical process, incorporating newly available and updated source data to ensure the accuracy and completeness of economic indicators. For instance, the U.S. direct investment abroad for 2023 was revised from $6,620 billion to $6,598 billion, and for 2024, from $6,827 billion to $6,698 billion. Similarly, foreign direct investment in the United States for 2023 was revised from $5,376 billion to $5,338 billion, and for 2024, from $5,708 billion to $5,598 billion. These adjustments reflect the dynamic nature of economic data collection and reporting.
Broader Economic Implications and Future Outlook
The robust growth in both outbound U.S. investment and inbound foreign investment underscores the continued globalization of capital markets and the integral role of the United States in the global economic architecture. The substantial investments flowing into U.S. manufacturing signal a potential for job creation, technological advancement, and increased domestic production capacity. Conversely, the significant outbound investment by U.S. firms points to their global competitiveness and strategic efforts to expand market reach, diversify operations, and optimize supply chains.
The strong performance in Europe for both inbound and outbound investment highlights the enduring economic ties between the U.S. and the continent. The dominance of manufacturing and finance in cross-border investment flows suggests these sectors remain critical drivers of economic growth and international cooperation.
The BEA’s commitment to providing detailed data, including breakdowns by country, industry, and ultimate beneficial owner, is crucial for policymakers, businesses, and researchers. This granular information allows for a deeper understanding of the complex web of global economic interactions, enabling more informed decision-making and strategic planning.
Looking ahead, the BEA has scheduled its next release of Direct Investment by Country and Industry data for July 2027, which will cover the 2026 statistics. This ongoing publication of comprehensive data will be vital for tracking evolving global investment trends and assessing their impact on the U.S. economy and its international partners. The continued strength and growth in direct investment positions suggest a dynamic and interconnected global economy, with the United States playing a central role in both outward and inward capital flows. The intricate patterns of investment, as revealed by the BEA’s latest figures, offer a compelling narrative of economic interdependence and strategic global engagement.