

 Lana Rhoades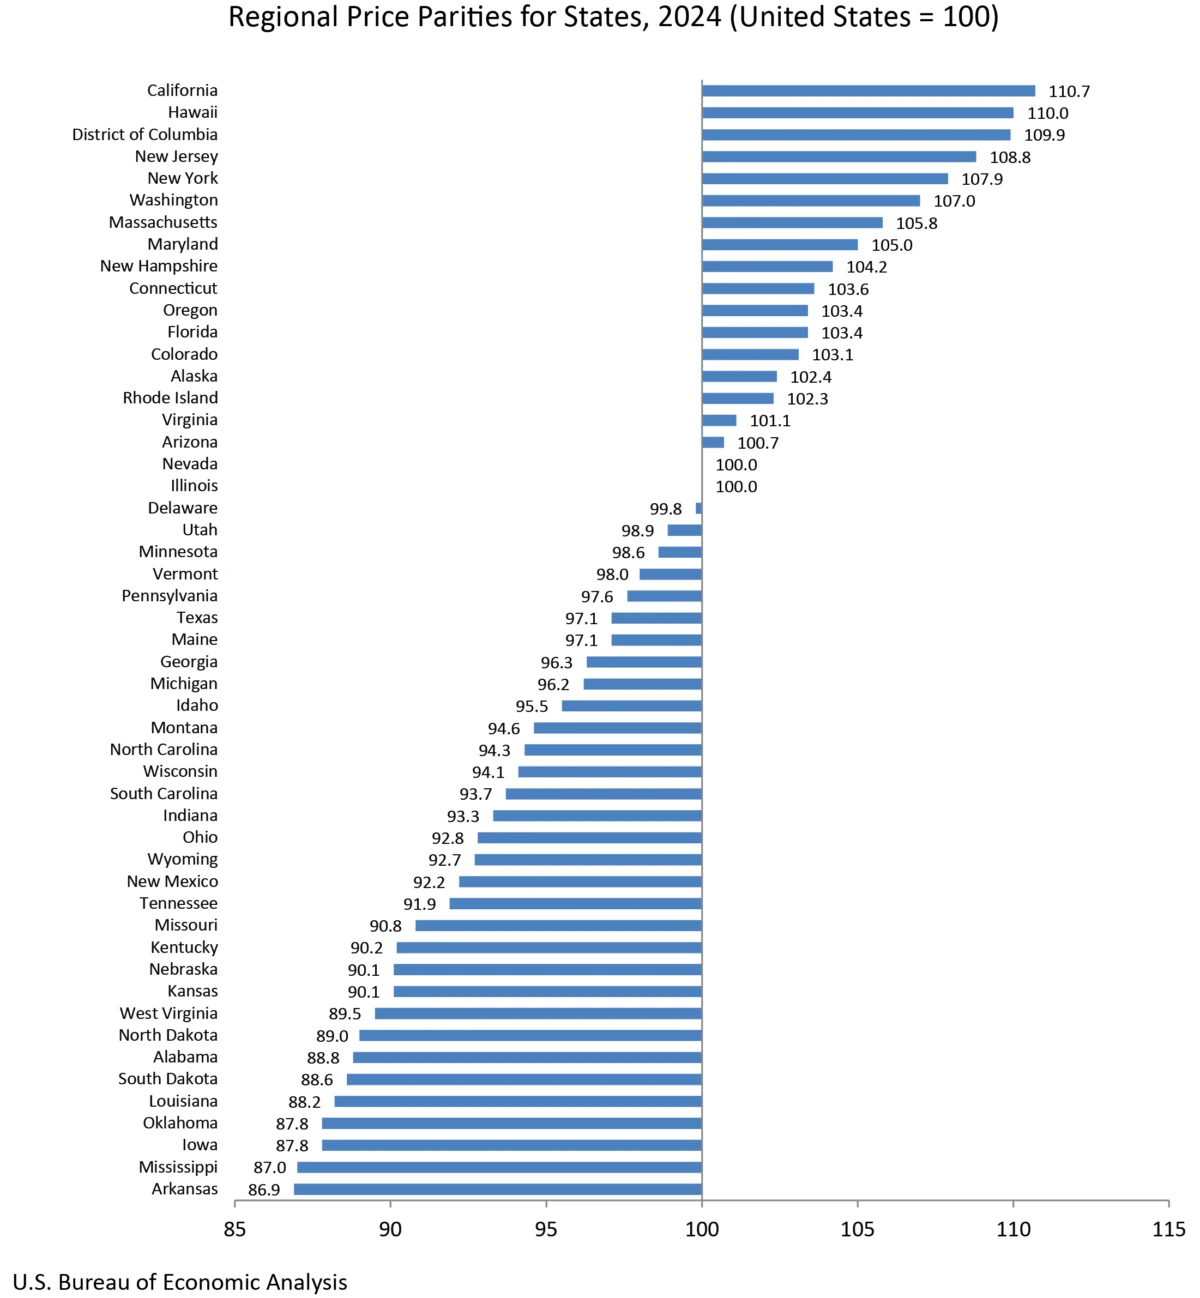
The U.S. Bureau of Economic Analysis (BEA) today unveiled its comprehensive annual statistics for 2024, offering a detailed look at real personal consumption expenditures (PCE), real personal income, and regional price parities (RPPs) across all 50 states and the District of Columbia. This release provides crucial insights into the economic health and purchasing power of Americans at the state level, with significant revisions to historical data from 2008 to 2023, reflecting the integration of more complete and detailed source information.
National Economic Landscape: A Broad Overview
Nationally, real personal consumption expenditures saw a robust increase of 2.9 percent in 2024. This growth outpaced the national PCE price index, which rose by 2.6 percent, indicating that consumer spending in real terms is expanding. Current-dollar PCE experienced a more substantial increase of 5.6 percent, highlighting the impact of inflation on nominal spending figures. Similarly, real personal income for the nation grew by 2.9 percent, aligning with the real PCE growth. Current-dollar personal income surged by 5.6 percent, again demonstrating the influence of price level changes on reported income.
These figures provide a foundational understanding of the national economic trajectory, against which state-level performance can be measured. The BEA’s methodology for calculating real PCE and real personal income involves adjusting current-dollar estimates by both the corresponding regional price parity and the national PCE price index. This dual adjustment ensures that the figures reflect both changes in the volume of goods and services consumed or earned and the relative cost of living across different regions.
Real Personal Consumption Expenditures: State-Level Dynamics
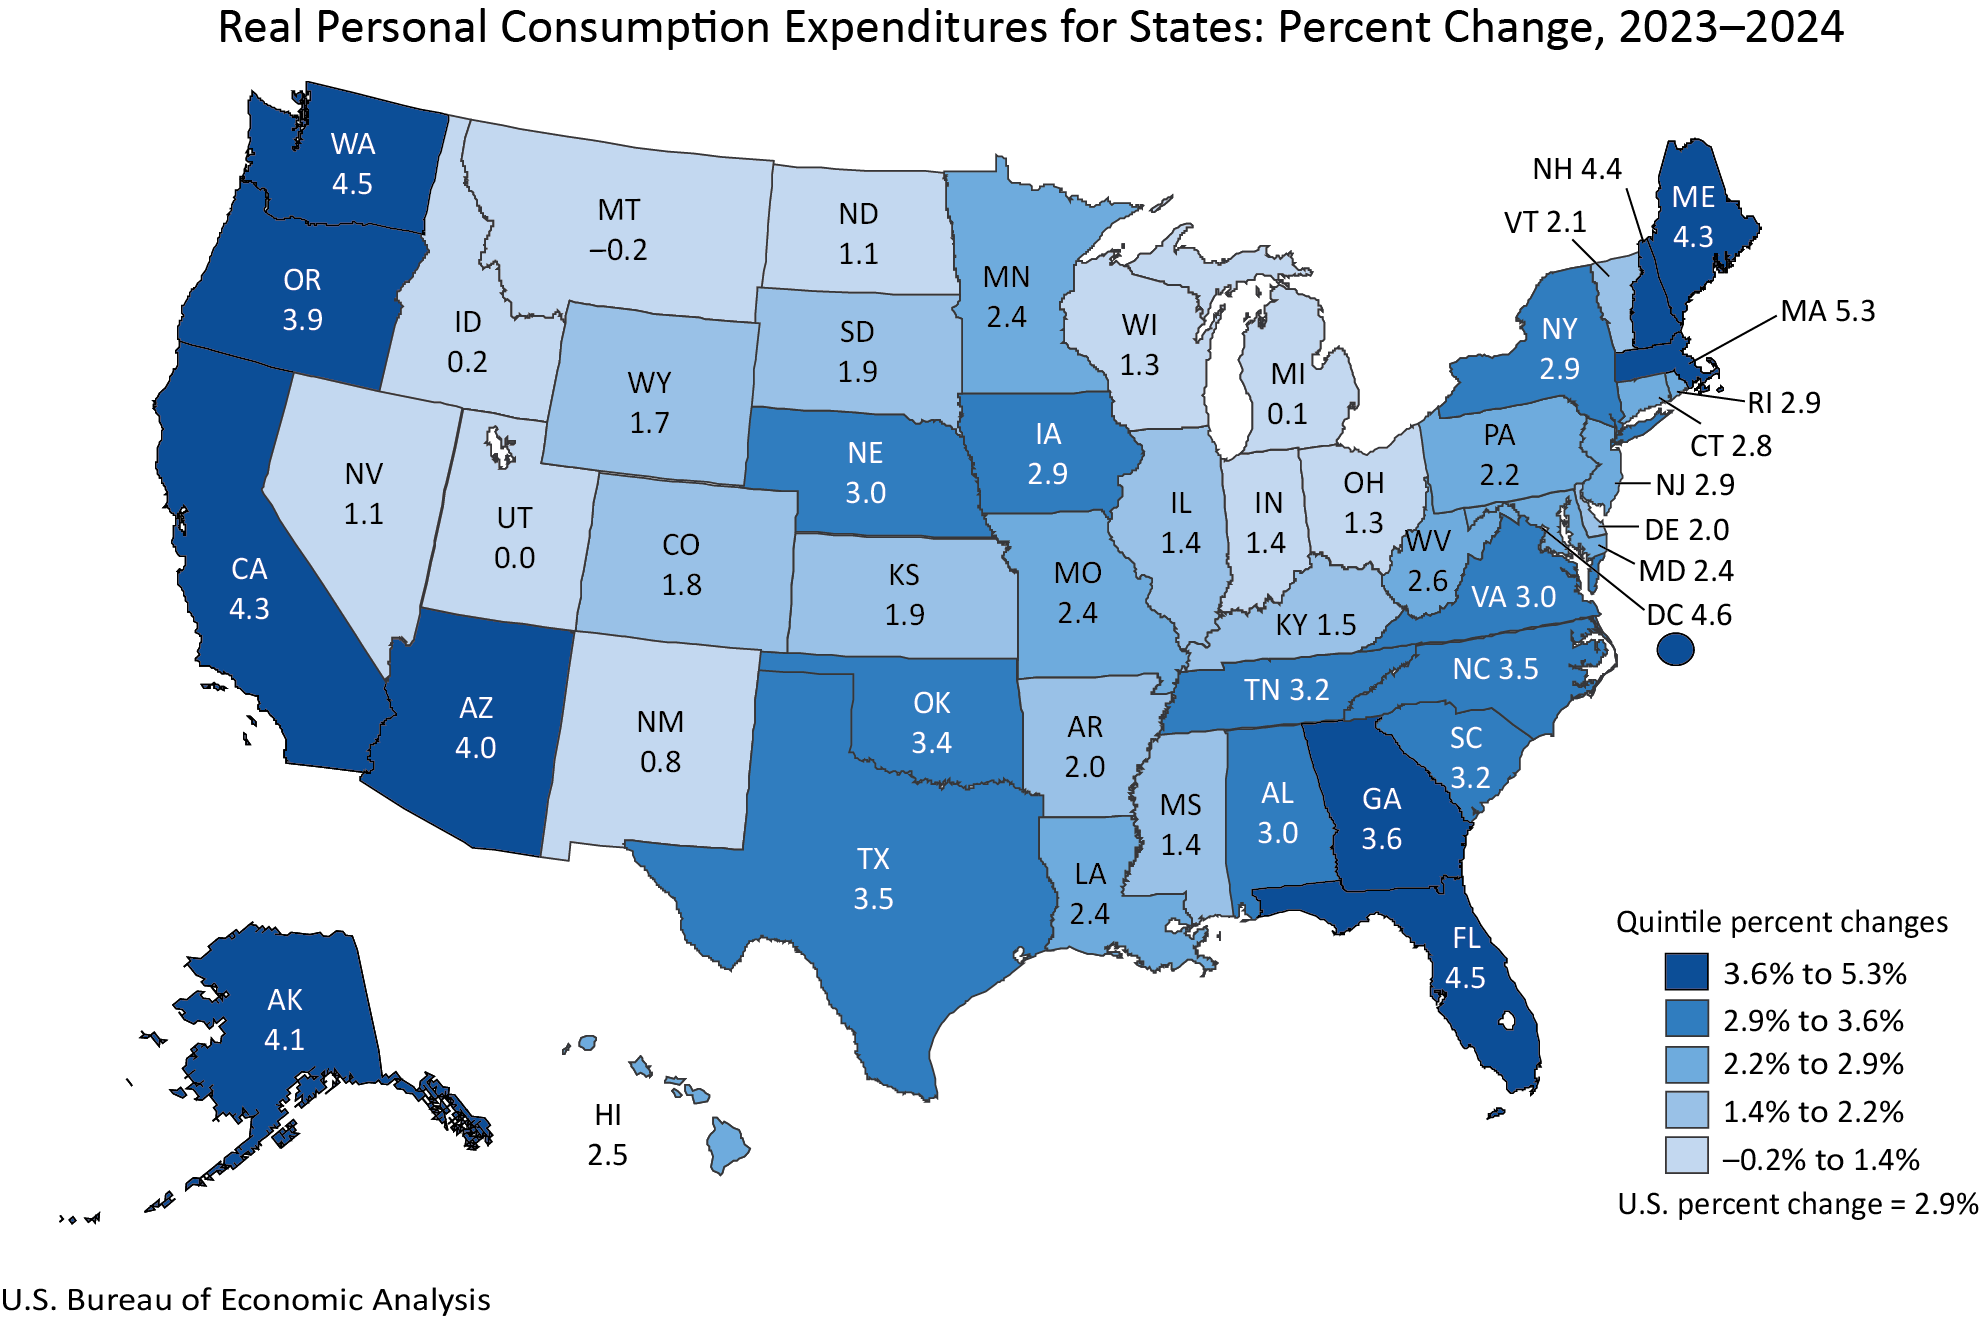
The latest data reveals a widespread increase in real personal consumption expenditures, with 48 states and the District of Columbia reporting growth in 2024. This broad-based expansion suggests a healthy consumer demand across much of the nation.
Key Highlights for Real PCE:
- Leading States: Massachusetts led the nation with a remarkable 5.3 percent increase in real PCE. This strong performance indicates robust consumer spending power and economic activity within the state.
- States with Declines: In contrast, Montana experienced a slight decrease of 0.2 percent in real PCE, marking it as one of the few states to see a contraction in consumer spending. This isolated decline warrants further investigation into the specific economic factors at play within Montana.
The varying growth rates underscore the diverse economic conditions and consumer behaviors present across the United States. Factors such as employment levels, wage growth, housing costs, and consumer confidence likely contribute to these regional disparities. The BEA’s data allows for a granular examination of these trends, enabling policymakers, businesses, and researchers to understand the localized impact of national economic forces.
Real Personal Income: A Measure of Earning Power
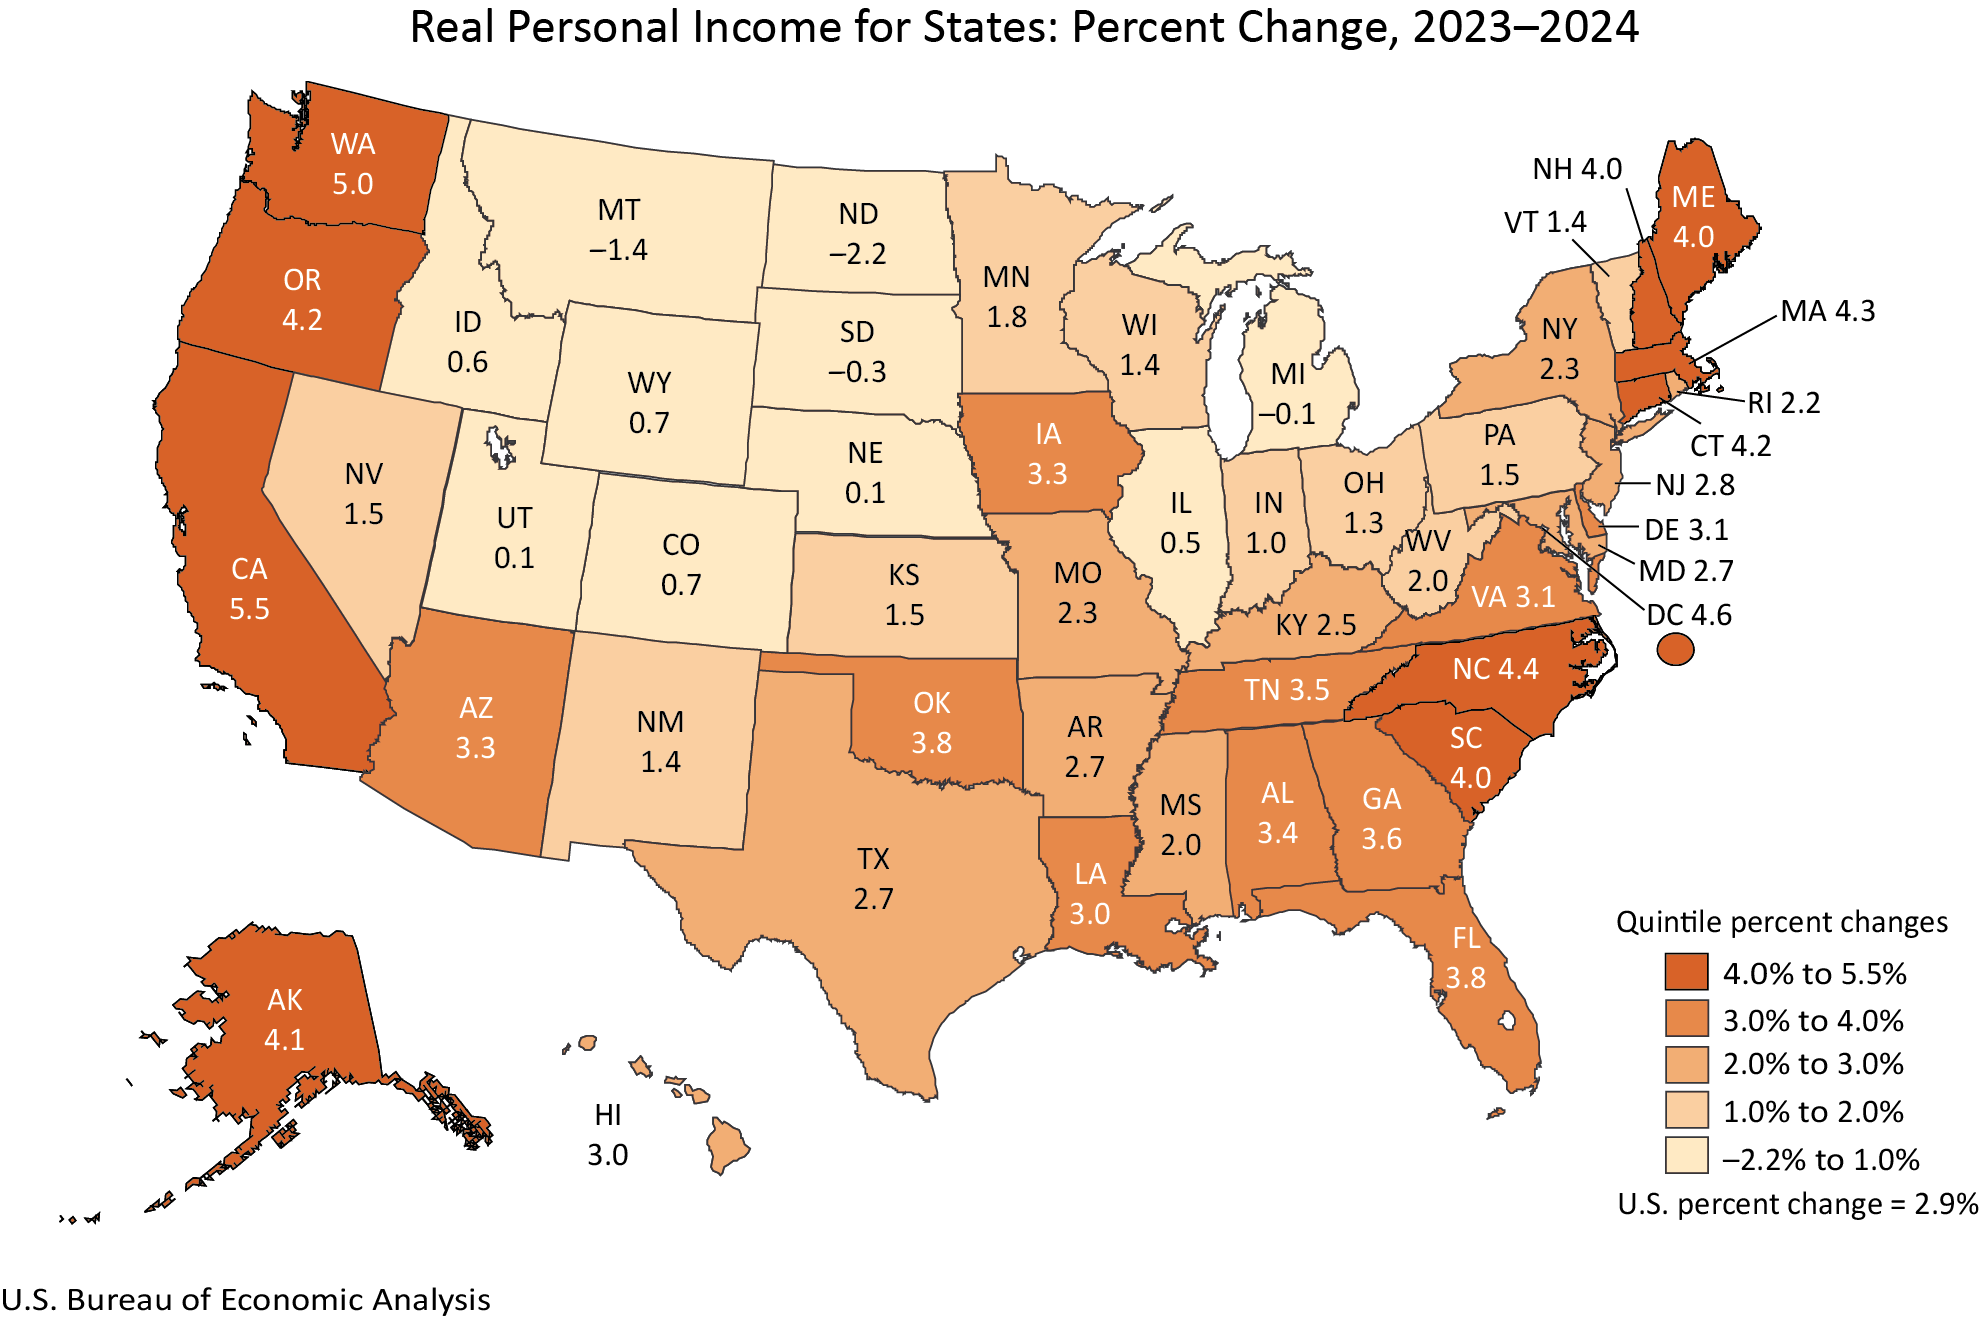
The data on real personal income paints a similarly positive picture for most of the country, with 46 states and the District of Columbia reporting an increase in real personal income in 2024. This indicates that, on average, individuals in a majority of states saw their earning power grow in real terms, after accounting for inflation.
Key Highlights for Real Personal Income:
- Strongest Growth: California recorded the highest percentage change in real personal income, with a substantial increase of 5.5 percent. This reflects significant gains in the earning capacity of its residents.
- States with Declines: North Dakota stood out with a notable decrease of 2.2 percent in real personal income. This decline suggests potential economic headwinds or shifts in income-generating activities within the state.
The correlation between real personal income and real personal consumption expenditures is a critical aspect of economic analysis. Generally, an increase in real income supports higher real consumption, as individuals have more disposable income to spend on goods and services. The BEA’s concurrent release of these two metrics allows for a direct assessment of this relationship at the state level.
Regional Price Parities: Understanding the Cost of Living
Regional Price Parities (RPPs) are a vital component of the BEA’s analysis, providing a measure of the price level differences across states. Expressed as a percentage of the national price level, RPPs help to contextualize income and spending data by revealing how far a dollar truly goes in different parts of the country.
Key Aspects of RPPs:
- Price Level Variation: RPPs illustrate the significant disparities in the cost of living throughout the United States. States with higher RPPs are generally more expensive places to live, meaning a given amount of income or spending will purchase fewer goods and services compared to states with lower RPPs.
- Drivers of RPPs: The "all items RPP," which encompasses all consumption goods and services including housing rents, is heavily influenced by housing costs. Housing rents, in particular, are often the primary driver of differences in RPPs between states. This is a crucial consideration for understanding affordability and economic well-being.
- Metropolitan Area Data: The BEA also makes metropolitan area RPP statistics available on its website, offering an even more localized perspective on price variations within states.
The interplay between income, consumption, and price levels is fundamental to assessing economic well-being. A state might show strong nominal income growth, but if its RPP is exceptionally high, the real purchasing power of that income may be diminished. Conversely, a state with lower income growth but a significantly lower RPP might offer a higher standard of living in real terms.
Updates and Revisions: Enhancing Data Accuracy
A significant aspect of this release is the extensive revision of annual estimates for real PCE by state and real personal income by state, extending from 2008 to 2023. These revisions are a testament to the BEA’s commitment to data integrity and incorporate newly available and more detailed source data. This process ensures that the historical record is as accurate and comprehensive as possible, aligning with the annual updates of the National Income and Product Accounts (NIPA) and other key economic indicators.
The revised data will be integrated into upcoming releases, including the GDP by industry statistics (released September 25, 2025) and GDP, personal income, and PCE by state statistics (released September 26, 2025). This iterative process of data collection, revision, and dissemination is standard practice for national statistical agencies aiming to provide the most reliable economic intelligence.
New Metrics and Discontinuations
This release also introduces new estimates for real per capita PCE and real per capita personal income for 2024. These per capita figures, calculated using U.S. Census Bureau population data for 2020 through 2024, offer another important lens through which to view economic well-being, normalizing economic activity by population size.
In parallel, the BEA has announced the discontinuation of publication for statistics specifically for metropolitan statistical areas and metropolitan and nonmetropolitan portions of states, beginning with the 2024 data. While real PCE and real personal income will continue to be reported at the state level, and RPPs at both state and local area levels, this change signifies a strategic shift in the BEA’s data presentation. The agency cites an FAQ for further details on this decision, indicating a focus on consolidating and streamlining data reporting.
Evolution of Data Presentation
The BEA is also implementing changes in how its data is presented. Previously embedded within news releases, detailed tables for real PCE and real personal income by state are now exclusively available through the BEA’s online Interactive Data Application. This move aims to reduce duplication, enhance efficiency, and direct users to a more dynamic and customizable data platform. The Interactive Data Application allows for the creation of tailored tables, full time series analysis, and downloads in various formats, including PDF, Excel, and CSV. This modernization of data access is intended to provide users with greater flexibility and deeper analytical capabilities.
Broader Implications and Future Outlook
The comprehensive data released by the BEA offers invaluable insights for a wide range of stakeholders. For policymakers, these statistics are critical for understanding regional economic disparities, designing targeted economic development programs, and formulating fiscal and monetary policies. Businesses can leverage this information to make informed decisions regarding investment, market expansion, and resource allocation. Researchers and academics will utilize the detailed figures to conduct further analysis on economic trends, consumer behavior, and regional development.
The consistent growth in real personal consumption expenditures and real personal income across most states in 2024 suggests a positive economic trajectory, albeit with regional variations. The RPP data serves as a crucial reminder that nominal figures alone do not tell the full story of economic well-being; the cost of living plays a significant role in actual purchasing power and quality of life.
The BEA’s commitment to revising and refining its data, alongside its efforts to modernize data presentation, ensures that it continues to be a primary source for reliable economic information. As the agency looks ahead, the next release of these key state-level economic statistics is scheduled for December 10, 2026, which will supersede the 2024 data with the 2025 figures. Until then, the comprehensive dataset released today will serve as a critical benchmark for understanding the economic landscape of the United States in 2024.
The detailed tables related to this release, including Real PCE by State (Percent Change), Implicit Regional Price Deflator (Percent Change), Real Personal Income by State (Percent Change), and RPPs by State (All Items and Services: Rents), are accessible through the BEA’s Interactive Data Application. These resources provide the granular data necessary for in-depth analysis and a thorough understanding of the economic performance and price dynamics across the nation’s states.








