

 Lana Rhoades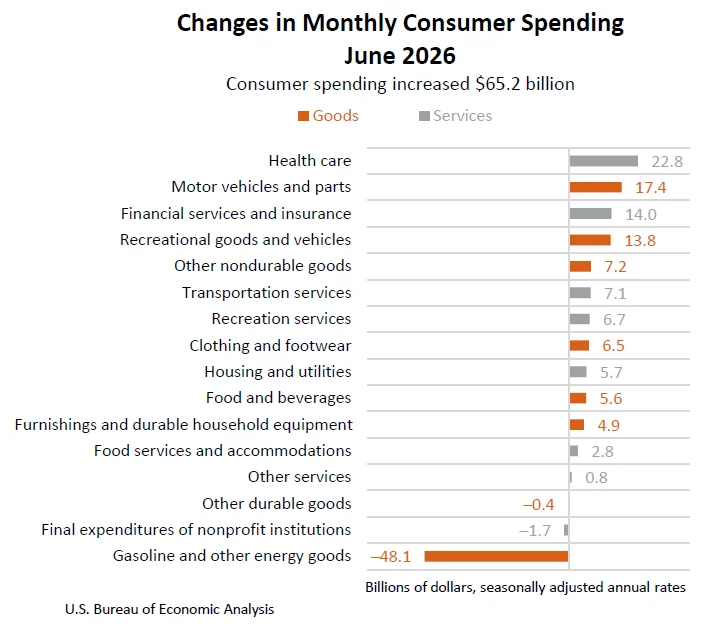
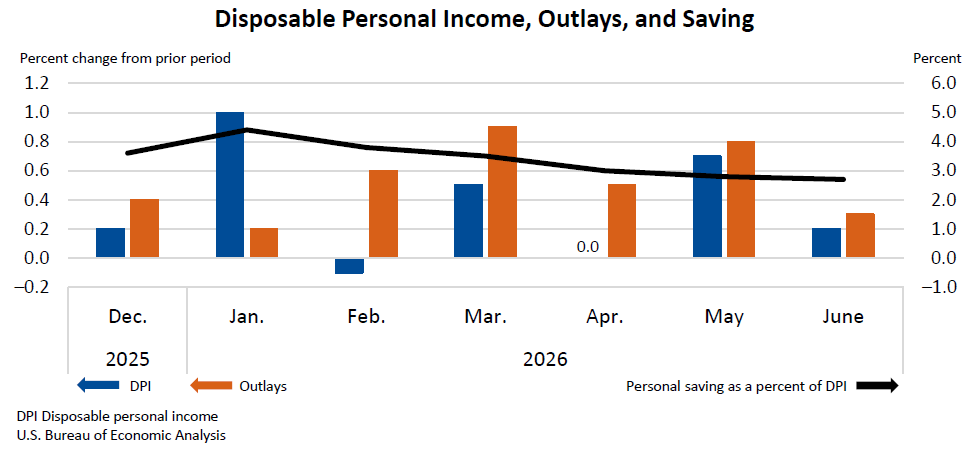
Personal income in the United States experienced a modest increase of $54.9 billion, or 0.2 percent at a monthly rate, in June, according to the latest estimates released by the U.S. Bureau of Economic Analysis (BEA). This uptick signifies a continued, albeit measured, expansion in the nation’s earning capacity. Simultaneously, disposable personal income (DPI), which represents income after taxes, rose by $48.3 billion, also a 0.2 percent increase, indicating that households had slightly more funds available for spending or saving. This growth in disposable income is a crucial indicator for consumer confidence and economic activity.
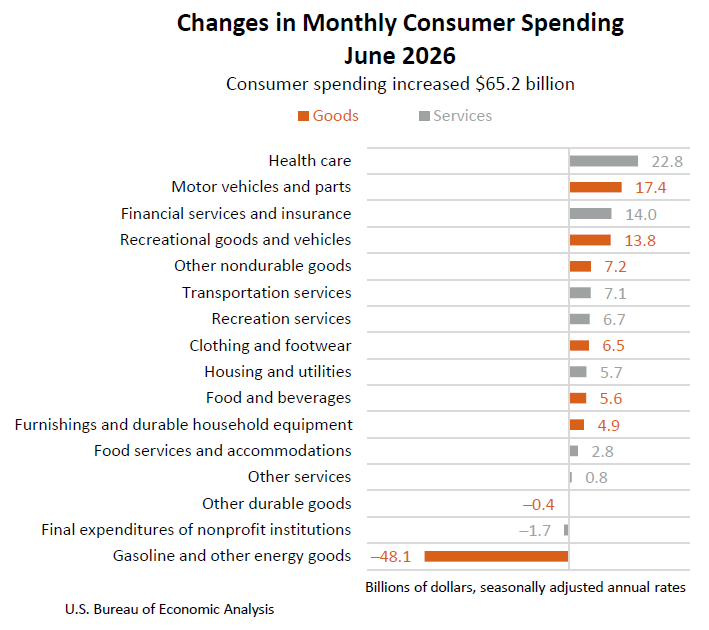
Personal consumption expenditures (PCE), a key measure of consumer spending, demonstrated a more robust expansion, climbing by $65.2 billion, or 0.3 percent. This suggests that while income growth was moderate, consumers were willing and able to increase their spending. The relationship between income, disposable income, and consumption is a cornerstone of economic analysis, providing insights into the health of the consumer-driven U.S. economy.
Understanding the Key Economic Indicators
To fully appreciate the June figures, it’s important to define the core components:
- Personal Income: This encompasses all income received by individuals from all sources. It includes wages and salaries, proprietors’ income, rental income, personal dividend income, personal interest income, and personal current transfer receipts.
- Disposable Personal Income (DPI): Calculated as personal income less personal current taxes, DPI represents the amount of income that households have available for spending or saving. Changes in DPI are closely watched as they directly impact consumer purchasing power.
- Personal Consumption Expenditures (PCE): This measures the spending by individuals and households on goods and services. It is a major component of the Gross Domestic Product (GDP) and a primary driver of economic growth.
- Personal Outlays: This is a broader category than PCE, encompassing PCE, personal interest payments, and personal current transfer payments. In June, personal outlays increased by $70.0 billion.
- Personal Saving: The difference between disposable personal income and personal outlays, personal saving reflects the portion of income that is not spent. In June, personal saving stood at $646.1 billion.
- Personal Saving Rate: This metric, calculated as personal saving as a percentage of DPI, provides insight into household financial behavior. In June, the personal saving rate was 2.7 percent, indicating a relatively low but stable level of saving compared to spending.
Drivers of Income Growth in June
The increase in current-dollar personal income during June was primarily fueled by several key sectors. Compensation, which includes wages, salaries, and benefits, saw an uptick, reflecting a generally stable labor market and potentially modest wage increases. Personal income receipts on assets, such as interest and dividends, also contributed positively, suggesting that individuals with investments benefited from market conditions or asset holdings. Furthermore, government social benefits played a role in boosting overall personal income. These benefits can include programs like Social Security, Medicare, and unemployment insurance, providing a safety net and contributing to household financial stability.
However, these positive contributions were partially offset by a decrease in farm proprietors’ income. This decline could be attributed to a variety of factors, including seasonal variations in agricultural output, commodity price fluctuations, or adverse weather conditions impacting harvests. The volatility in farm income is a recurring theme in economic reports and highlights the unique economic challenges faced by the agricultural sector.
Consumer Spending Trends: Services Lead the Way
The rise in personal consumption expenditures (PCE) in June was predominantly driven by increased spending on services. Spending on services grew by $58.2 billion, indicating that consumers continued to allocate a significant portion of their budgets to areas such as healthcare, education, transportation, and leisure activities. The robust demand for services has been a notable trend in recent economic recoveries, as consumers prioritize experiences and essential services.
Spending on goods also contributed to the overall increase in PCE, albeit to a lesser extent, rising by $7.0 billion. This suggests a more moderate pace of growth in purchases of tangible items, which can be influenced by factors such as inflation, inventory levels, and consumer confidence in the durability of economic expansion.
Real PCE Shows Steady Growth
When adjusted for inflation, real personal consumption expenditures (Real PCE) increased by $68.0 billion, or 0.4 percent, in June. This growth rate in real terms is particularly significant as it reflects an actual increase in the volume of goods and services consumed, independent of price changes. The steady rise in Real PCE underscores a sustained demand from consumers and suggests that the economy is continuing to expand at a healthy pace.
Inflationary Pressures Moderate Slightly
The Personal Consumption Expenditures (PCE) price index, a key inflation gauge closely monitored by the Federal Reserve, saw a slight decrease of 0.1 percent in June. This marginal decline offers a glimmer of hope for policymakers concerned about persistent inflationary pressures.
More significantly, when excluding the volatile categories of food and energy, the core PCE price index, which provides a clearer picture of underlying inflation trends, increased by 0.1 percent. This indicates that while headline inflation eased, price pressures in the broader economy remained somewhat elevated but showed signs of moderation.
Year-Over-Year Inflation Picture
Looking at the longer-term trend, the PCE price index for June increased by 3.7 percent compared to the same month one year ago. This year-over-year figure reflects the cumulative impact of inflation over the past twelve months. The core PCE price index, excluding food and energy, also saw an increase from the previous year, rising by 3.3 percent. While these year-over-year figures remain above the Federal Reserve’s target of 2 percent, the sequential moderation in the monthly readings suggests a potential cooling of inflationary forces.
Broader Economic Context and Implications
The June data on personal income and outlays provides a snapshot of the U.S. economy in the midst of a complex global economic environment. The modest growth in personal income suggests that while households are earning more, the pace of income accumulation is not accelerating rapidly. This could imply a more cautious approach to spending and saving among some segments of the population.
The continued strength in consumer spending, particularly in services, is a positive sign for economic resilience. It indicates that consumer demand remains a significant engine of growth. However, the widening gap between the growth in nominal PCE and the growth in real PCE highlights the ongoing impact of inflation on purchasing power. While consumers are spending more, the actual volume of goods and services they are acquiring is growing at a more moderate pace due to higher prices.
The slight decrease in the overall PCE price index, coupled with a modest increase in the core PCE price index, presents a mixed picture on inflation. Policymakers at the Federal Reserve will be closely scrutinizing these figures to determine the appropriate course of monetary policy. A sustained period of moderating inflation could lead to a reassessment of interest rate policy, potentially paving the way for rate cuts in the future. Conversely, if inflation proves to be more persistent, further tightening of monetary policy might be considered.
Revisions and Data Integrity
The BEA also announced updates to estimates for April and May, incorporating revised data from the Bureau of Labor Statistics (BLS) on the employment situation. These revisions are crucial for ensuring the accuracy and reliability of economic statistics. Specifically, revisions to government social benefits were influenced by updated data on Medicaid benefits from the Centers for Medicare & Medicaid Services, as well as new Monthly Treasury Statement data. Such refinements underscore the dynamic nature of economic data collection and the continuous efforts to improve the accuracy of these vital indicators.
Looking Ahead: Annual Updates and Future Releases
The BEA also provided an important update regarding its annual revisions of national and regional economic accounts. For the first time, the 2026 annual updates for national, industry, and regional data will be released on the same day: September 30, 2026. This synchronized release aims to improve the coherence and comparability of economic data across different sectors. The annual update of the National Economic Accounts will encompass key metrics like GDP, gross domestic income, and monthly personal income and outlays. The Regional Economic Accounts update will include GDP and personal income data at state and county levels.
The next release of Personal Income and Outlays data is scheduled for August 26, 2026, at 8:30 a.m. EDT, which will cover the data for July 2026. This upcoming release will provide further insights into the evolving economic landscape and allow for a more comprehensive assessment of the trends observed in June.
Technical Notes and Data Accessibility
For those seeking a deeper understanding of the methodology and definitions behind these statistics, the BEA provides extensive "Additional Information" resources on its website. Furthermore, detailed historical time series data for personal income and its disposition, as well as various components of PCE and price indexes, are accessible through the BEA’s Interactive Data Application. Key data tables, including those related to Personal Income and Its Disposition (Table 2.6), Percent Change From Preceding Period in Real PCE by Major Type of Product (Table 2.8.1), PCE by Major Type of Product (Table 2.8.5), Real PCE by Major Type of Product (Table 2.8.6), Percent Change From Preceding Period in Prices for PCE by Major Type of Product (Table 2.8.7), and Real PCE by Major Type of Product: Percent Change From Month One Year Ago (Table 2.8.11), are available for public access.
It is important to note that as new data is released, previously published figures are superseded. The BEA maintains a Data Archive where original data featured in past releases can be accessed, ensuring historical transparency and analytical continuity.
In conclusion, the June report on personal income and outlays paints a picture of an economy experiencing measured growth, with consumers demonstrating continued willingness to spend, particularly on services. While inflationary pressures show signs of easing, they remain a key focus for economic policymakers. The interplay between income, spending, and inflation will continue to shape the economic trajectory in the coming months, with future data releases and annual updates providing crucial context for understanding these complex dynamics.








