Lana Rhoades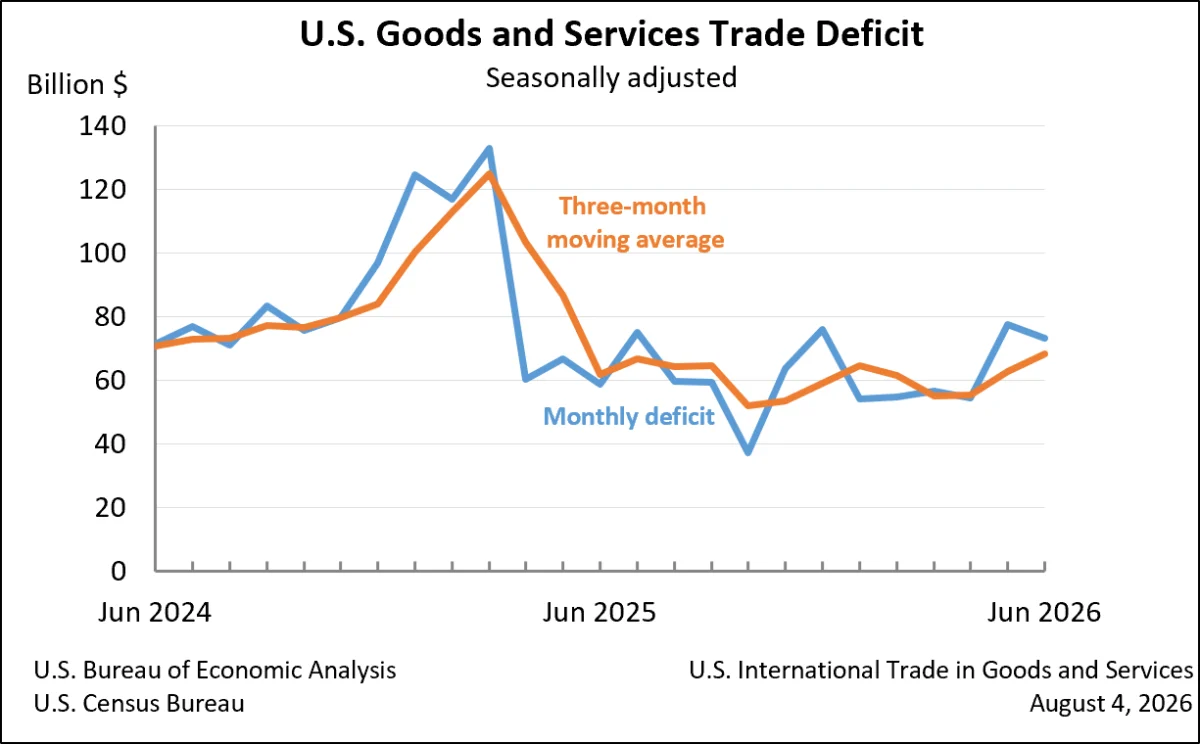
The United States recorded a goods and services deficit of $73.3 billion in June, a notable reduction of $4.4 billion from the revised May figure of $77.6 billion. This contraction, announced today by the U.S. Census Bureau and the U.S. Bureau of Economic Analysis, signals a cooling in the pace of international trade activity for the month, with both exports and imports experiencing declines. The June data offers a complex picture of the nation’s trade balance, showcasing a shrinking deficit driven by lower trade volumes, alongside persistent underlying trends in specific sectors.
Trade Dynamics: A Month of Contraction
In June, U.S. exports of goods and services totaled $314.7 billion, marking a decrease of $2.9 billion from the previous month. Imports followed a similar trajectory, falling by $7.3 billion to $388.0 billion. This synchronized decline in both inbound and outbound trade contributed to the narrowing of the overall deficit.
The reduction in the goods and services deficit was primarily propelled by a significant decrease in the goods deficit, which contracted by $3.9 billion to $102.1 billion. Concurrently, the surplus in services widened by $0.5 billion, reaching $28.8 billion. This dichotomy between goods and services trade highlights the varying economic forces at play in each sector.
Goods Trade: A Declining Balance
The deficit in goods, a perennial concern for U.S. trade policymakers, saw a substantial improvement in June. The goods deficit decreased to $102.1 billion, down from $106.0 billion in May. This improvement was a direct consequence of a $7.9 billion decrease in goods imports, which reached $309.0 billion. Goods exports also declined, falling by $4.0 billion to $206.9 billion.
On a "Census basis," which provides a more granular view of trade flows before certain adjustments, goods imports decreased by $7.7 billion, and goods exports fell by $3.8 billion. Net balance of payments adjustments, which account for various international transactions, also saw a slight decrease of $0.2 billion for both exports and imports.
The real goods deficit, adjusted for inflation and measured in 2017 dollars, also showed a marked decrease. It shrank by $5.3 billion, or 5.3 percent, to $94.5 billion in June. This real decline was more pronounced than the 3.7 percent decrease observed in the nominal goods deficit, suggesting that price effects played a role in the overall trade picture, but the underlying volume of goods traded also contributed to the improvement.
Services Trade: A Growing Surplus
In contrast to the goods sector, the U.S. services sector continued to demonstrate strength, contributing to the overall reduction in the trade deficit. The surplus in services grew to $28.8 billion in June, an increase of $0.5 billion from May. This expansion was fueled by a $1.1 billion rise in services exports, reaching $107.8 billion, while services imports also saw a modest increase of $0.6 billion, totaling $79.0 billion.
The continued growth in the services surplus underscores the United States’ competitive advantage in areas such as financial services, intellectual property, tourism, and business services. This sector has become increasingly vital to the U.S. economy, offering a counterbalance to the persistent deficits in manufactured goods.
Year-to-Date Performance: A Significant Shift
Looking at the broader economic picture, the year-to-date figures for the goods and services deficit present a more optimistic trend. From January to June, the deficit has decreased by an impressive $189.3 billion, or 33.8 percent, compared to the same period in the previous year. This substantial reduction is a testament to robust export growth and more moderate import increases.
Year-to-date exports have surged by $198.3 billion, or 11.7 percent, indicating strong global demand for American products and services. In contrast, imports have seen a more restrained increase of $9.0 billion, or 0.4 percent, over the same period. This divergence in growth rates has been a key driver in shrinking the overall trade imbalance.
Three-Month Moving Averages: A Softer Trend
While the monthly figures for June showed a narrowing deficit, the three-month moving averages paint a slightly different, and perhaps more nuanced, picture of recent trade trends. The average goods and services deficit for the three months ending in June increased by $5.6 billion to $68.5 billion. This uptick suggests that the June contraction might represent a temporary lull rather than a sustained deceleration in trade deficits.
Furthermore, when compared to the same period in the previous year, the average goods and services deficit for the three months ending in June also increased, by $6.6 billion. This year-over-year increase in the moving average deficit highlights ongoing challenges in managing the nation’s trade balance over a slightly longer horizon.
Trade Balances with Key Partners
The monthly data also provides insights into the U.S. trade relationships with various countries and regions. In June, the United States recorded trade surpluses with several key partners, including:
- Netherlands ($7.2 billion)
- South and Central America ($5.6 billion)
- Hong Kong ($3.2 billion)
- Switzerland ($2.9 billion)
- United Kingdom ($2.2 billion)
- Singapore ($1.8 billion)
- Saudi Arabia ($1.8 billion)
- Brazil ($1.7 billion)
- Australia ($1.3 billion)
- Belgium ($0.9 billion)
Conversely, significant trade deficits were observed with other major trading partners, underscoring the uneven nature of global trade flows:
- Vietnam ($21.6 billion)
- Mexico ($20.3 billion)
- China ($15.3 billion)
- Taiwan ($14.9 billion)
- European Union ($10.9 billion)
- South Korea ($7.4 billion)
- Canada ($7.2 billion)
- Germany ($7.1 billion)
- India ($4.5 billion)
- Malaysia ($4.4 billion)
- Japan ($3.3 billion)
- Ireland ($2.7 billion)
- Italy ($2.5 billion)
- France ($1.5 billion)
- Israel ($1.2 billion)
The persistent deficits with countries like China, Vietnam, and Mexico, alongside the significant surpluses with European and South American nations, illustrate the complex web of global supply chains and differing economic structures that shape U.S. trade.
Context and Potential Implications
The June trade data arrives against a backdrop of evolving global economic conditions. Inflationary pressures, shifts in consumer demand, and geopolitical uncertainties continue to influence international trade patterns. The decrease in both exports and imports in June could be attributed to a combination of factors, including moderating global economic growth, currency fluctuations, and potential supply chain adjustments.
The narrowing of the goods deficit, while positive in the short term, does not necessarily signal a fundamental resolution of long-standing trade imbalances. The United States continues to rely heavily on imports for a wide range of manufactured goods, a dependency that has been a subject of ongoing policy debate.
The strength of the services sector, however, provides a more encouraging narrative. The consistent growth in the services surplus highlights the increasing importance of this sector to the U.S. economy and its potential to offset deficits in goods. Policymakers may look to further foster growth in services exports as a strategy to improve the overall trade balance.
The divergence between the monthly figures and the three-month moving averages suggests that analysts and market participants should monitor future releases closely. A sustained trend of narrowing deficits would be a more definitive indicator of positive trade momentum, whereas a return to wider deficits would suggest that the June contraction was a temporary anomaly.
Expert Commentary (Inferred)
While no direct quotes were provided in the original data, economic analysts would likely offer varied interpretations. Some might view the June contraction as a positive sign of rebalancing, driven by robust export performance in certain sectors and moderating import demand. They might point to the year-to-date figures as evidence of a positive underlying trend.
Others, however, might express caution, highlighting the increase in the three-month moving averages as an indication that underlying pressures contributing to trade deficits remain. They might also draw attention to the persistent deficits with key trading partners as areas requiring continued attention. The influence of global economic slowdowns on both exports and imports would also be a key area of discussion.
Looking Ahead
The next release of U.S. International Trade in Goods and Services data is scheduled for September 3, 2026, covering the trade figures for July 2026. This upcoming report will provide crucial insights into whether the trends observed in June were a fleeting moment or the beginning of a more sustained shift in the U.S. trade balance. As the global economy navigates ongoing challenges and opportunities, the trajectory of U.S. international trade will remain a critical indicator of economic health and competitiveness.
The detailed statistics, including not seasonally adjusted figures and breakdowns of goods on a Census basis, are available in exhibits 1-20b of the full release. For comprehensive information on data sources, definitions, and revision procedures, interested parties are directed to the explanatory notes within the official report. The complete release can be accessed through the websites of the U.S. Census Bureau and the U.S. Bureau of Economic Analysis.