Lana Rhoades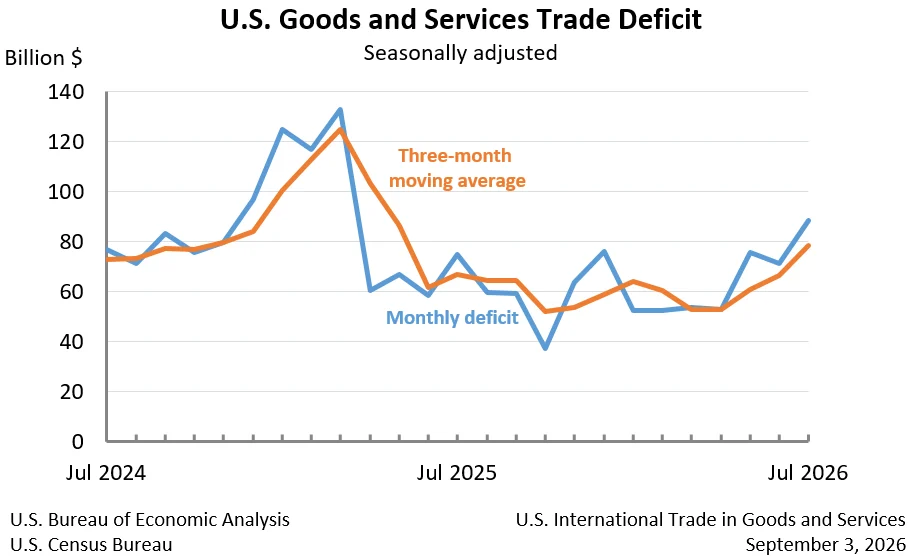
The United States experienced a significant widening of its goods and services trade deficit in July, with the shortfall reaching $88.6 billion. This represents a substantial increase of $17.4 billion from the revised $71.2 billion deficit recorded in June. The latest figures, released jointly by the U.S. Census Bureau and the U.S. Bureau of Economic Analysis, indicate a divergence in trade flows, with imports surging while exports experienced a decline.
July Trade Performance: A Deep Dive
In July, U.S. exports of goods and services totaled $310.7 billion, marking a decrease of $6.6 billion from the previous month. This decline was primarily attributed to a $6.2 billion drop in goods exports, which fell to $201.0 billion. Exports of services also saw a modest decrease of $0.4 billion, settling at $109.7 billion.
Conversely, imports of goods and services rose to $399.3 billion, an increase of $10.8 billion from June. The surge in imports was predominantly driven by goods, which climbed by $11.4 billion to $320.6 billion. Imports of services, however, experienced a slight decrease of $0.6 billion, reaching $78.7 billion.
The overall increase in the goods and services deficit was amplified by a $17.6 billion expansion of the goods deficit, pushing it to $119.6 billion. While the services sector maintained a surplus, it saw a marginal increase of $0.2 billion, bringing its contribution to $31.0 billion.
Analyzing the Trends: Shifting Trade Dynamics
The July data paints a picture of evolving trade dynamics, where rising import costs and falling export values are contributing to a widening trade imbalance. The increase in the nominal goods deficit was particularly pronounced, escalating by 17.7 percent. When adjusted for inflation, the real goods deficit (in 2017 dollars on a Census basis) also saw a substantial increase of $12.0 billion, or 12.7 percent, to $106.4 billion. This suggests that the widening deficit is not solely a reflection of price changes but also a reflection of shifts in the volume of goods traded.
The decrease in goods exports can be partly attributed to several factors, including potential softening global demand for U.S. products and ongoing supply chain adjustments. On the import side, the rise could be influenced by increased domestic demand, favorable exchange rates for foreign goods, or a replenishment of inventories.
Year-to-Date Performance: A More Nuanced Picture
Despite the concerning monthly figures, the year-to-date performance presents a more optimistic outlook. For the first seven months of 2026, the cumulative goods and services deficit has decreased by $188.4 billion, or 29.6 percent, compared to the same period in 2025. This substantial reduction is a result of robust export growth, which has increased by $237.2 billion, or 12.0 percent, year-to-date. Meanwhile, imports have seen a more modest increase of $48.8 billion, or 1.9 percent, over the same period.
This divergence in year-to-date trends suggests that while monthly fluctuations can be significant, the broader trajectory of U.S. trade may be influenced by underlying economic conditions and trade policies that have supported export expansion and moderated import growth over a longer horizon.
Three-Month Moving Averages: Smoothing Out Volatility
To provide a less volatile perspective, the report also highlights three-month moving averages. The average goods and services deficit for the three months ending in July increased by $11.9 billion to $78.5 billion. This indicates a recent upward trend in the deficit, which is larger than the single-month figure due to the accumulation of recent increases. Year-over-year, the average goods and services deficit for the same three-month period has increased by $11.7 billion from the period ending in July 2025. This suggests that while the year-to-date deficit has shrunk, the recent trend points towards a widening imbalance.
Revisions to Prior Data
The U.S. Census Bureau and the Bureau of Economic Analysis also announced revisions to export and import data for goods and services from January through June 2026. These revisions are standard practice and are incorporated to reflect more comprehensive and up-to-date quarterly and monthly data, ensuring the accuracy of the official trade statistics. The specific details of these revisions to June exports and imports were not elaborated upon in the initial release but are crucial for understanding the precise flow of trade in the preceding months.
Trade Balances with Key Partners: A Snapshot
The report provides detailed breakdowns of trade balances with various countries and regions, offering insights into bilateral trade relationships.
Goods Trade (Census Basis) – July 2026:
- Surpluses: The U.S. recorded significant surpluses in goods trade with countries and areas including the Netherlands ($7.8 billion), South and Central America ($6.6 billion), Hong Kong ($3.1 billion), the United Kingdom ($2.5 billion), Brazil ($2.4 billion), Singapore ($1.9 billion), Saudi Arabia ($1.3 billion), Australia ($1.2 billion), and Belgium ($0.9 billion).
- Deficits: Substantial deficits were observed with Mexico ($27.5 billion), Vietnam ($23.3 billion), Taiwan ($18.1 billion), China ($15.2 billion), South Korea ($10.4 billion), the European Union ($8.9 billion), Germany ($5.6 billion), India ($5.0 billion), Malaysia ($4.8 billion), Japan ($4.2 billion), Ireland ($3.9 billion), Canada ($3.2 billion), Italy ($2.5 billion), France ($1.3 billion), Switzerland ($0.6 billion), and Israel ($0.5 billion).
Goods and Services Trade (Balance of Payments Basis) – Second Quarter 2026:
- Surpluses: Quarterly data for goods and services trade revealed surpluses with the Netherlands ($29.6 billion), South and Central America ($21.7 billion), Singapore ($15.9 billion), Hong Kong ($15.1 billion), Brazil ($12.7 billion), Ireland ($12.1 billion), Switzerland ($10.6 billion), Australia ($9.3 billion), the United Kingdom ($9.1 billion), Saudi Arabia ($4.7 billion), Belgium ($3.2 billion), and the European Union ($2.0 billion).
- Deficits: Significant deficits were recorded with Vietnam ($61.2 billion), Taiwan ($53.1 billion), Mexico ($52.7 billion), China ($32.3 billion), Germany ($19.2 billion), South Korea ($14.6 billion), Canada ($13.7 billion), India ($12.2 billion), Malaysia ($11.4 billion), Italy ($9.7 billion), France ($6.3 billion), Japan ($4.9 billion), and Israel ($1.5 billion).
These country-specific figures highlight the uneven nature of U.S. trade relationships, with persistent deficits in goods trade with several major Asian economies and European nations, while maintaining surpluses in goods trade with other regions. The quarterly data for goods and services provides a more comprehensive view, incorporating services trade which often exhibits different patterns than goods trade.
Broader Economic Context and Implications
The widening trade deficit in July comes at a time when the U.S. economy is navigating complex global economic conditions, including inflationary pressures, geopolitical uncertainties, and evolving trade policies. A persistent and growing trade deficit can have several economic implications. It can contribute to a larger national debt as the U.S. borrows from foreign entities to finance its consumption. It can also put downward pressure on the value of the U.S. dollar, potentially making imports more expensive and exports more competitive in the long run.
However, the year-to-date figures suggest that underlying export strength is helping to offset the monthly widening of the deficit. The robust growth in exports is a positive sign, indicating continued demand for American products and services in international markets. The performance of exports is often influenced by global economic growth, the competitiveness of U.S. industries, and the effectiveness of trade agreements.
The increase in imports, particularly in goods, could reflect a robust domestic economy that is consuming more foreign-made products. However, if this trend continues without a corresponding increase in exports, it can lead to a less favorable balance of trade.
Future Outlook and Data Release Schedule
The next release of U.S. International Trade in Goods and Services data is scheduled for Tuesday, October 6, 2026, which will cover the trade figures for August 2026. This upcoming release will provide crucial information on whether the July trend of a widening deficit continues or if there are signs of a reversion to earlier trends.
The Census Bureau also announced a minor nomenclature change, stating that with the August 2026 release, references to "Nauru" will be replaced with "Naoero" to align with the country’s official name change and its recognition by international bodies.
All statistics referenced in the report are seasonally adjusted unless otherwise specified, providing a smoothed view of trade flows. Additional detailed statistics, including not seasonally adjusted data and specific breakdowns for goods on a Census basis, are available through the Census Bureau and the Bureau of Economic Analysis websites, offering a comprehensive resource for researchers and policymakers.
The interplay between exports, imports, and the resulting trade balance is a critical indicator of economic health and international competitiveness. The July figures serve as a reminder of the dynamic nature of global trade and the ongoing need to monitor and understand the factors influencing these vital economic flows.