Lana Rhoades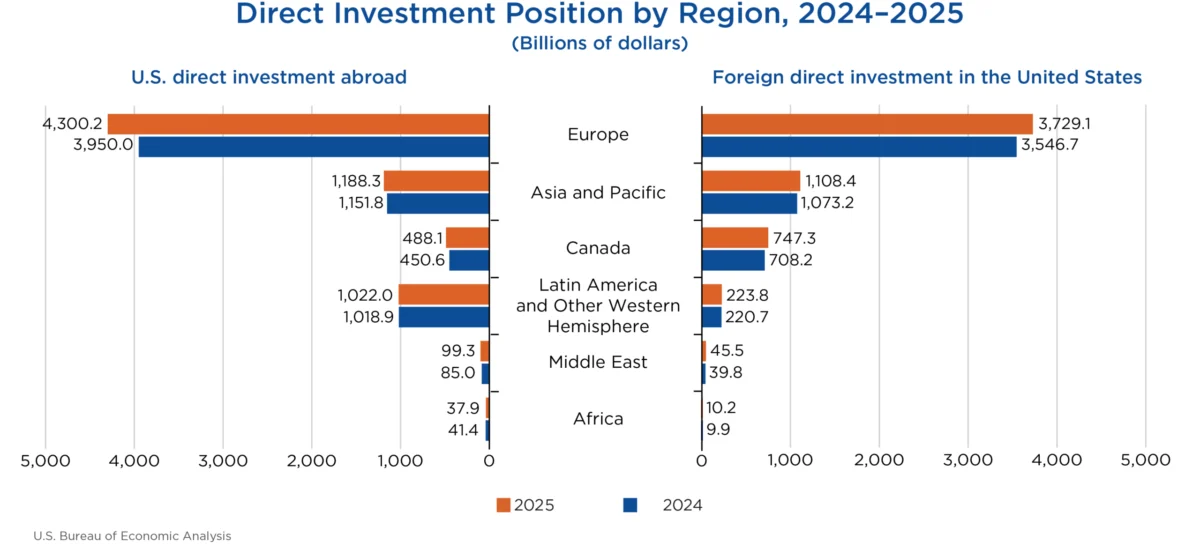
The cumulative level of U.S. direct investment abroad reached a new high of $7.14 trillion by the end of 2025, marking a substantial increase of $438.1 billion from the previous year. This significant growth, detailed in statistics released today by the U.S. Bureau of Economic Analysis (BEA), was predominantly fueled by a surge in investment within Europe, particularly in the United Kingdom and Luxembourg, which saw an increase of $350.2 billion. Manufacturing sectors, notably chemical manufacturing, were the primary drivers of this outward investment expansion.
Concurrently, foreign direct investment (FDI) in the United States also experienced robust growth, climbing $266.0 billion to a total of $5.86 trillion by the close of 2025. Europe was again a leading contributor to this inward investment, accounting for an $182.4 billion increase. German and Canadian multinational enterprises were particularly active, with German firms increasing their U.S. investment by $49.0 billion and Canadian firms by $39.2 billion. The manufacturing sector in the U.S. also saw the most significant gains in FDI, with electrical equipment and components manufacturing leading the surge.
These figures underscore the dynamic and interconnected nature of global capital flows, highlighting the ongoing importance of both outward and inward direct investment for the U.S. economy. The BEA’s comprehensive data provides a critical snapshot of these international economic relationships, offering insights into investment patterns, sectoral strengths, and the influence of major economic partners.
Global Investment Landscape: Key Trends and Drivers
The BEA’s latest report paints a detailed picture of the United States’ position in the global investment landscape. U.S. multinational enterprises (MNEs) maintain a broad geographic reach, with investments spread across nearly every nation. However, a significant concentration of this outward investment is observed in a select few countries. In 2025, the United Kingdom remained the top destination for U.S. direct investment abroad, holding a position of $1,114.7 billion. This was followed by the Netherlands ($1,044.0 billion), Luxembourg ($645.3 billion), Ireland ($511.9 billion), and Canada ($488.1 billion). Collectively, these five countries accounted for over half of the total U.S. direct investment abroad.
Examining the investment by industry of the directly owned foreign affiliate, holding companies emerged as the dominant sector, representing 45.8 percent of the overall U.S. investment position abroad in 2025. Manufacturing affiliates secured the second-largest share at 15.9 percent, with finance and insurance affiliates following at 13.5 percent. When viewed from the perspective of the U.S. parent company, MNEs in the manufacturing sector were the most significant investors abroad, accounting for 50.2 percent of the total position. MNEs in finance and insurance followed, representing 15.8 percent of U.S. outward investment.
The income generated from these foreign investments also saw a notable increase. U.S. MNEs earned $660.1 billion in 2025 from their cumulative investments abroad, an 11.1 percent rise compared to 2024. This income growth was most pronounced in the holding company sector, which saw an increase of $40.0 billion. Conversely, income from finance and insurance affiliates experienced a decline of $6.3 billion year-over-year.
Foreign Direct Investment Flows into the United States
On the inbound front, foreign direct investment in the United States also demonstrated substantial growth, reaching $5.86 trillion by the end of 2025. Similar to outward investment trends, Europe played a pivotal role in this inward flow, contributing an increase of $182.4 billion.
When analyzed by the country of the foreign parent, four nations accounted for more than half of the total FDI in the U.S. Japan led as the top investing country, with a position of $776.3 billion. The Netherlands followed closely with $751.8 billion, then Canada with $747.3 billion, and the United Kingdom with $738.3 billion.
A deeper dive into the ultimate beneficial owner (UBO) – the entity at the apex of the global ownership chain – provides a more nuanced perspective. On a UBO basis, Japan remained the leading investor in the U.S. with $827.1 billion, followed by Canada ($819.8 billion) and Germany ($706.2 billion). The disparity between investment figures based on the country of foreign parent versus the UBO for countries like the Netherlands and Luxembourg suggests that a significant portion of investment channeled through these jurisdictions ultimately originates from investors in other nations, highlighting the role of these countries as financial hubs.
The U.S. manufacturing sector continued to be a primary destination for foreign investment, attracting $2.51 trillion, which represented 42.8 percent of the total FDI position. Within manufacturing, chemical manufacturing alone accounted for a substantial one-third of this investment, totaling $835.9 billion. Other key sectors attracting foreign capital included finance and insurance ($629.7 billion) and wholesale trade ($534.0 billion).
Income earned by foreign MNEs on their cumulative investments in the United States amounted to $310.1 billion in 2025. This figure represents a 1.9 percent decrease from the previous year, indicating a slight cooling in the profitability of foreign-held assets within the U.S. economy.
Revisions and Historical Context
The BEA’s release also included revisions to previously published statistics, a standard practice to incorporate newly available and revised source data. For 2023, U.S. direct investment abroad was revised to $6,598 billion from a previous figure of $6,620 billion, and foreign direct investment in the United States was revised to $5,338 billion from $5,376 billion. For 2024, U.S. direct investment abroad was revised to $6,698 billion from $6,827 billion, and foreign direct investment in the United States was revised to $5,598 billion from $5,708 billion. Data for 2022 for U.S. direct investment abroad was not revised in this release. These adjustments reflect the ongoing refinement of economic data as more comprehensive information becomes available, providing a more accurate historical record of international investment activities.
The trends observed in 2025 build upon a history of increasing global integration. For decades, both U.S. companies expanding their global footprint and foreign entities seeking access to the large and dynamic U.S. market have contributed to the significant stock of direct investment. Factors such as global economic growth, trade agreements, technological advancements, and strategic corporate decisions have historically influenced these flows. The recent data suggests a continuation and acceleration of these patterns, particularly in the post-pandemic recovery period, with Europe and manufacturing sectors playing prominent roles.
Broader Economic Implications
The substantial increases in both U.S. direct investment abroad and foreign direct investment in the United States have several key implications for the global and domestic economies. For the United States, the growth in outward investment signifies the continued competitiveness and global ambition of American corporations. This expansion can lead to increased access to foreign markets, diversification of revenue streams, and the development of global supply chains, ultimately contributing to the long-term growth and profitability of U.S. enterprises.
Conversely, the robust inflow of FDI into the U.S. is a strong indicator of confidence in the American economy by foreign investors. This investment creates jobs, stimulates domestic economic activity, fosters innovation through the introduction of new technologies and management practices, and contributes to U.S. gross domestic product (GDP). The concentration of FDI in manufacturing, particularly in sectors like chemicals and electrical equipment, suggests a healthy appetite for U.S. industrial capacity and production.
The BEA’s detailed data allows policymakers and businesses to better understand the geographic and sectoral distribution of these investments. This information is crucial for formulating trade and investment policies, identifying potential areas for economic development, and assessing the impact of foreign investment on specific industries and regions within the United States. The growth in income earned by both U.S. MNEs abroad and foreign MNEs in the U.S. also reflects the financial performance of these cross-border investments, impacting balance of payments and national income accounts.
The BEA will continue to monitor and report on these critical economic indicators. The next release, scheduled for July 2027, will provide updated statistics on Direct Investment by Country and Industry for 2026, offering further insights into the evolving landscape of global capital flows. The agency’s commitment to refining its data through updated disclosure avoidance methods, such as coarsening, ensures that more granular information can be published while maintaining respondent confidentiality, thereby enhancing the utility of its statistical output for a wide range of stakeholders.