Lana Rhoades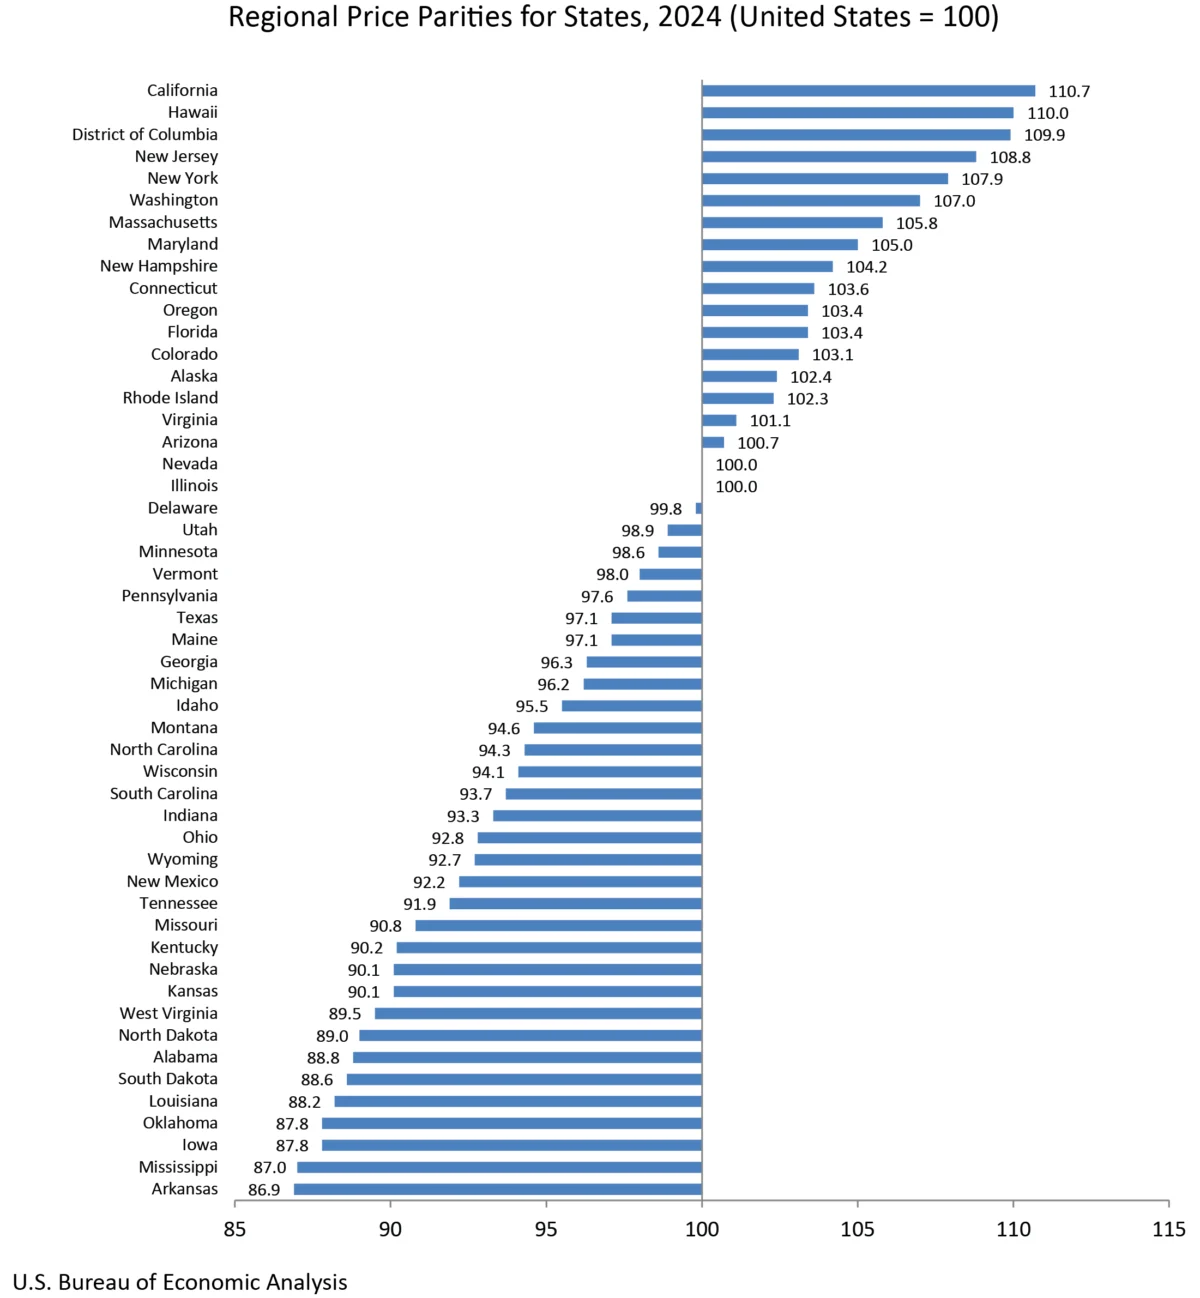
The U.S. Bureau of Economic Analysis (BEA) today unveiled its latest annual statistics, offering a detailed snapshot of the nation’s economic landscape at the state level for 2024. This significant release provides crucial data on real personal consumption expenditures (PCE), real personal income, and regional price parities (RPPs) for all 50 states and the District of Columbia. The comprehensive report, a cornerstone for economic analysis and policy-making, reveals varied economic performance across the country, highlighting both areas of robust growth and those experiencing contraction. This release also incorporates revisions to historical data from 2008 to 2023, reflecting a more complete picture of economic trends over the past decade and a half.
Key Findings: Real Personal Consumption Expenditures
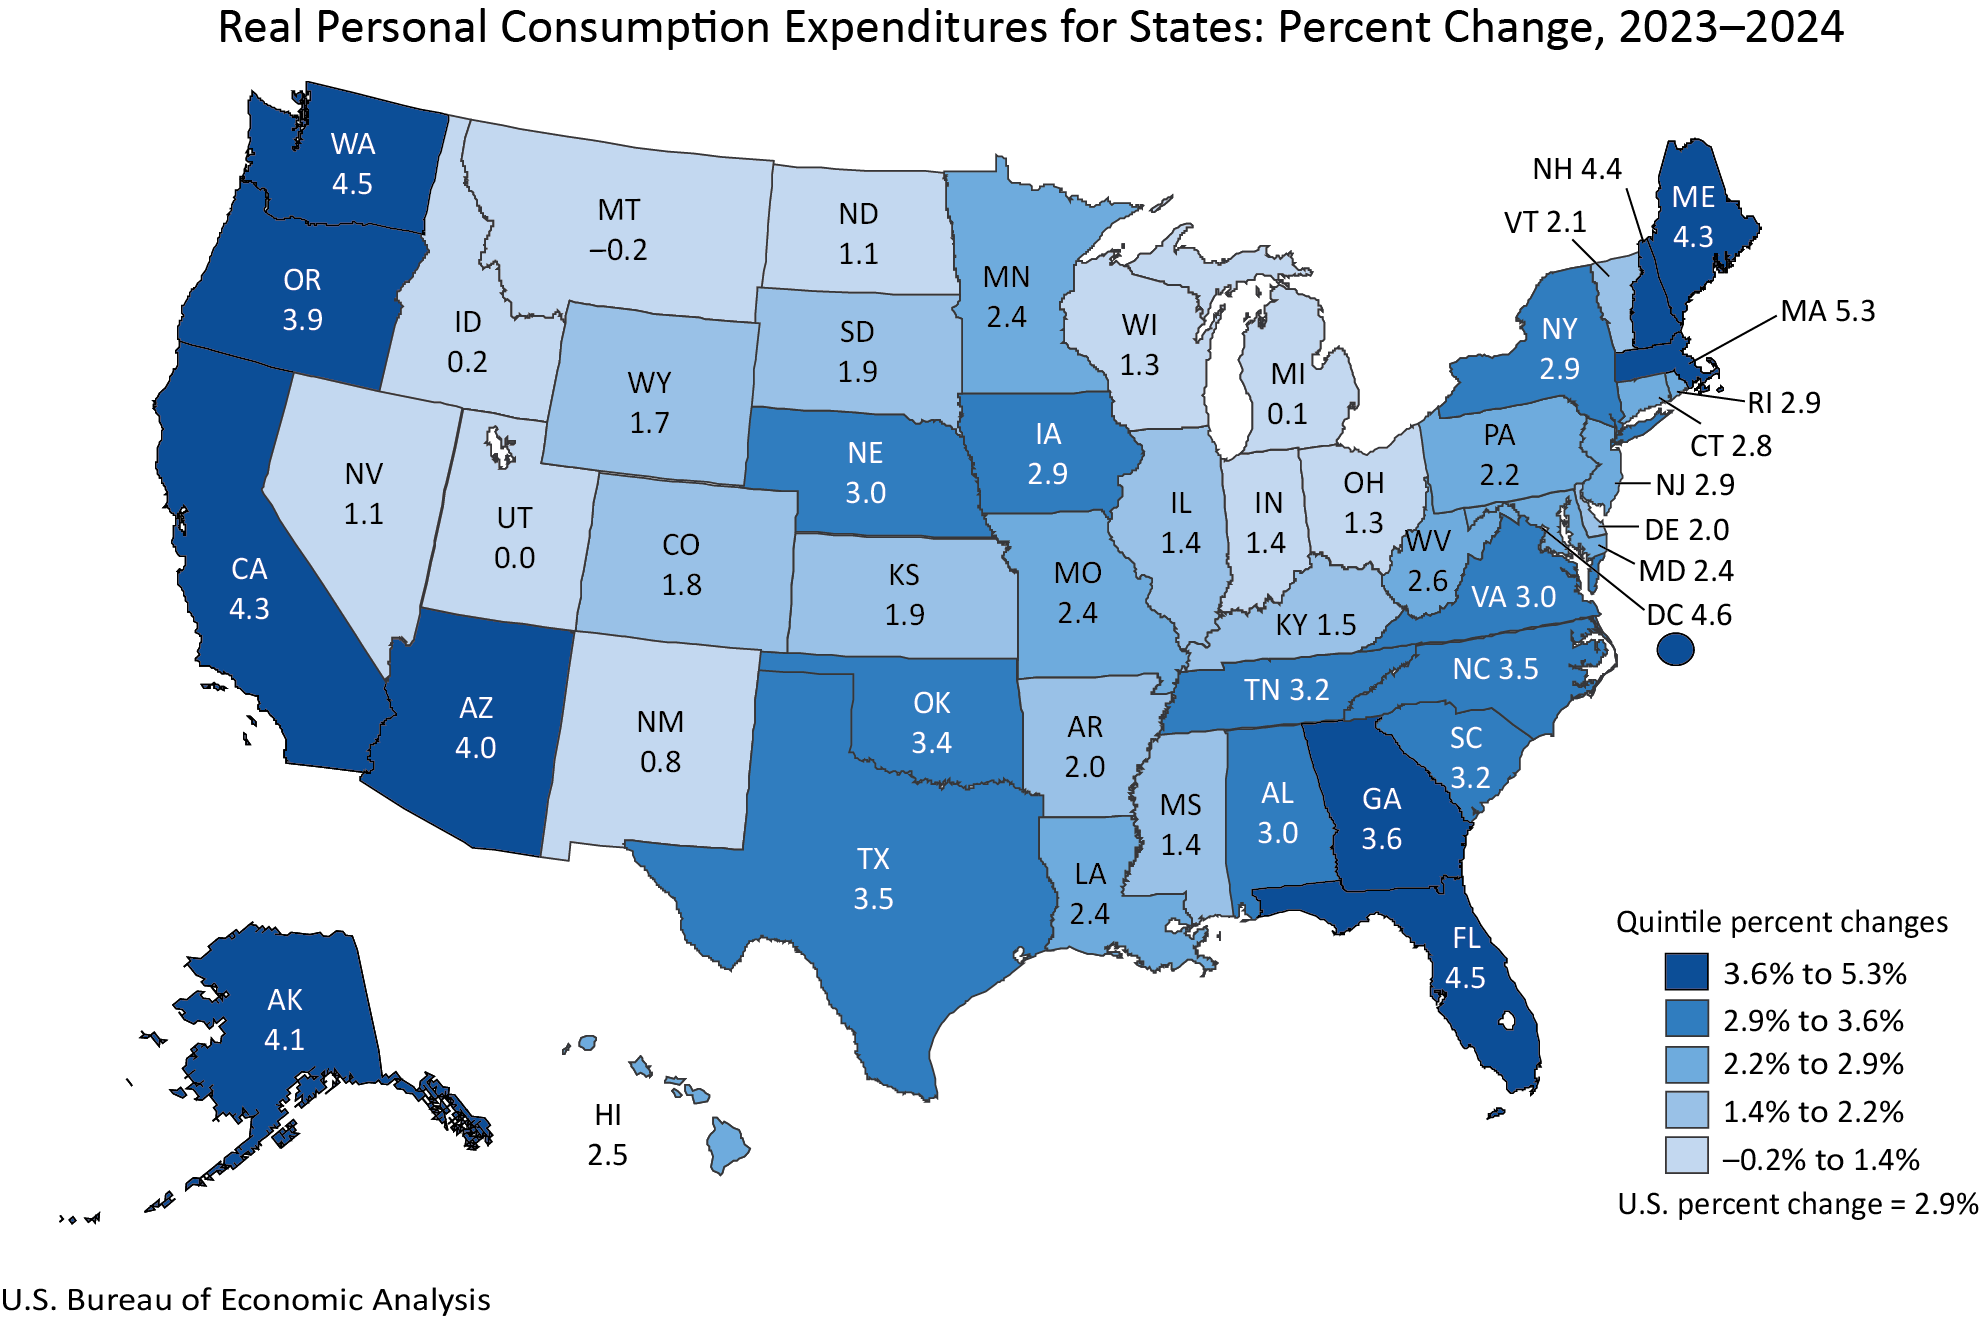
The data indicates a widespread increase in real personal consumption expenditures (PCE) across the United States in 2024. A substantial 48 states and the District of Columbia witnessed growth in this critical measure of consumer spending, signaling a generally positive consumer sentiment and economic activity nationwide. The extent of this growth varied considerably, with Massachusetts leading the nation with an impressive 5.3 percent increase in real PCE. This surge in spending in Massachusetts suggests a particularly vibrant consumer market in the state, potentially driven by factors such as a strong job market, increased disposable income, or a robust service sector.
Conversely, Montana experienced a slight decline of 0.2 percent in real PCE, marking it as one of the few states to see a contraction in consumer spending. While this decrease is marginal, it warrants attention within the broader context of state-level economic performance. The national average for real PCE growth stood at 2.9 percent in 2024. This figure, while positive, is outpaced by the growth in current-dollar PCE, which rose by 5.6 percent. The discrepancy between real and current-dollar growth is attributed to the national PCE price index, which increased by 2.6 percent. This indicates that while consumers were spending more in nominal terms, a portion of that increase was due to rising prices rather than an actual expansion in the volume of goods and services purchased.
Real PCE, adjusted for inflation and regional price differences, provides a clearer picture of the actual volume of goods and services consumed by households in each state. The BEA calculates these figures by adjusting current-dollar PCE estimates with the corresponding regional price parity (RPP) and the national PCE price index. This methodology ensures that comparisons between states are meaningful, accounting for variations in the cost of living and inflation rates.
Real Personal Income Shows Broad-Based Growth
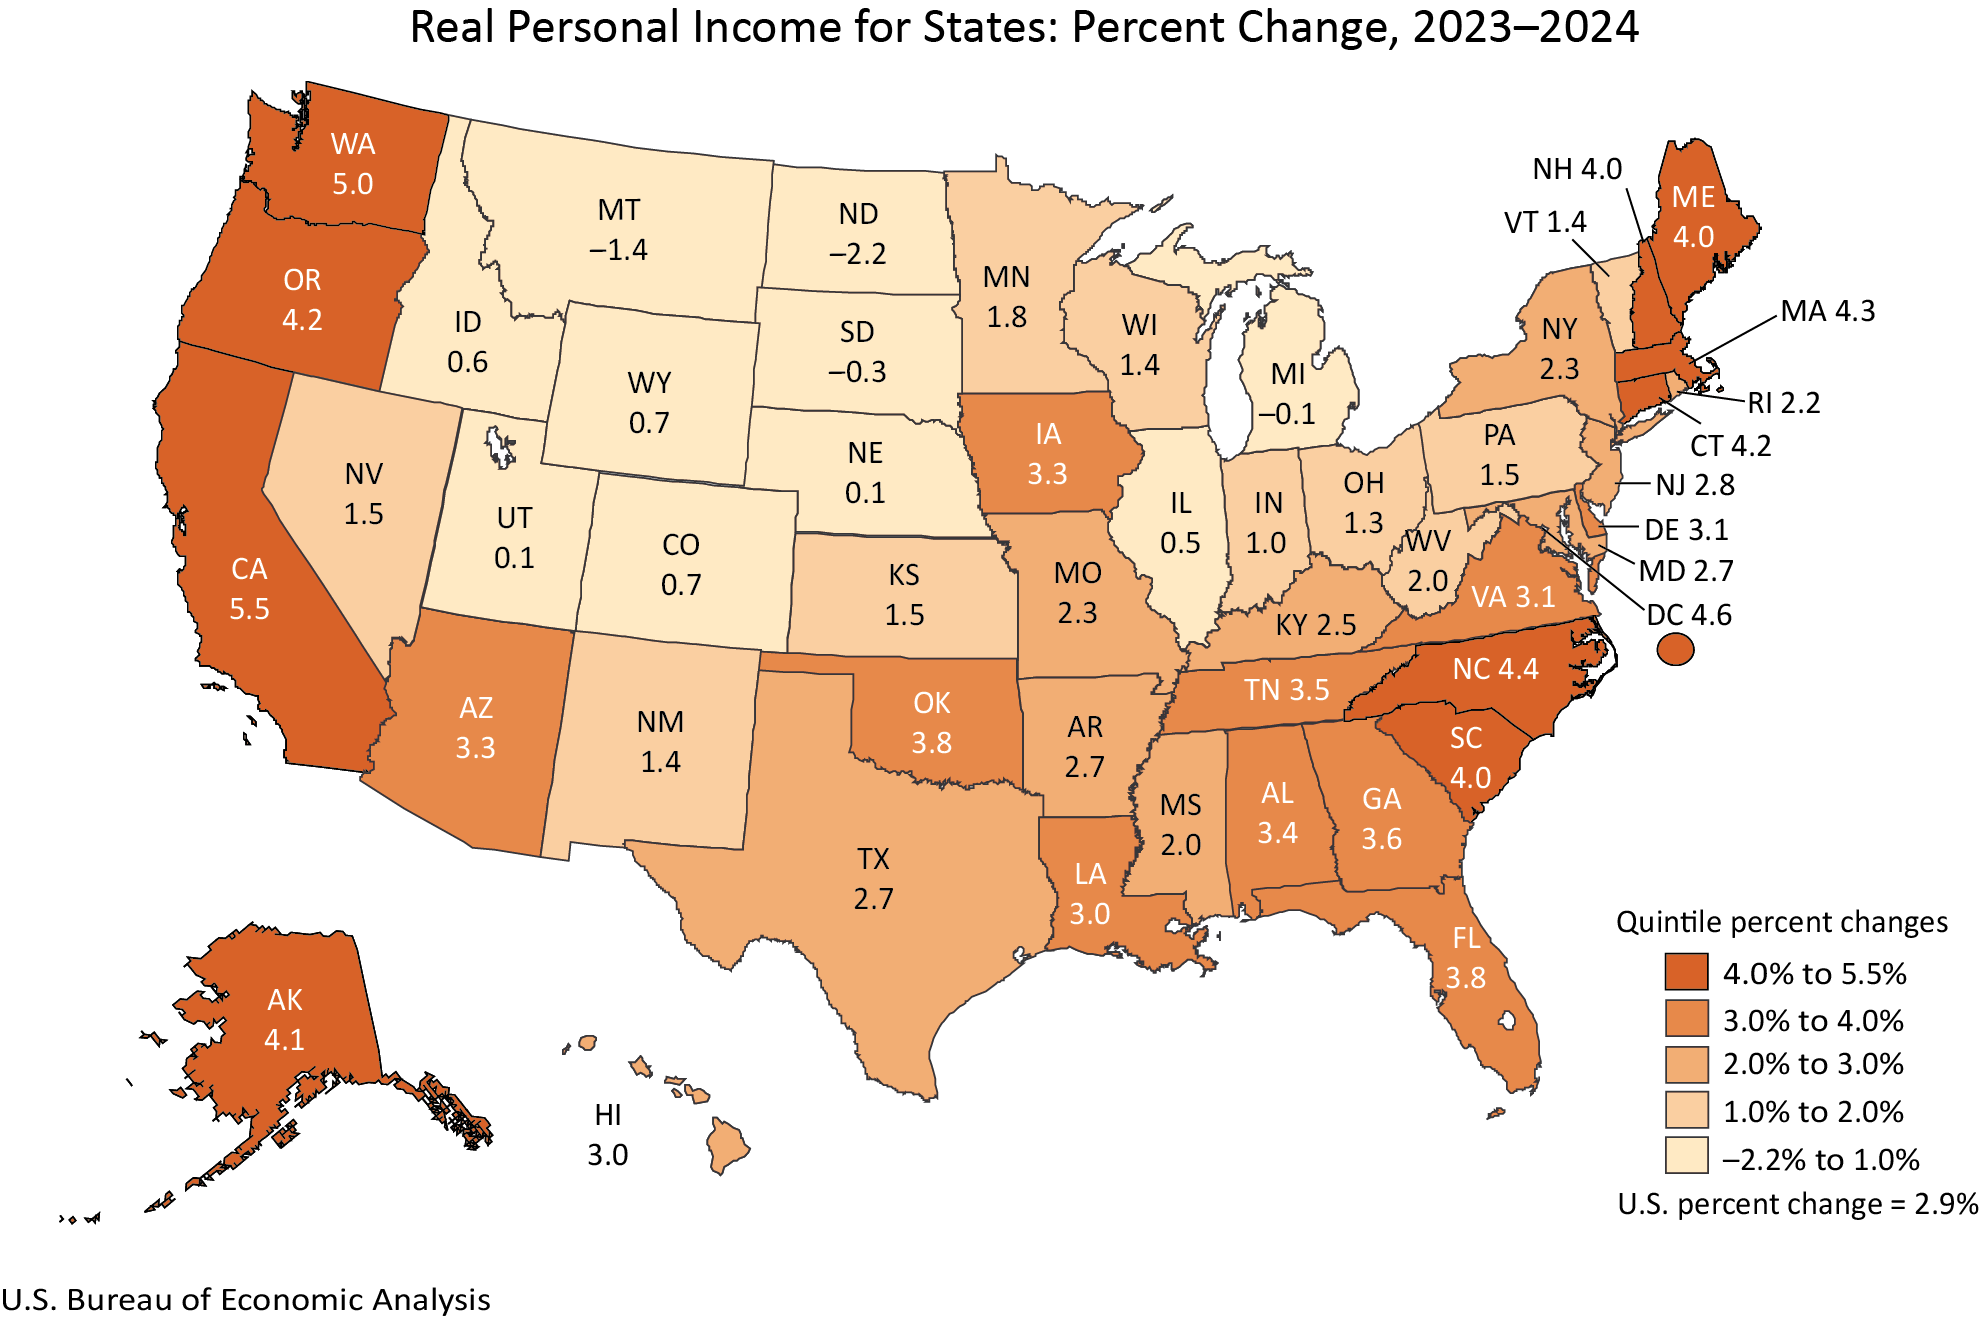
Mirroring the trend in consumer spending, real personal income also demonstrated widespread growth in 2024, with 46 states and the District of Columbia experiencing an increase. California emerged as the top performer in this category, with real personal income surging by 5.5 percent. This substantial growth in California’s real income points to a strong economic performance, likely fueled by its dynamic technology sector, robust employment growth, and significant contributions from various industries.
In contrast, North Dakota saw a decrease of 2.2 percent in real personal income. This marks a notable downturn for the state, which may be influenced by fluctuations in key industries or broader economic headwinds. Nationally, real personal income for the country as a whole grew by 2.9 percent in 2024. Similar to PCE, current-dollar personal income increased by 5.6 percent, exceeding the national PCE price index of 2.6 percent. This suggests that, on average, individuals’ purchasing power increased in real terms across the nation, although the rate of income growth did not fully outpace the rise in prices for all goods and services.
The BEA’s methodology for real personal income involves adjusting current-dollar estimates by the RPP and the national PCE price index. This process is crucial for understanding the true increase in the volume of goods and services that individuals can afford with their earnings, thereby offering a more accurate measure of economic well-being at the state level.
Regional Price Parities: Understanding Cost of Living Differences
The release also includes updated figures for Regional Price Parities (RPPs), which measure the differences in price levels across states for a given year. These indices are expressed as a percentage of the overall national price level, providing essential context for interpreting income and spending data. The all-items RPP encompasses all consumption goods and services, including housing rents. Housing costs, particularly rent, are frequently identified as a primary driver of significant variations in RPPs between states.
States with higher RPPs, such as New York and California, generally have a higher cost of living, meaning that a dollar of income or spending buys less in these areas compared to states with lower RPPs, such as in the Midwest or parts of the South. For instance, if a state has an RPP of 120, it means that prices are, on average, 20 percent higher than the national average. Conversely, an RPP of 90 indicates prices are 10 percent below the national average.
The BEA’s RPP data is vital for policymakers and researchers seeking to understand the real economic disparities between states. It helps in assessing the true purchasing power of income and the relative cost-effectiveness of consumer spending across different regions. The BEA also provides metropolitan area RPP statistics on its website, offering a more granular view of price level variations within states.
Revisions and Data Updates: A More Complete Economic Picture
A significant aspect of this release is the comprehensive revision of annual estimates for real PCE and real personal income by state from 2008 to 2023. These revisions incorporate newly available and updated source data, which are more complete and detailed than previously accessible. This process ensures that the BEA’s historical data aligns with the most current economic understanding and integrates seamlessly with other major BEA statistical releases, such as the National Income and Product Accounts (NIPA) and GDP by industry statistics. The alignment with the GDP, personal income, and PCE by state statistics released on September 26, 2025, further enhances the consistency and comparability of national economic data.
In addition to historical revisions, the BEA has released new estimates for real per capita PCE and real per capita personal income for 2024. These per capita figures are derived using population estimates from the U.S. Census Bureau for the period of 2020 through 2024, providing valuable insights into the economic resources available to the average resident in each state. Real per capita income is a key indicator of the average standard of living, while real per capita PCE reflects the average consumption of goods and services.
Discontinuation of Metropolitan Area Statistics
In a notable change to its publication practices, the BEA has discontinued the release of statistics for metropolitan statistical areas and their metropolitan and nonmetropolitan portions, effective with the 2024 data. While real PCE and real personal income will continue to be published at the state level, and RPPs will remain available for states and local areas, the more granular metropolitan-level data will no longer be a standard part of the BEA’s regular news releases. This decision aims to streamline data dissemination and focus resources on core state-level and regional analyses. The BEA has provided an FAQ for users seeking more information on this change.
Changes in Data Presentation
Furthermore, the BEA has updated its presentation of data tables. Previously embedded within news releases, detailed tables for real PCE and real personal income by state are now exclusively available through the BEA’s online Interactive Data Application. This shift is intended to reduce duplication, enhance efficiency, and direct users to a more comprehensive and flexible data platform. The interactive application allows users to customize their data views, access full time series, and download data in various formats, including PDF, Excel, and CSV. This move aligns with a broader trend in government statistical agencies to leverage digital platforms for data dissemination, offering users greater control and accessibility.
Broader Economic Context and Implications
The BEA’s release of these detailed state-level economic statistics arrives at a time of ongoing economic recalibration. Following a period of significant stimulus and rapid recovery, the U.S. economy is navigating challenges such as persistent inflation, evolving labor market dynamics, and global economic uncertainties. The data on PCE and personal income provides crucial indicators of consumer resilience and the distribution of economic gains across different states.
The divergence in growth rates among states highlights the uneven nature of economic recovery and development. States experiencing robust growth in real PCE and personal income, such as Massachusetts and California, may benefit from strong sectoral advantages, innovative industries, or favorable demographic trends. Conversely, states with declining or stagnant figures, like Montana and North Dakota, may be more exposed to sector-specific downturns, commodity price volatility, or slower demographic shifts.
The RPP data underscores the importance of regional cost of living differences in understanding economic well-being. A higher income in a high-cost state may not translate to a higher standard of living compared to a lower income in a low-cost state. This nuance is critical for policymakers when considering issues such as poverty thresholds, minimum wage laws, and the allocation of federal resources.
The revisions to historical data are particularly significant. They provide economists and policymakers with a more accurate and consistent understanding of long-term economic trends, allowing for more informed analysis of past performance and more reliable forecasting of future economic trajectories. The integration of these revised figures with other BEA releases ensures a cohesive and robust framework for national economic accounting.
The discontinuation of metropolitan area statistics, while a shift in presentation, does not diminish the overall value of the BEA’s regional data. State-level analyses remain fundamental for understanding broad economic patterns, while RPPs at the local level continue to offer granular insights into price variations.
Looking ahead, the BEA has announced its next release of real personal consumption expenditures by state and real personal income by state for 2025, scheduled for December 10, 2026. Until then, the current release provides the most up-to-date and comprehensive picture of the diverse economic conditions across the United States. The data serves as an indispensable tool for businesses making investment decisions, individuals understanding their economic environment, and government officials shaping economic policy at all levels.