Lana Rhoades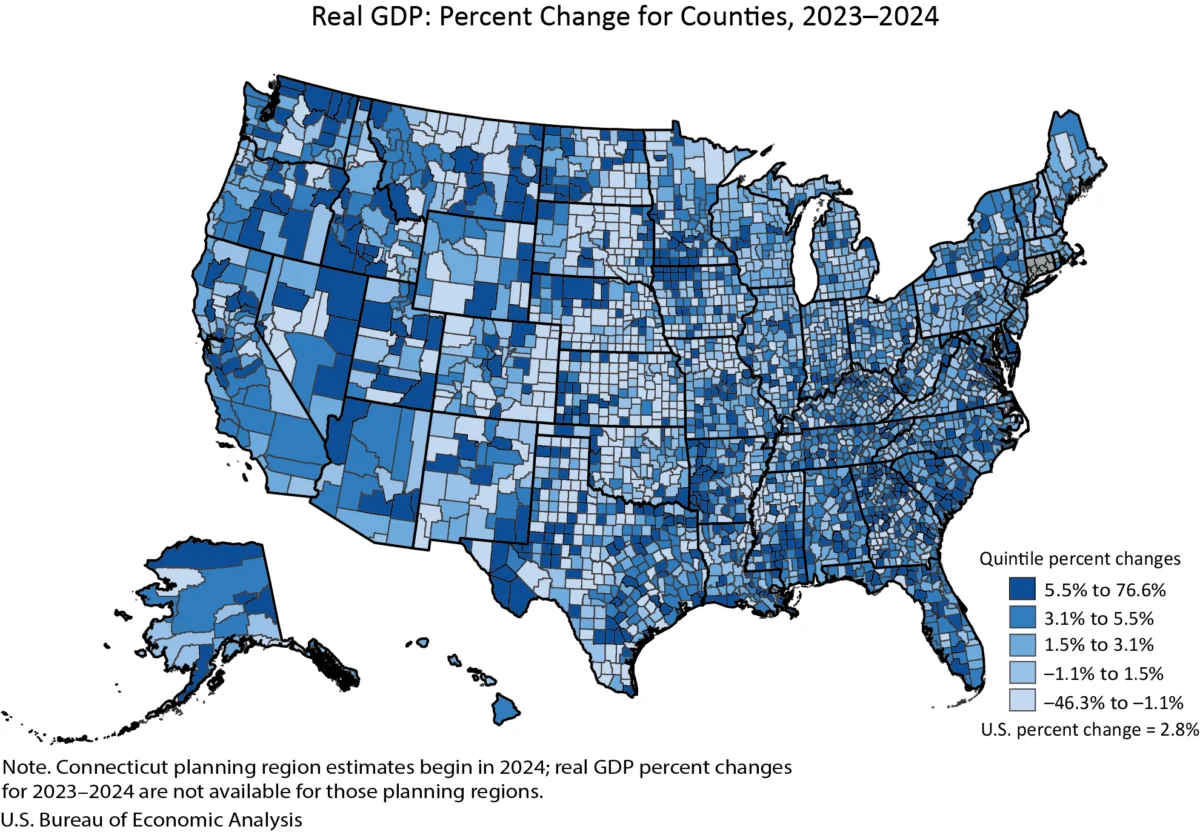
The U.S. Bureau of Economic Analysis (BEA) released its annual estimates for county-level Gross Domestic Product (GDP) and personal income today, revealing a varied economic landscape across the nation in 2024. While a significant majority of counties experienced growth in real GDP, a notable number saw declines, underscoring the uneven nature of economic recovery and expansion. Personal income trends mirrored this pattern, with most counties registering increases, though some faced contractions. These updated figures provide a granular view of the U.S. economy, offering insights into the performance of local economies and the drivers behind their changes.
Key Findings: A Divided Economic Landscape
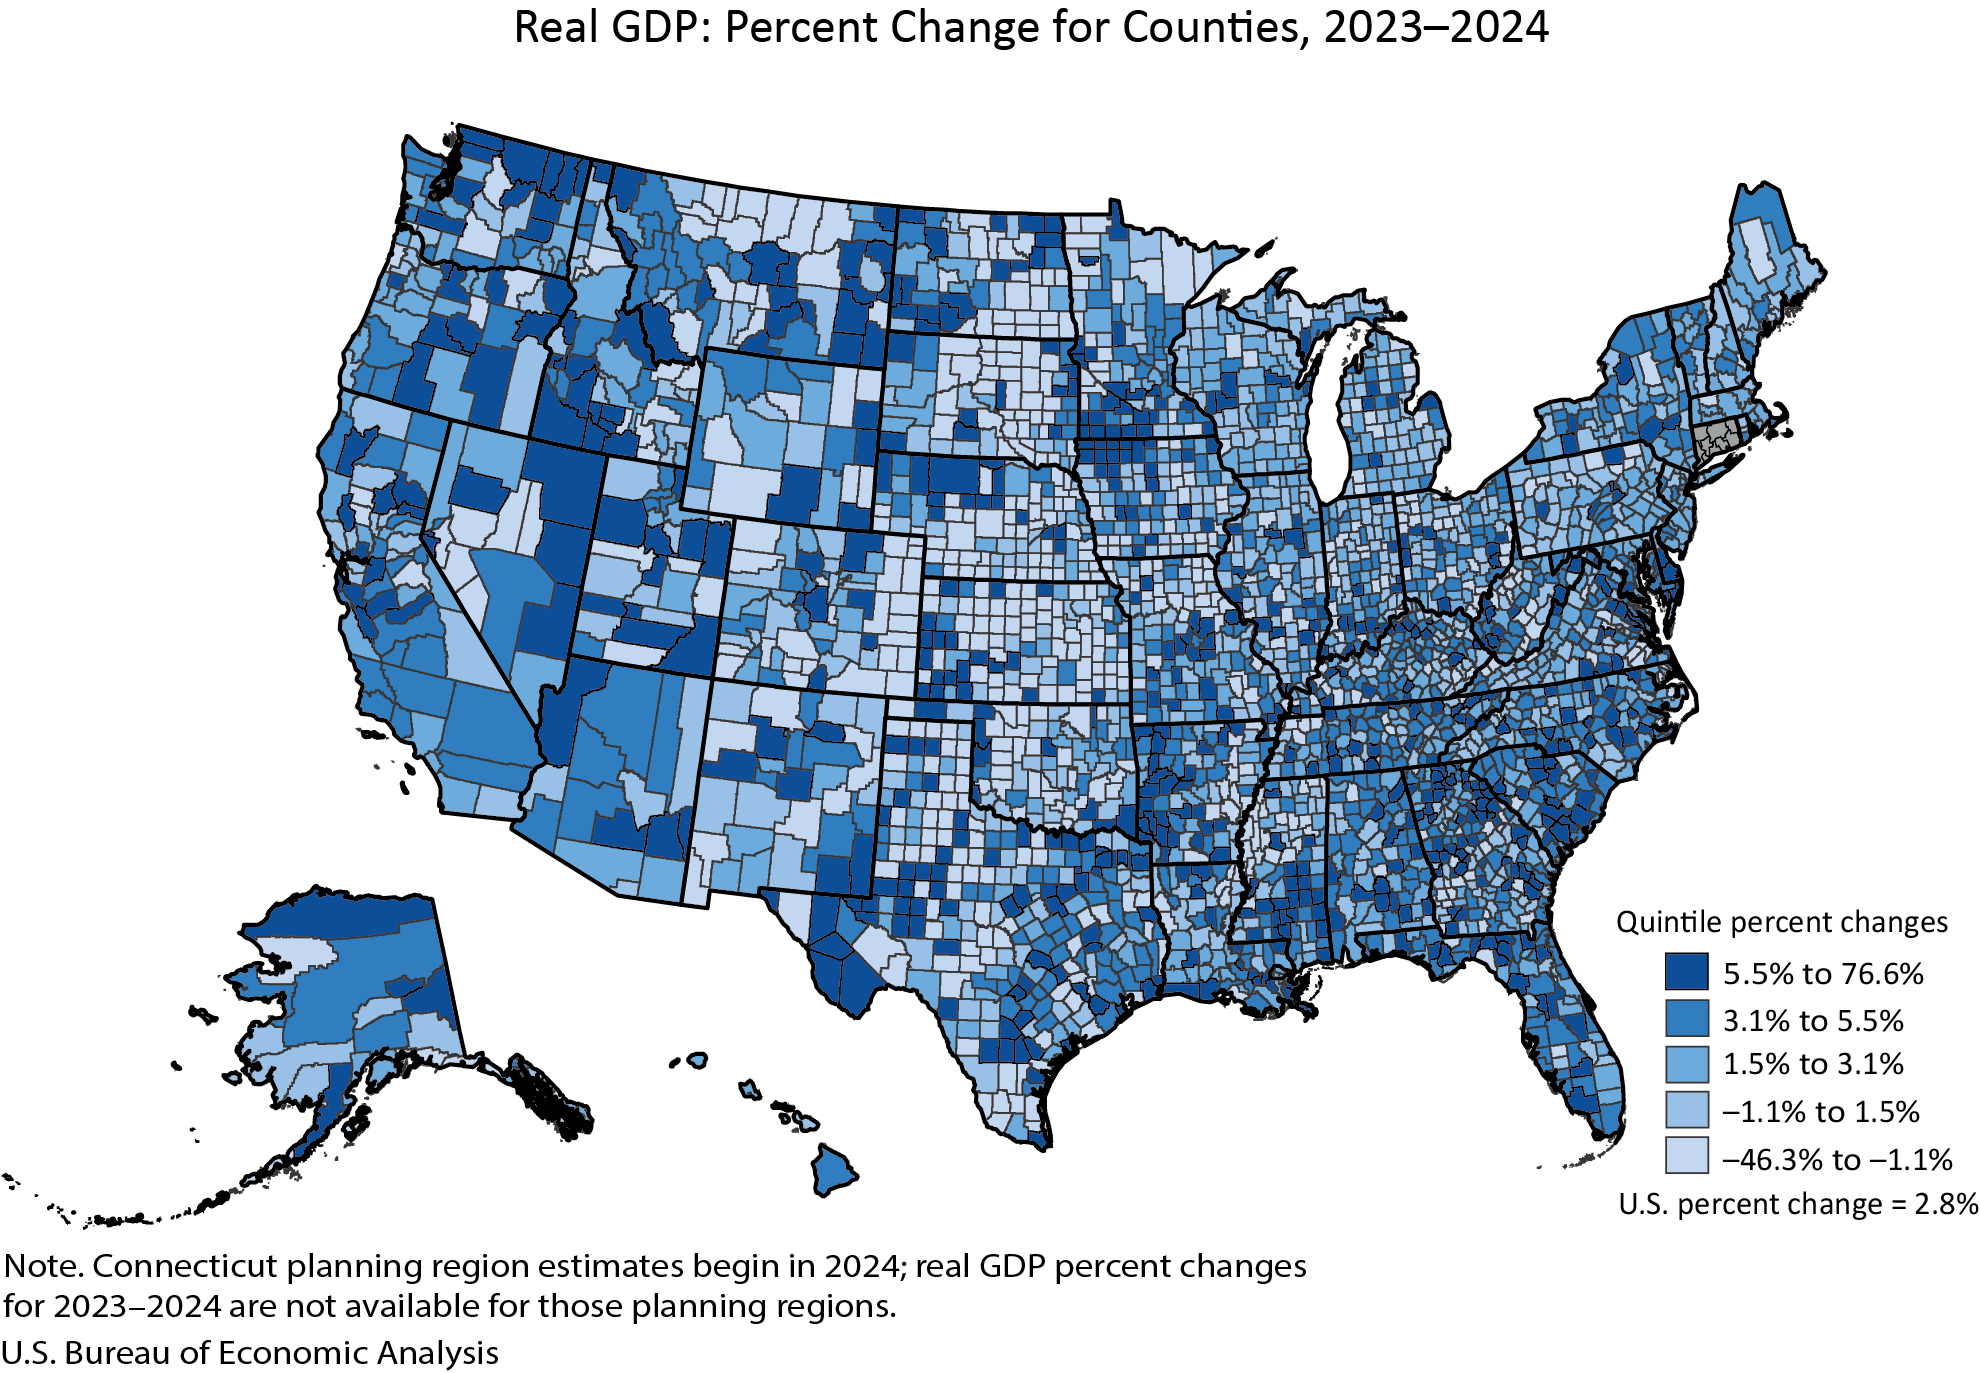
In 2024, the BEA’s estimates indicate that real Gross Domestic Product (GDP) saw an increase in 2,273 counties nationwide. Conversely, 809 counties experienced a decrease in their real GDP, while 24 counties reported no significant change. This data highlights a dynamic economic environment where growth is prevalent but not universal, suggesting that localized factors, industry concentrations, and regional economic policies are playing a crucial role in shaping outcomes.
The magnitude of these economic shifts varied considerably. The most striking growth was observed in Carter County, Montana, which recorded an impressive 76.6 percent increase in real GDP. On the other end of the spectrum, Baca County, Colorado, faced a substantial economic downturn, with its real GDP declining by 46.3 percent. These outliers underscore the significant disparities that can exist even within the broader economic trends.
The overall size of county economies, as measured by real GDP, also presented a wide range. New York County, New York (Manhattan), stood as the largest economic engine, with a total real GDP of $813.7 billion. In contrast, Issaquena County, Mississippi, represented the smallest economy, with a real GDP of just $15.7 million. This vast difference in economic scale emphasizes the diverse character of U.S. counties, from major metropolitan hubs to rural areas with specialized economies.
Personal Income Trends: A Similar Story of Divergence
Parallel to GDP trends, personal income, measured in current dollars, also showed a mixed picture. In 2024, personal income rose in 2,768 counties, decreased in 331 counties, and remained unchanged in 7 counties. This suggests that while many Americans saw their incomes grow, a significant portion of the population in certain regions experienced a reduction in their earnings.
The percent change in personal income ranged from a robust 22.6 percent increase in Harding County, South Dakota, to a sharp 23.3 percent decline in Issaquena County, Mississippi. The fact that Issaquena County appears at the extreme ends of both GDP and personal income changes highlights potential vulnerabilities and unique economic circumstances within such smaller, potentially less diversified, economies.
The total level of personal income across counties also exhibited substantial variation. Los Angeles County, California, reported the highest total personal income at $818.5 billion. At the other end of the scale, Loving County, Texas, had the lowest personal income, totaling $10.6 million. These figures reflect the significant disparities in wealth and economic activity across different regions of the United States.
Understanding the Data: A Deeper Dive into County Performance
The BEA’s release provides a granular look at economic performance, segmented by county population size. This segmentation offers valuable insights into how different types of communities are faring.
County Real GDP Performance by Population Size
-
Large Counties (Population > 500,000): These economic powerhouses, which include major metropolitan areas, saw a predominantly positive trend. Out of this group, 145 counties experienced GDP growth, 0 reported a decline, and 1 saw no appreciable change. The range of percent change in this category was from a high of 10.7% in Pinal County, Arizona, to 0.0% in Johnson County, Kansas, indicating a stable, albeit less volatile, growth pattern in these larger economies. The size range for these counties was substantial, with New York County, NY, leading at $813.7 billion and Pinal County, AZ, at $12.7 billion.
-
Medium Counties (Population 100,000 to 500,000): This segment showed a more mixed performance. There were 451 counties with GDP growth, 20 with declines, and 3 with no significant change. The trend range was wider than in large counties, with Jefferson County, Texas, experiencing a 12.4% increase and Black Hawk County, Iowa, facing a 2.6% decline. In terms of size, Mercer County, New Jersey, stood out at $46.6 billion, while Liberty County, Texas, was at $2.6 billion.
-
Small Counties (Population < 100,000): This category exhibited the widest range of performance, both in terms of growth and decline. A total of 1,677 small counties saw their real GDP increase, while 789 experienced a decrease, and 20 reported no change. This segment contained the most extreme outliers, with Carter County, Montana, at the top with a 76.6% increase, and Baca County, Colorado, at the bottom with a 46.3% decrease. The economic scale varied significantly, from $15.1 billion in Martin County, Texas, down to $15.7 million in Issaquena County, Mississippi.
County Personal Income Performance by Population Size
-
Large Counties (Population > 500,000): In this group, 146 counties showed an increase in personal income. The trend range was from a high of 9.7% in San Joaquin County, California, to a low of 2.7% in Philadelphia County, Pennsylvania, suggesting consistent income growth in major urban centers. The size range was led by Los Angeles County, CA ($818.5 billion), with Pinal County, AZ, at $26.1 billion.
-
Medium Counties (Population 100,000 to 500,000): Here, 474 counties reported an increase in personal income. The trend range was from 10.9% in Merced County, California, to 1.6% in Genesee County, Michigan. Collier County, Florida, was the largest in this group at $62.5 billion, and Floyd County, Georgia, was at $4.9 billion.
-
Small Counties (Population < 100,000): This segment displayed the most varied personal income trends. A substantial 2,148 counties saw their personal income grow, while 331 experienced a decline, and 7 reported no change. The extreme ends of the personal income trend range were found here: Harding County, South Dakota, with a 22.6% increase, and Issaquena County, Mississippi, with a 23.3% decline. The economic scale ranged from $12.4 billion in Teton County, Wyoming, down to $10.6 million in Loving County, Texas.
Context and Updates: Revisions and New Methodologies
The 2024 estimates released today are built upon significant revisions to the BEA’s county-level data for the years 2020 through 2023. These revisions incorporate more comprehensive and up-to-date source data, ensuring greater accuracy and alignment with national economic accounts. Specifically, the update integrates revised data from the National Income and Product Accounts (NIPA) and state-level GDP and personal income statistics, both of which were released in late September 2025. This iterative process of data refinement is crucial for maintaining the integrity and reliability of economic indicators.
A notable methodological change for the 2024 estimates involves Connecticut. The state’s economic data will now be reported based on its nine planning regions rather than its traditional county boundaries. This shift reflects a move towards aligning with the state’s own administrative and economic planning structures. Because these regional estimates are only available for 2024, they have not been included in the percent change calculations that compare 2024 to previous years, as a direct year-over-year comparison is not yet possible with this new structure.
Furthermore, the BEA has introduced new estimates for per capita personal income for 2024. These calculations are derived using population figures from the U.S. Census Bureau, providing an average income per person for each county. This metric offers another lens through which to view the economic well-being of county residents.
Consolidation and Discontinuation: Streamlining BEA Reporting
In a significant move to enhance efficiency and provide a more holistic view of local economies, the BEA has consolidated its county-level reporting. For the first time, annual GDP and personal income by county are being released in a single news release. This integration replaces two separate releases that were previously issued on different dates, offering users a more comprehensive and unified dataset.
Concurrently, the BEA announced the discontinuation of its publication of statistics for metropolitan statistical areas (MSAs), micropolitan statistical areas, metropolitan divisions, combined statistical areas (CSAs), and the metropolitan and nonmetropolitan portions of these areas. While GDP and personal income data will continue to be available at the county level, these broader geographic classifications will no longer be a focus of BEA’s county news releases. This strategic decision aims to streamline data dissemination and concentrate efforts on the more granular county-level data, which is seen as a fundamental building block of regional economic analysis. Interested parties can find more details regarding this change in the BEA’s Frequently Asked Questions (FAQ) section.
Enhanced Data Access: The Interactive Data Application
Reflecting a broader trend in data dissemination, the BEA has transitioned the presentation of its detailed tables. Data previously embedded within the county news releases are now exclusively available through the BEA’s Interactive Data Application. This platform offers users greater flexibility and access to customizable tables, including full historical time series, which can be downloaded in various formats such as PDF, Excel, or CSV. This move is intended to reduce duplication, improve efficiency, and direct users to the most comprehensive and dynamic data resources available. Links within the news release provide direct access to these interactive tables, allowing users to explore the data more deeply.
Looking Ahead: Future Releases and Data Archiving
The BEA has outlined its future release schedule, with the next update for county GDP and personal income statistics slated for December 2, 2026, at 8:30 a.m. Eastern Standard Time. This upcoming release will feature the 2025 data, superseding the 2024 figures presented today. For those who need to access the historical data from the current release, it will be preserved in the BEA’s Data Archive. This ensures that researchers and the public can consult past economic conditions even after new data becomes available.
The BEA also provided a link to "Additional Information" for definitions, statistical conventions, regional classifications, and other relevant details pertaining to the county GDP and personal income statistics. This resource is designed to assist users in understanding and utilizing the data effectively.
The release of these detailed county-level economic statistics by the Bureau of Economic Analysis serves as a critical resource for policymakers, businesses, researchers, and the public. It offers a nuanced perspective on the economic health of communities across the United States, highlighting both areas of robust growth and those facing economic challenges, thereby informing economic development strategies and resource allocation at the local and regional levels.