Lana Rhoades
The U.S. current-account deficit, a key indicator of the nation’s international economic transactions, expanded by a notable $33.4 billion, or 15.7 percent, to reach $246.0 billion in the second quarter of 2026. This widening trend, as detailed in statistics released today by the U.S. Bureau of Economic Analysis (BEA), signals a growing imbalance in the country’s trade with the rest of the world. The deficit for the first quarter of 2026 was revised to $212.6 billion.
This latest figure means the second-quarter deficit represented 3.0 percent of current-dollar gross domestic product (GDP), an increase from 2.7 percent in the preceding quarter. This uptick in the deficit’s share of the economy warrants close examination, as it can have implications for domestic investment, employment, and the nation’s overall financial health.
The primary driver behind this substantial widening of the current-account deficit in the second quarter was an enlarged deficit in goods, which was only partially counterbalanced by smaller deficits in primary (earned) income and secondary income (current transfers). This suggests that the U.S. is importing more goods than it is exporting, contributing significantly to the overall negative balance.
Understanding the Components of the Current Account
The current account is a broad measure of a nation’s international economic activity and is comprised of several key components: the balance of trade in goods and services, net primary income receipts, and net secondary income receipts.
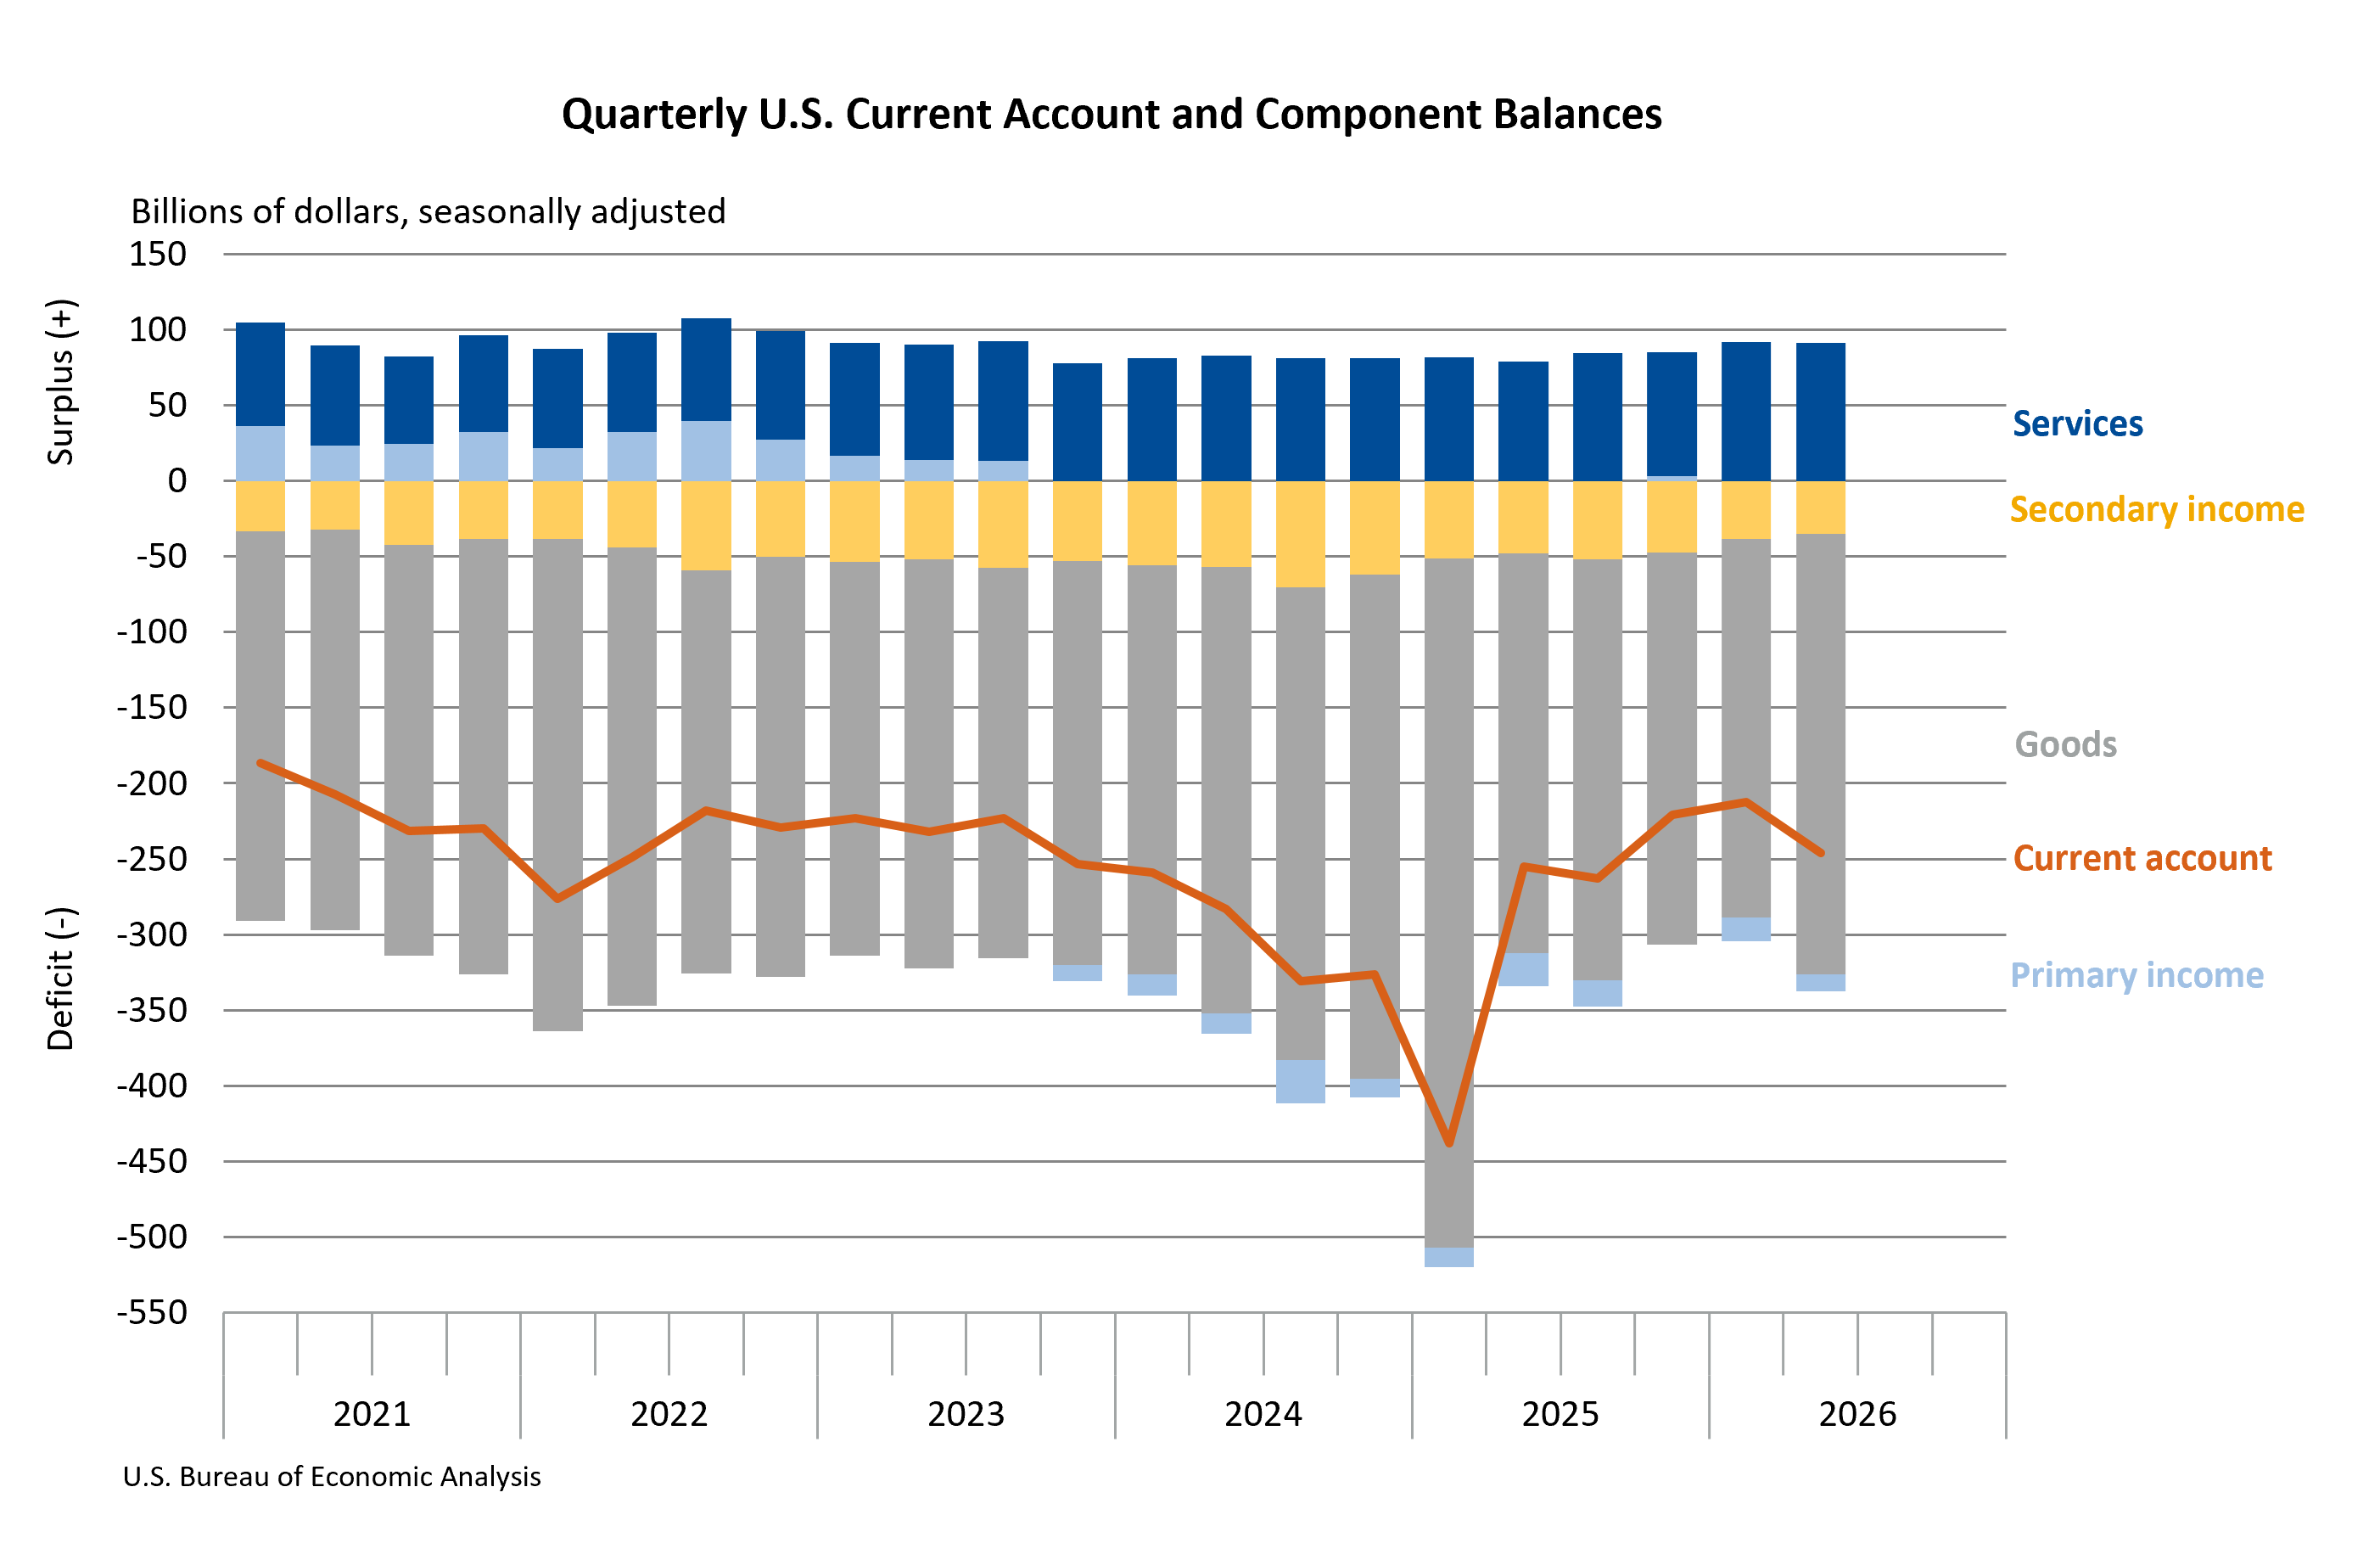
- Balance of Goods and Services: This reflects the value of goods and services exported by a country minus the value of goods and services imported. A deficit here means a country is importing more than it is exporting.
- Primary Income: This includes income earned by residents from their investments abroad (such as dividends and interest) and income earned by foreign residents from their investments in the U.S. It also includes compensation of employees.
- Secondary Income: This consists of current transfers between residents and non-residents, such as remittances, grants, and aid.
In the second quarter of 2026, the U.S. experienced an increase in both exports of goods and services and income received from foreign residents, totaling $1.44 trillion. This represented an increase of $58.8 billion. This rise was primarily fueled by gains in goods exports and an uptick in primary income receipts.
However, this positive movement was overshadowed by an even larger increase in imports of goods and services from, and income paid to, foreign residents. These outflows reached $1.69 trillion, an increase of $92.2 billion. The expansion in imports was largely attributed to greater imports of goods and increased primary income payments.
The deficit on goods, a significant contributor to the overall widening, saw a substantial increase. While the BEA’s release does not provide specific figures for the goods deficit in the second quarter, the report indicates it was the primary factor. The services balance, on the other hand, likely saw a surplus, as it typically does for the U.S., helping to mitigate some of the pressure from the goods deficit.
Primary and Secondary Income Balances Offer Partial Relief
The widening of the current-account deficit was somewhat tempered by a reduction in deficits on primary and secondary income. The primary income deficit decreased, indicating that income received by U.S. residents from their foreign investments either grew faster than income paid to foreign residents on their U.S. investments, or that payments abroad decreased. Similarly, the secondary income deficit also narrowed, suggesting an improvement in net current transfers received by the U.S.
Context: The U.S. Current Account Over Time
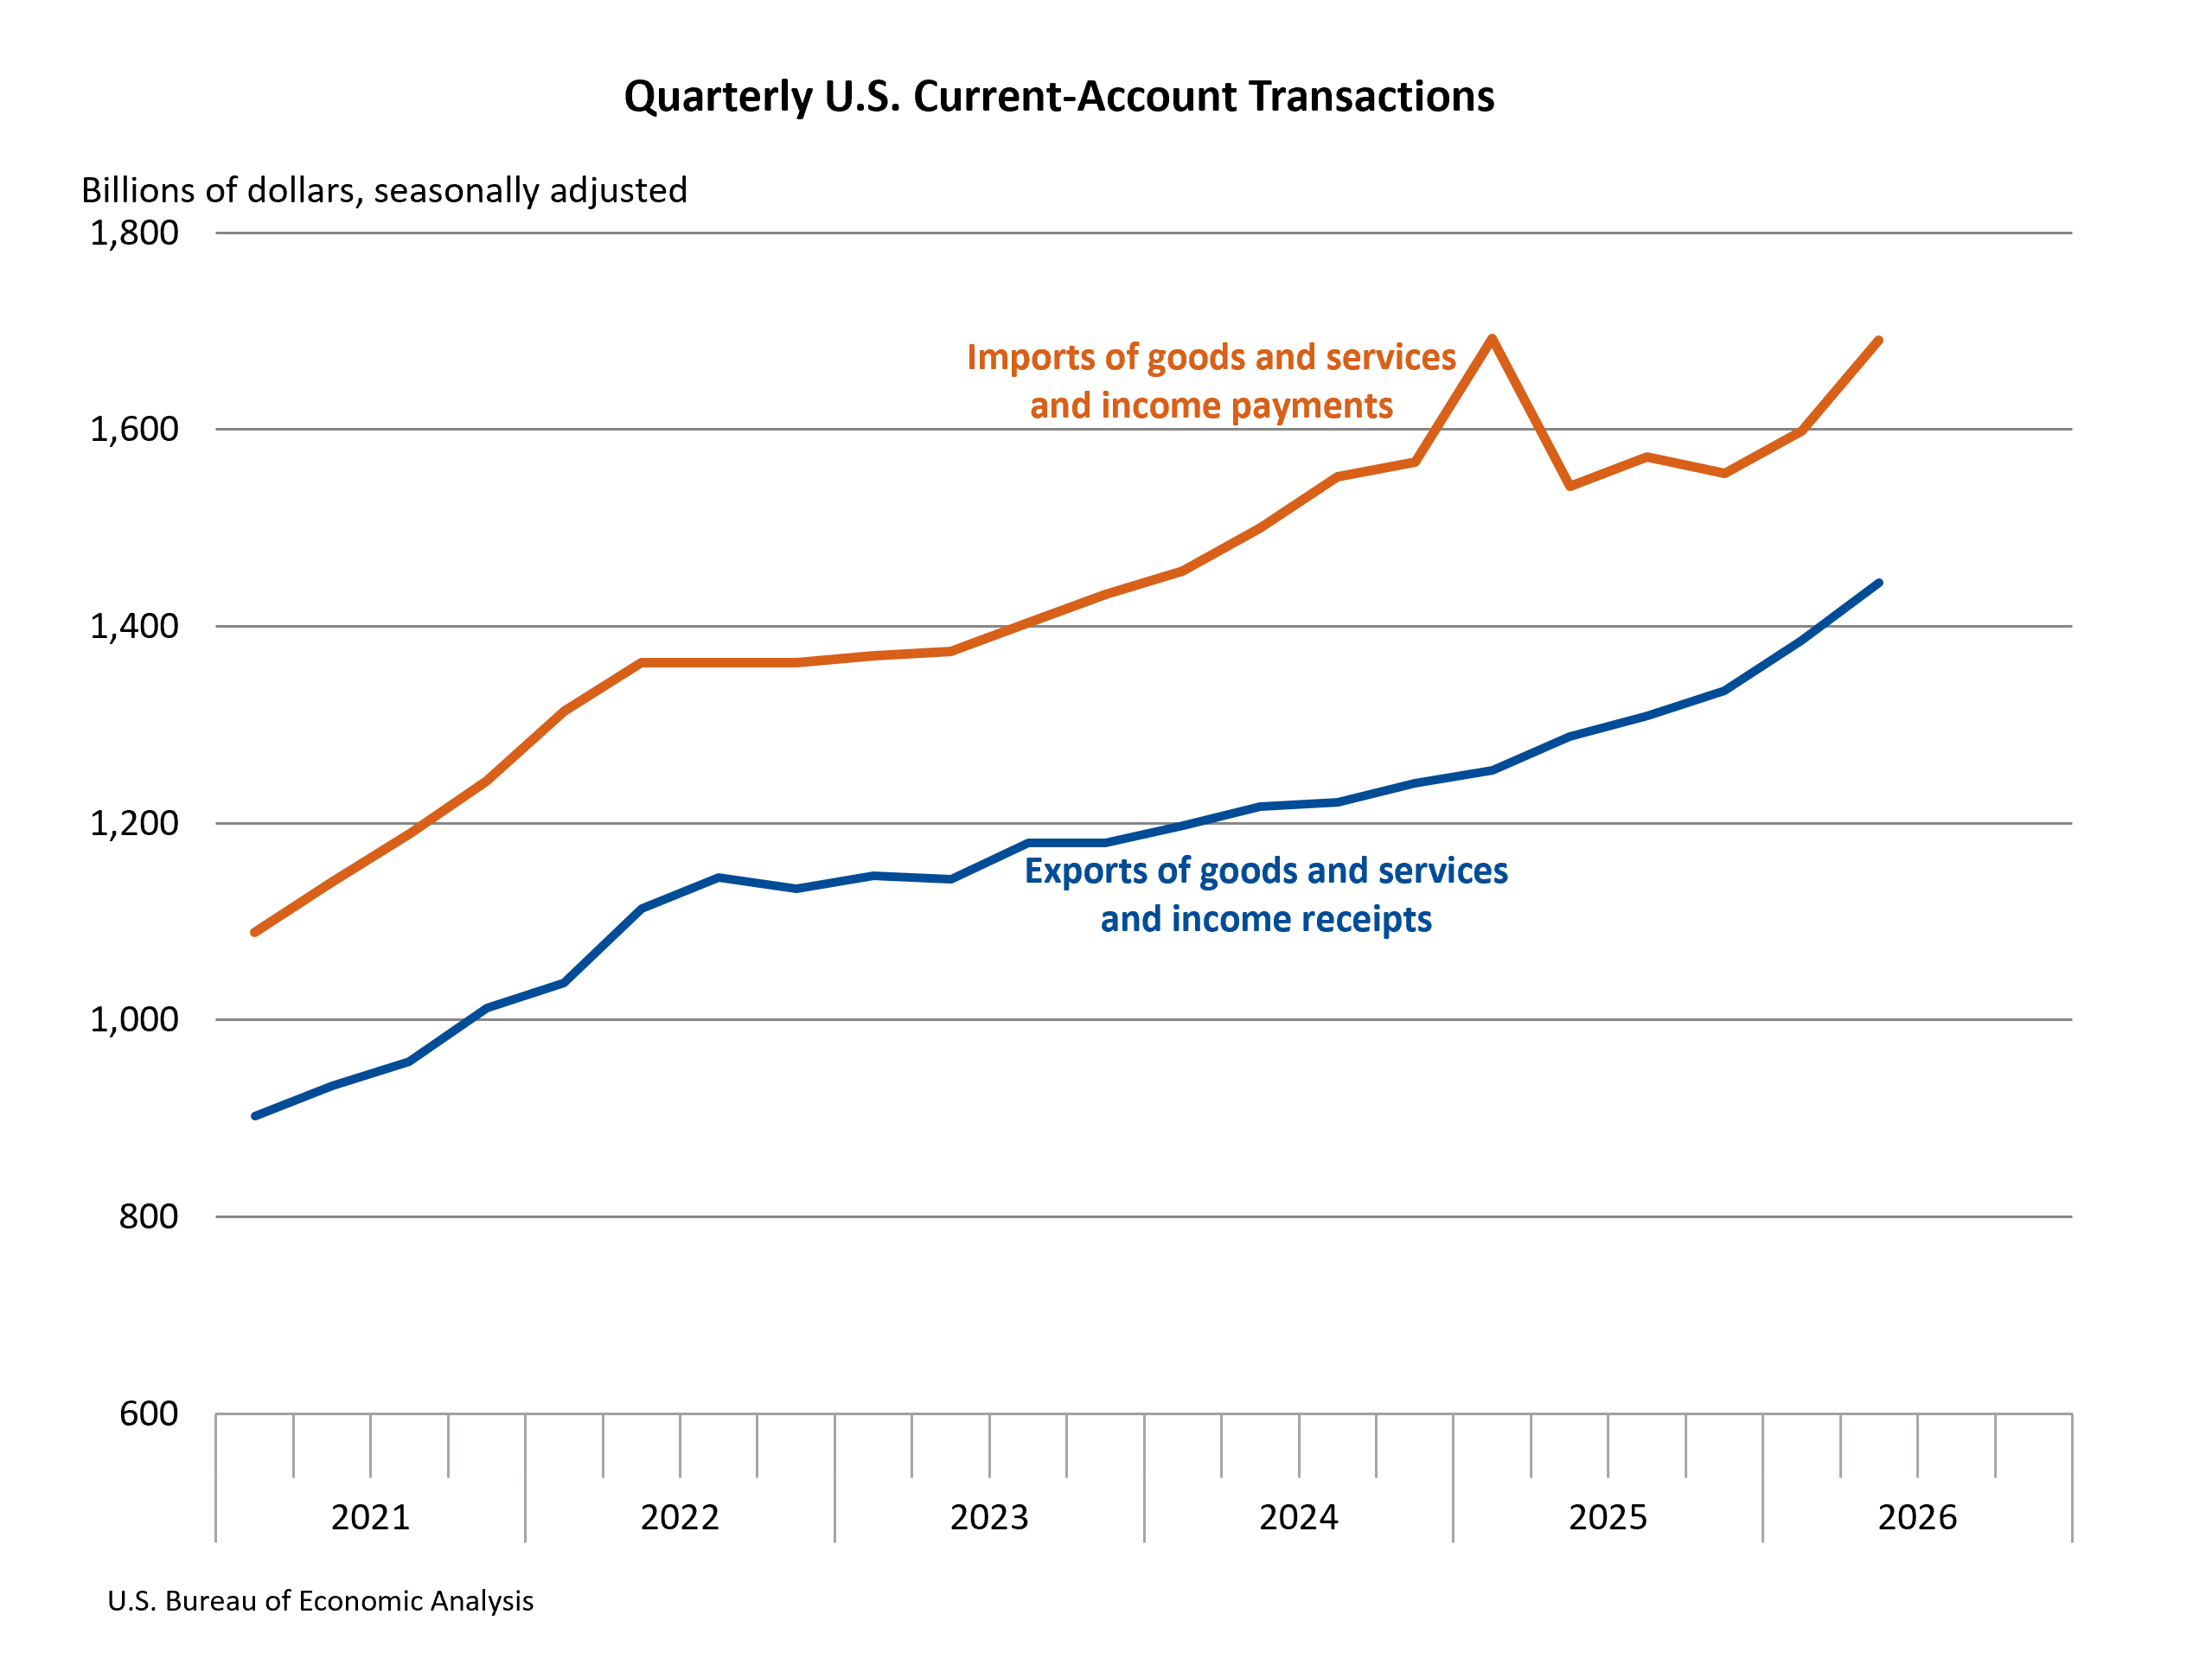
The U.S. has historically run current-account deficits, a phenomenon that has been a subject of economic debate for decades. These deficits are often linked to the U.S. dollar’s status as the world’s primary reserve currency and the attractiveness of U.S. assets to foreign investors. However, persistent and widening deficits can raise concerns about long-term sustainability, potentially leading to increased foreign ownership of U.S. assets and greater vulnerability to shifts in global capital flows.
Timeline and Revisions: A Look at Recent Trends
The BEA’s release provides crucial updates for the first quarter of 2026, highlighting the process of economic data refinement. Preliminary estimates for the first quarter showed a current-account deficit of -$226.8 billion. However, revised estimates revealed a slightly smaller deficit of -$212.6 billion. This revision was influenced by adjustments in the services balance and secondary income balance.
- First Quarter 2026 (Revised):
- Current-account balance: -$212.6 billion
- Goods balance: -$250.9 billion
- Services balance: $92.1 billion
- Primary income balance: -$15.8 billion
- Secondary income balance: -$38.0 billion
- Net financial-account transactions: -$295.2 billion
The preliminary estimates for the first quarter had indicated a net financial-account deficit of -$209.0 billion, which was revised upwards to -$295.2 billion. This revision underscores the dynamic nature of economic data and the importance of BEA’s ongoing efforts to provide the most accurate picture of the U.S. economy.
Financial Account: The Flip Side of the Current Account
The current account is intrinsically linked to the financial account, which records transactions involving financial assets and liabilities. A current-account deficit implies that a country is spending more on foreign goods, services, and income than it is earning from abroad. To finance this deficit, the country must either sell assets to foreigners or borrow from them, leading to a surplus in the financial account.
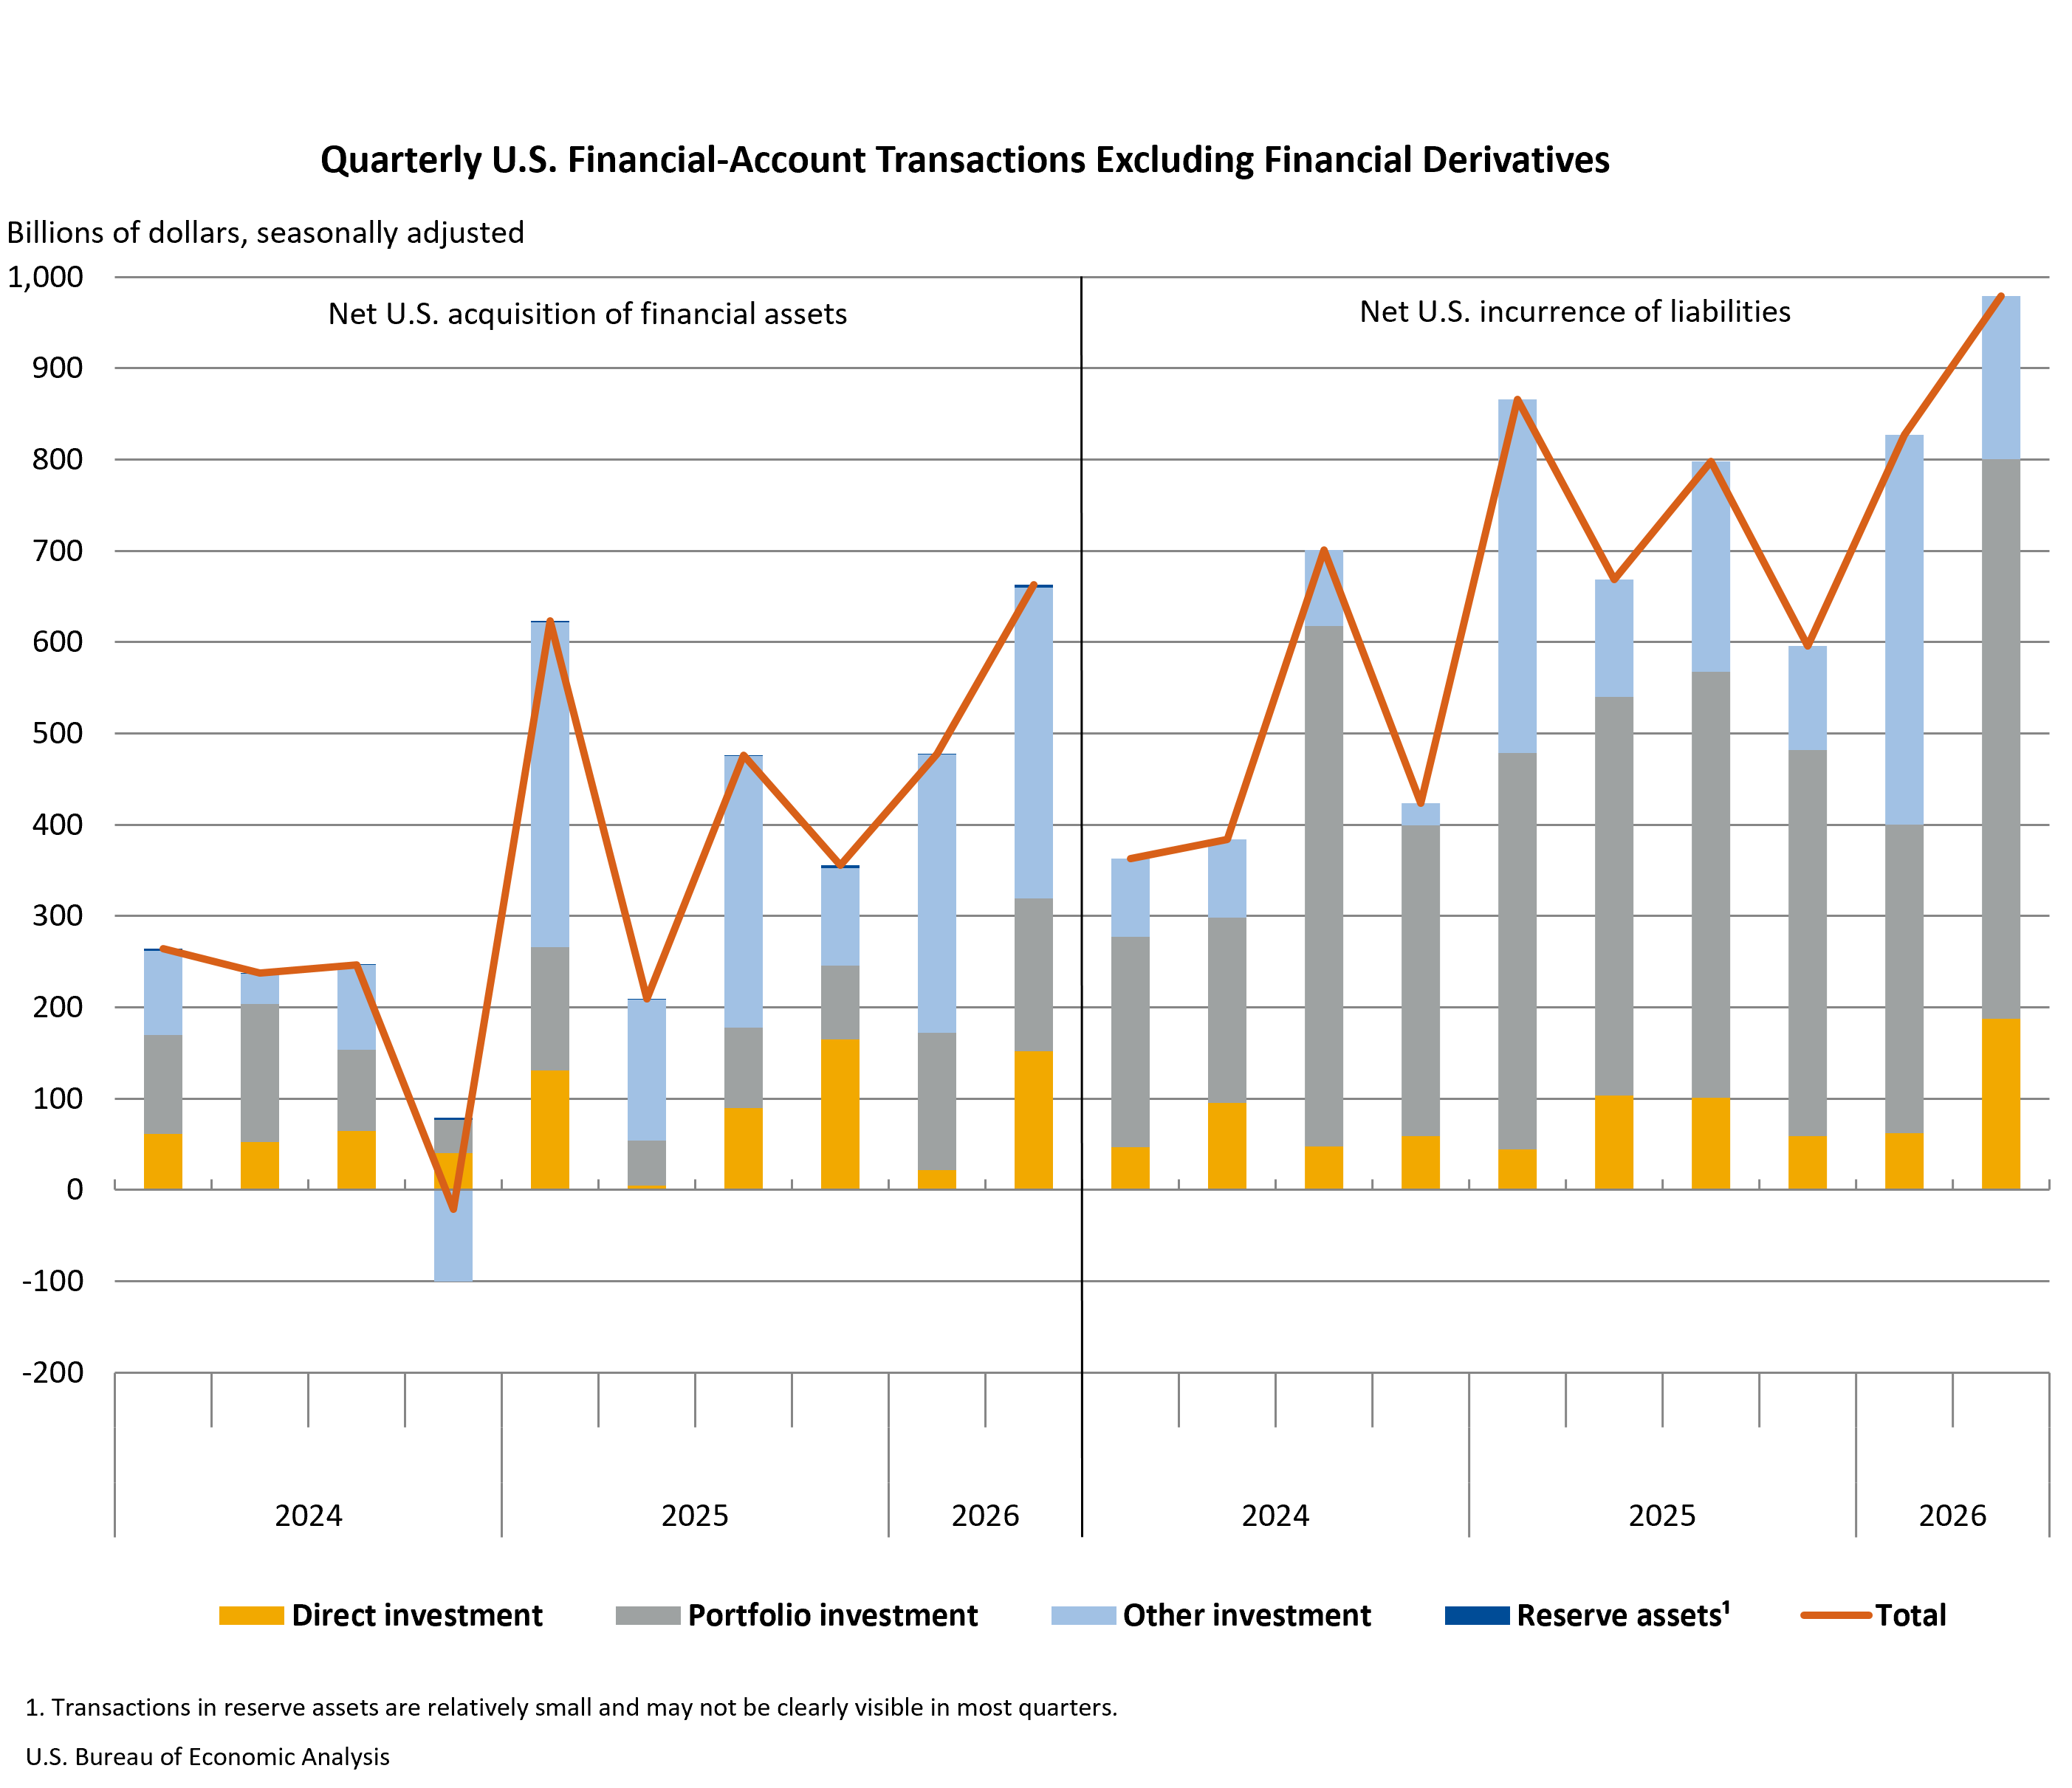
In the second quarter of 2026, net financial-account transactions were -$369.7 billion. This figure reflects net U.S. borrowing from foreign residents. During this period, U.S. residents increased their holdings of foreign financial assets by $663.3 billion, while U.S. liabilities to foreign residents rose by a larger $978.9 billion. This divergence signifies that foreigners were net lenders to the U.S. economy during the quarter, a necessary condition to finance the current-account deficit.
International Investment Position: A Snapshot of Foreign Holdings
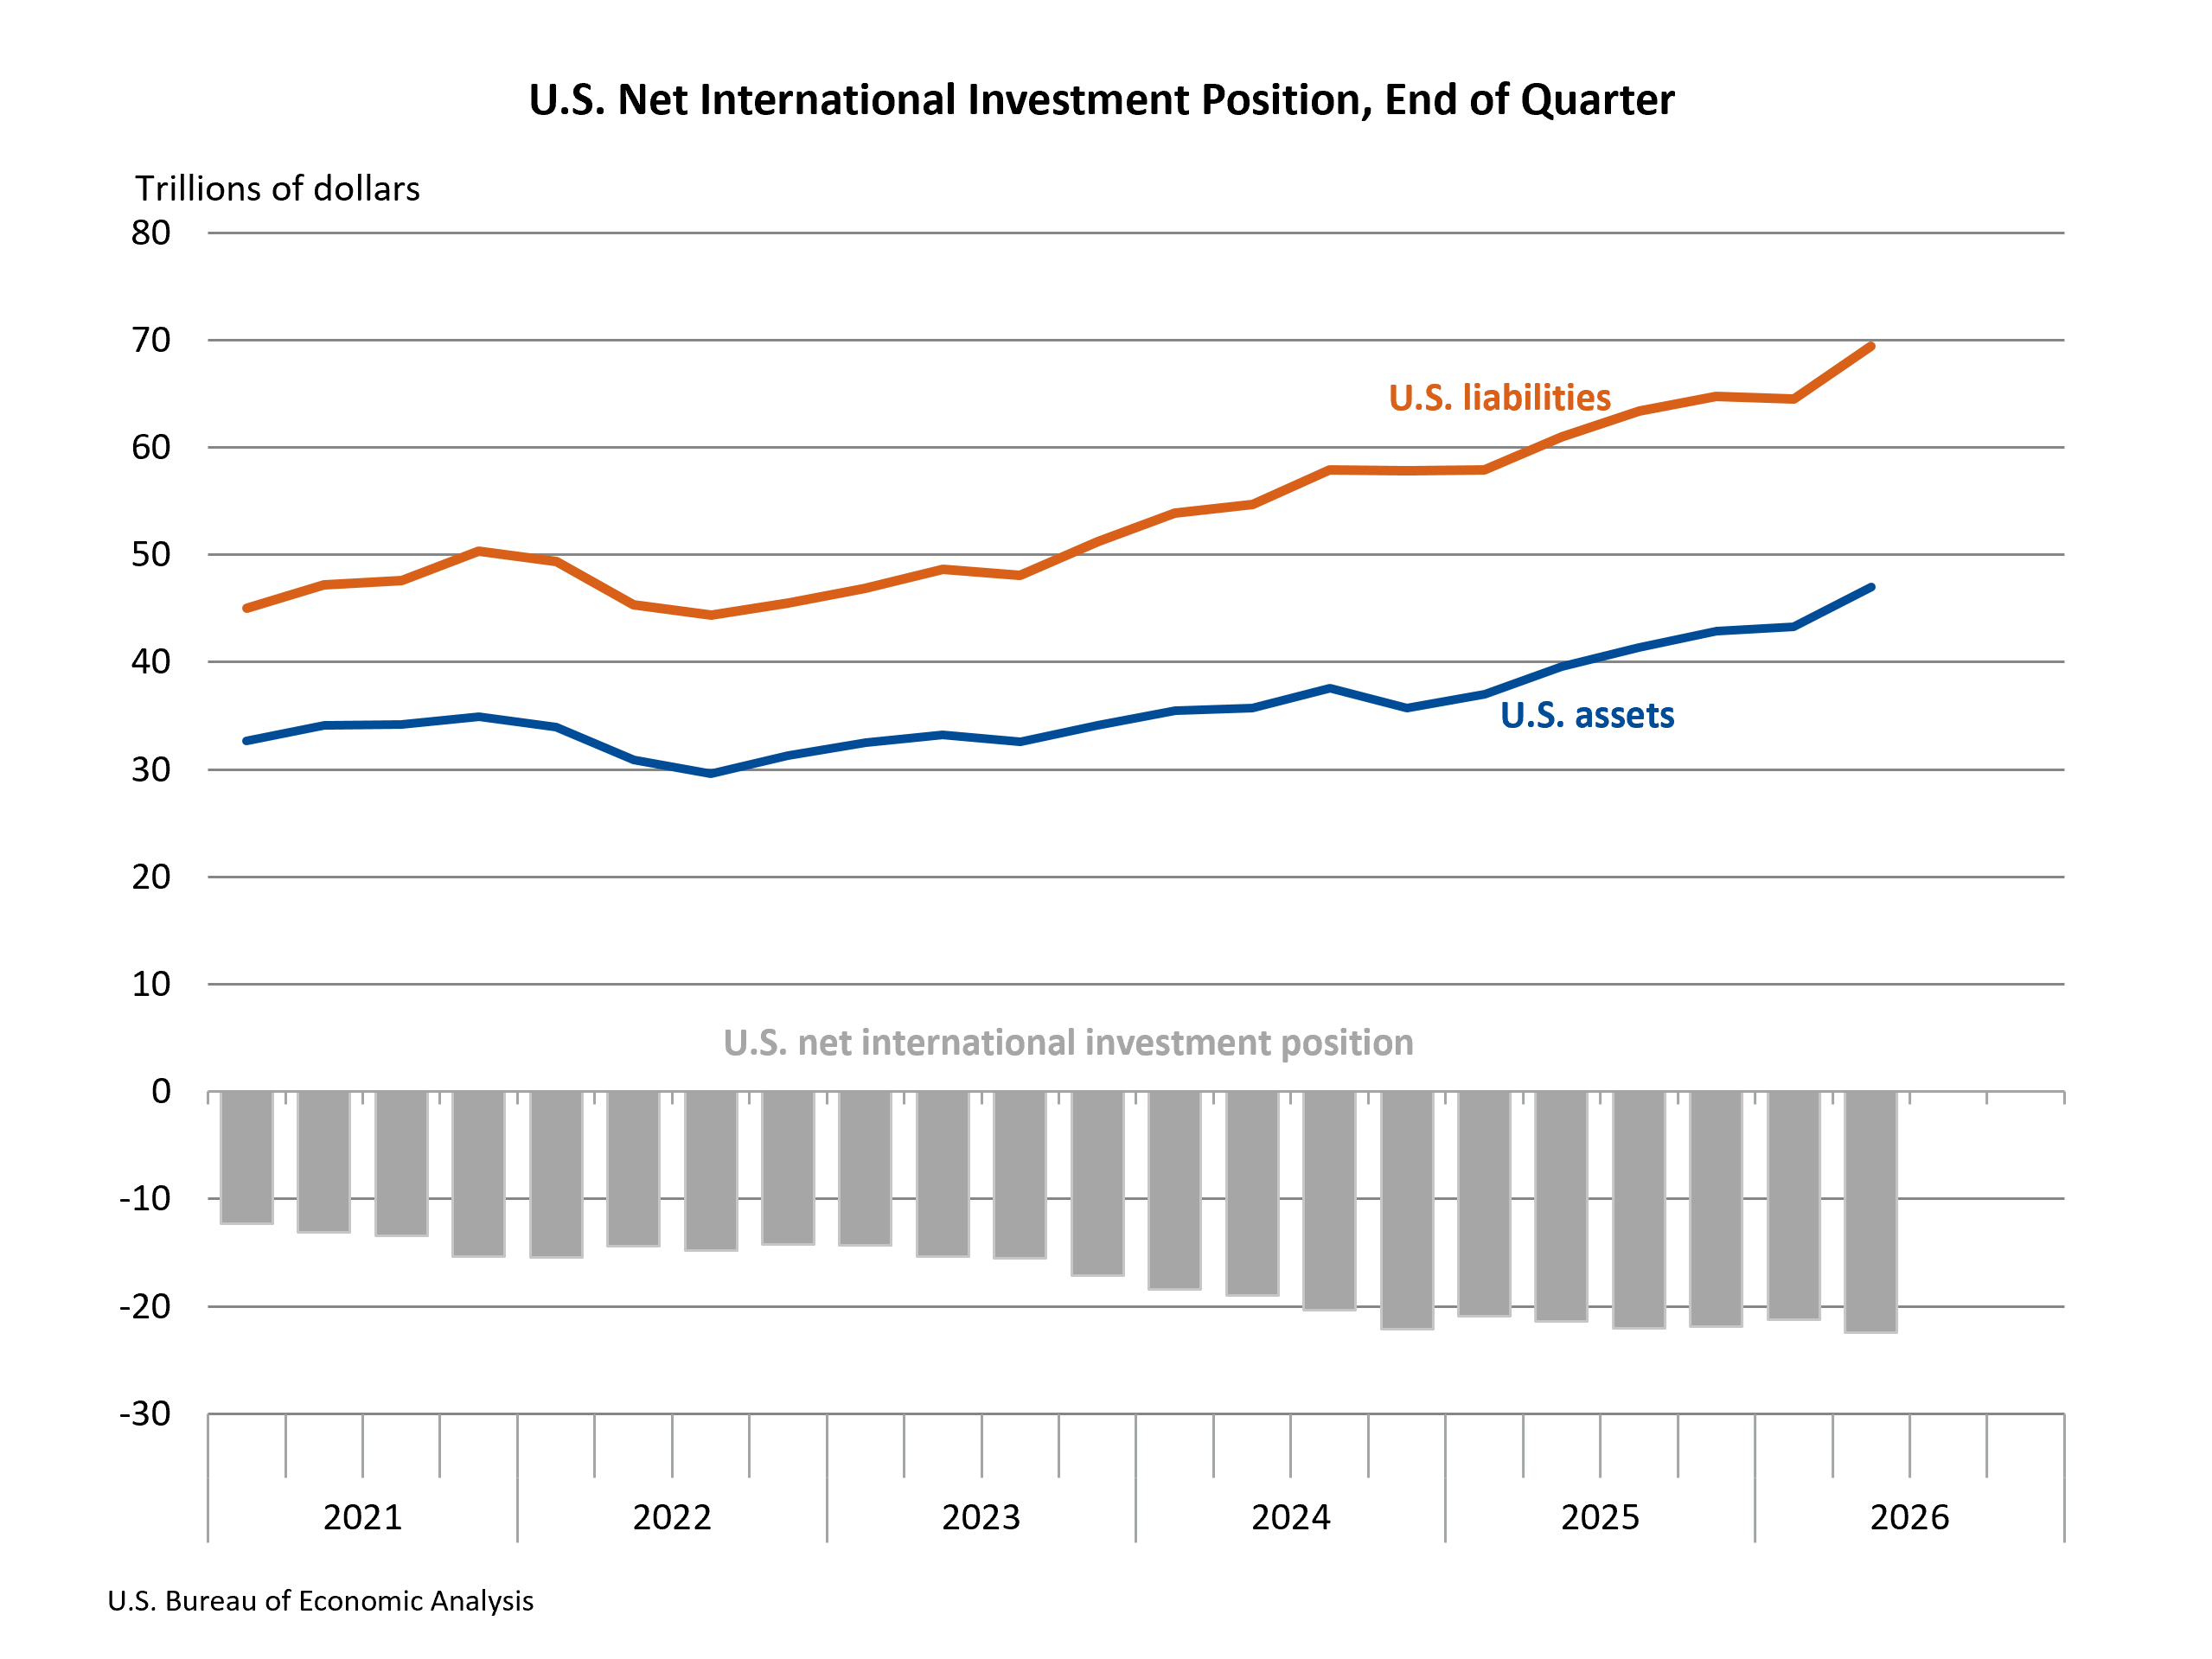
The net international investment position (IIP) provides a balance sheet of the U.S. economy’s international financial assets and liabilities at a specific point in time. At the end of the second quarter of 2026, the U.S. net international investment position stood at -$22.42 trillion. This means that U.S. liabilities to foreign residents exceeded U.S. assets held abroad.
U.S. assets abroad totaled $46.97 trillion, while U.S. liabilities to foreign residents amounted to $69.39 trillion. At the close of the first quarter of 2026, the net investment position was -$21.27 trillion (revised). The deterioration in the net IIP from the first to the second quarter reflects the widening current-account deficit and other valuation changes.
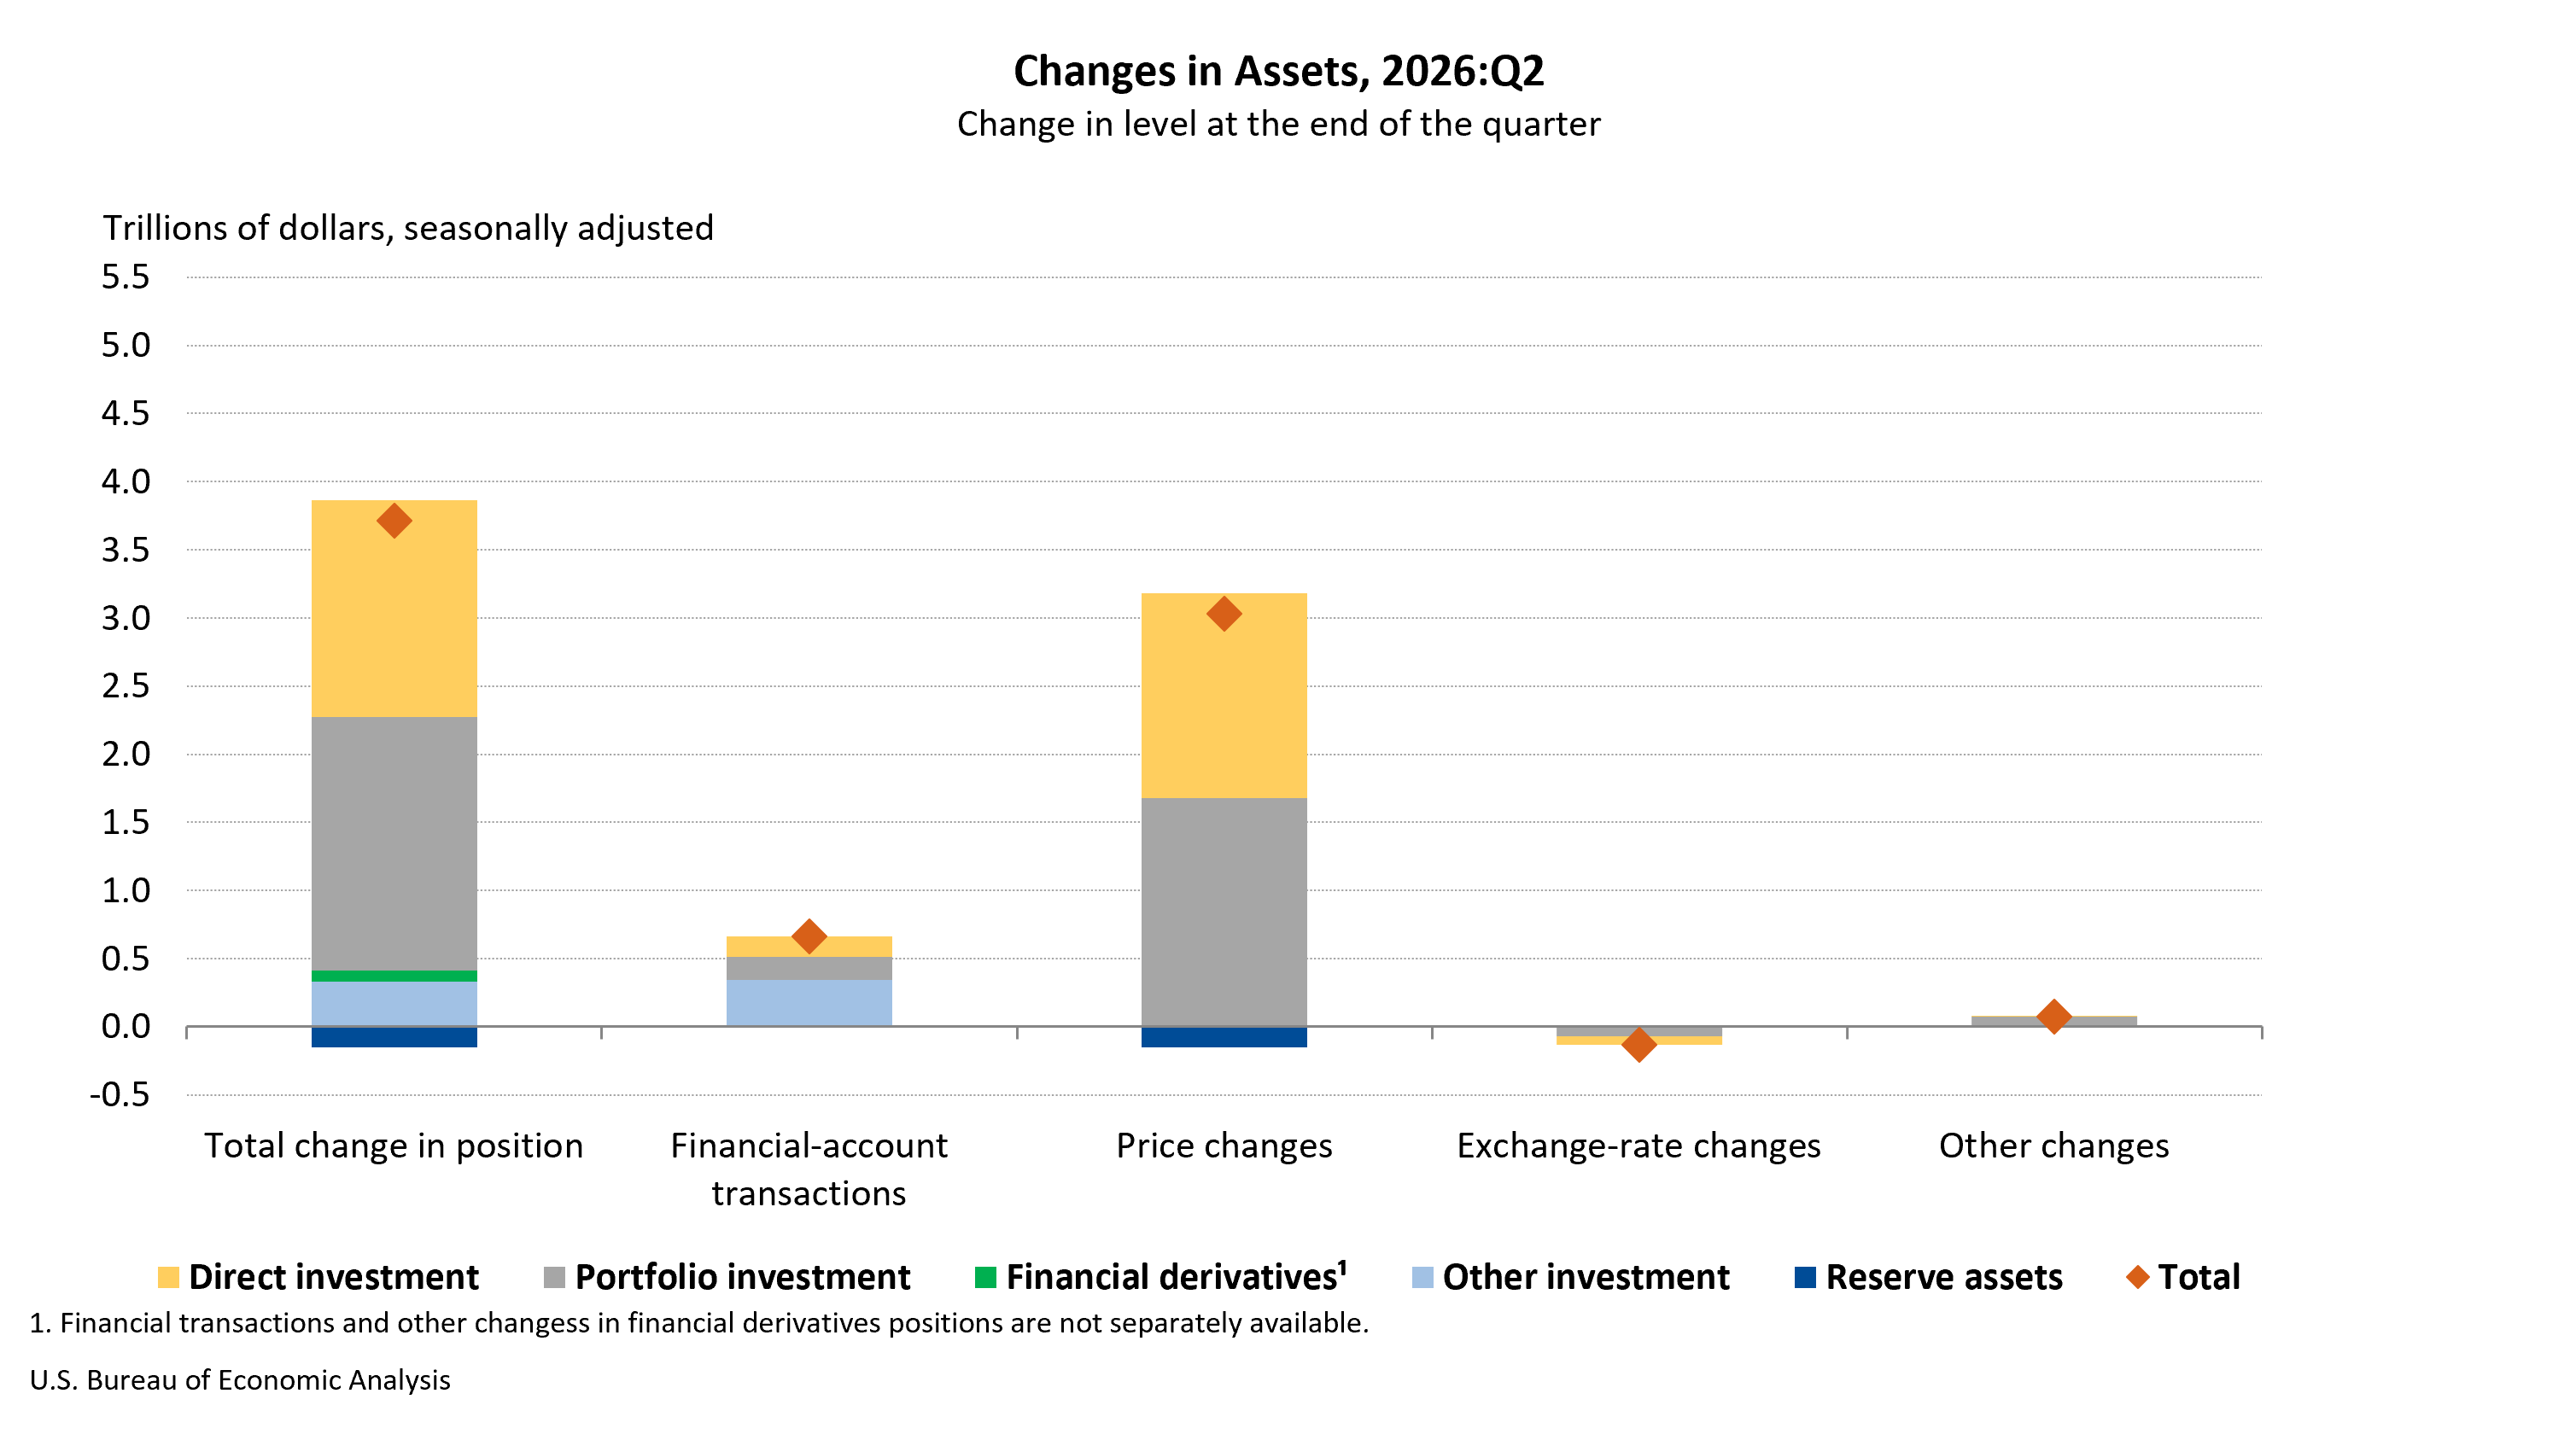
The increase in U.S. assets during the second quarter was substantial, rising by $3.72 trillion. This growth was driven by price changes (appreciation of foreign assets) totaling $3.03 trillion and financial transactions (net acquisitions of foreign assets) of $663.3 billion.
Conversely, U.S. liabilities also saw a significant increase, growing by $4.87 trillion. This surge was primarily fueled by price changes (appreciation of U.S. assets held by foreigners) amounting to $3.95 trillion, and financial transactions (net incurrence of liabilities to foreigners) of $978.9 billion. The larger increase in liabilities compared to assets contributed to the widening negative net international investment position.
Analysis and Potential Implications
The widening current-account deficit in the second quarter of 2026 raises several economic considerations:
- Dependence on Foreign Capital: The increased deficit underscores the U.S. reliance on foreign capital inflows to finance its consumption and investment. This dependence can make the U.S. economy more susceptible to global financial shocks or changes in foreign investor sentiment.
- Trade Dynamics: The prominent role of the goods deficit suggests ongoing challenges in U.S. export competitiveness or a strong domestic demand for imported goods. Policymakers may need to scrutinize trade policies and strategies aimed at boosting U.S. exports.
- Impact on Currency: Persistent current-account deficits, coupled with a growing net international investment liability, can exert downward pressure on the U.S. dollar over the long term. While the dollar’s reserve currency status provides a buffer, sustained imbalances could eventually impact its value and the cost of imports.
- Investment and Savings Balance: The current-account deficit is fundamentally a reflection of the balance between national savings and investment. A deficit implies that investment exceeds savings, which can be beneficial if the investment fuels productive capacity. However, if the deficit is driven by lower savings, it could indicate unsustainable consumption patterns.
Official Responses and Market Reactions (Inferred)
While the Bureau of Economic Analysis provides the data, government officials and economic analysts typically offer commentary following such releases. It is reasonable to infer that:
- The Treasury Department would likely acknowledge the figures, emphasizing that the U.S. remains an attractive destination for foreign investment and highlighting the role of capital inflows in supporting economic growth and job creation. They might also reiterate commitments to sound fiscal policies aimed at long-term economic stability.
- The Federal Reserve would monitor these trends as part of its broader assessment of economic conditions and its monetary policy decisions. While the current account is not a direct target of monetary policy, its implications for inflation, exchange rates, and financial stability are considered.
- Economists and Market Analysts would delve into the specific drivers of the deficit, examining the performance of various sectors and the impact of global economic conditions. Discussions would likely revolve around the sustainability of the deficit, potential policy responses, and the outlook for the U.S. dollar and its international role.
Looking Ahead: The Next Release
The BEA has announced that the next release of U.S. International Transactions and Investment Position statistics, covering the third quarter of 2026, is scheduled for December 18, 2026, at 8:30 a.m. EST. This upcoming release will supersede the second-quarter data and provide further insights into the ongoing evolution of the U.S. economy’s engagement with the global marketplace. Economic observers will be keenly awaiting these figures to gauge whether the widening deficit trend continues or if there are signs of moderation.
The BEA’s commitment to providing timely and accurate data through its Interactive Data Application and Data Archive ensures that researchers, policymakers, and the public have access to the information needed to understand and analyze these critical economic indicators. The ongoing updates and revisions underscore the complex and ever-changing nature of international economic transactions.