Lana Rhoades
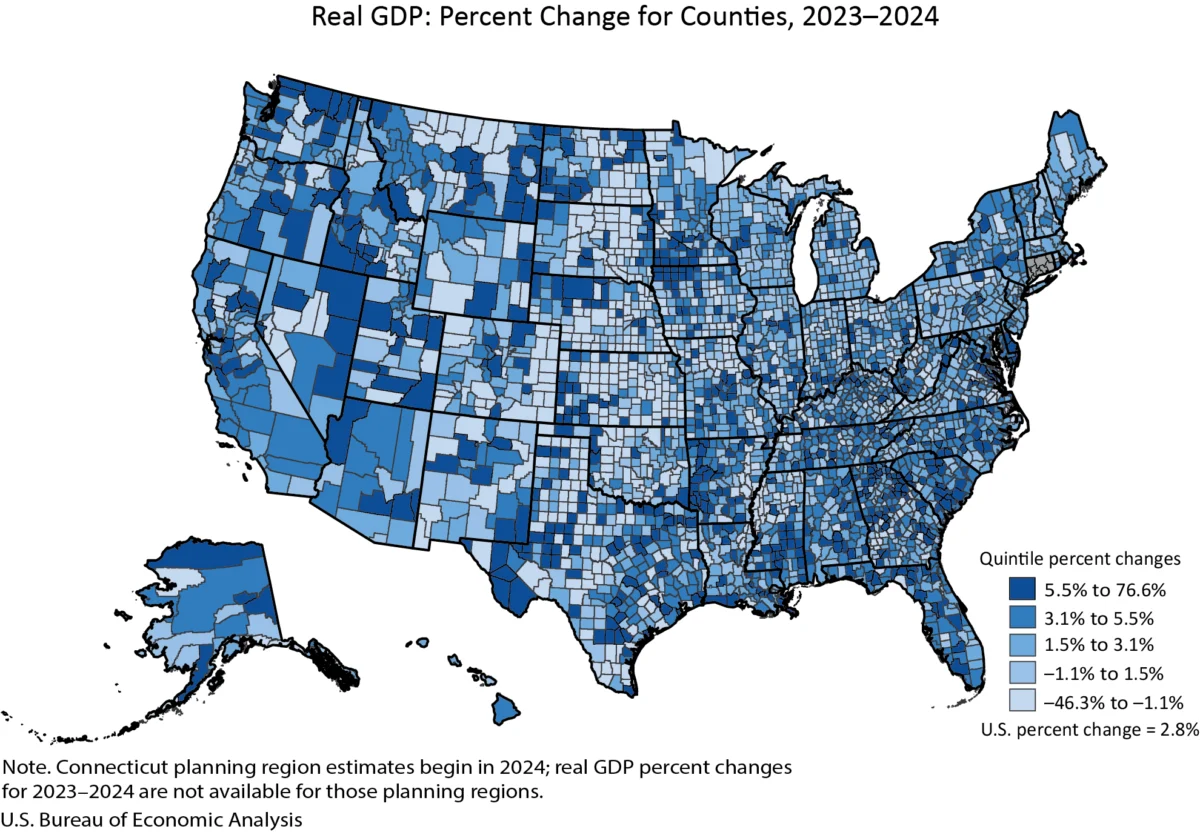
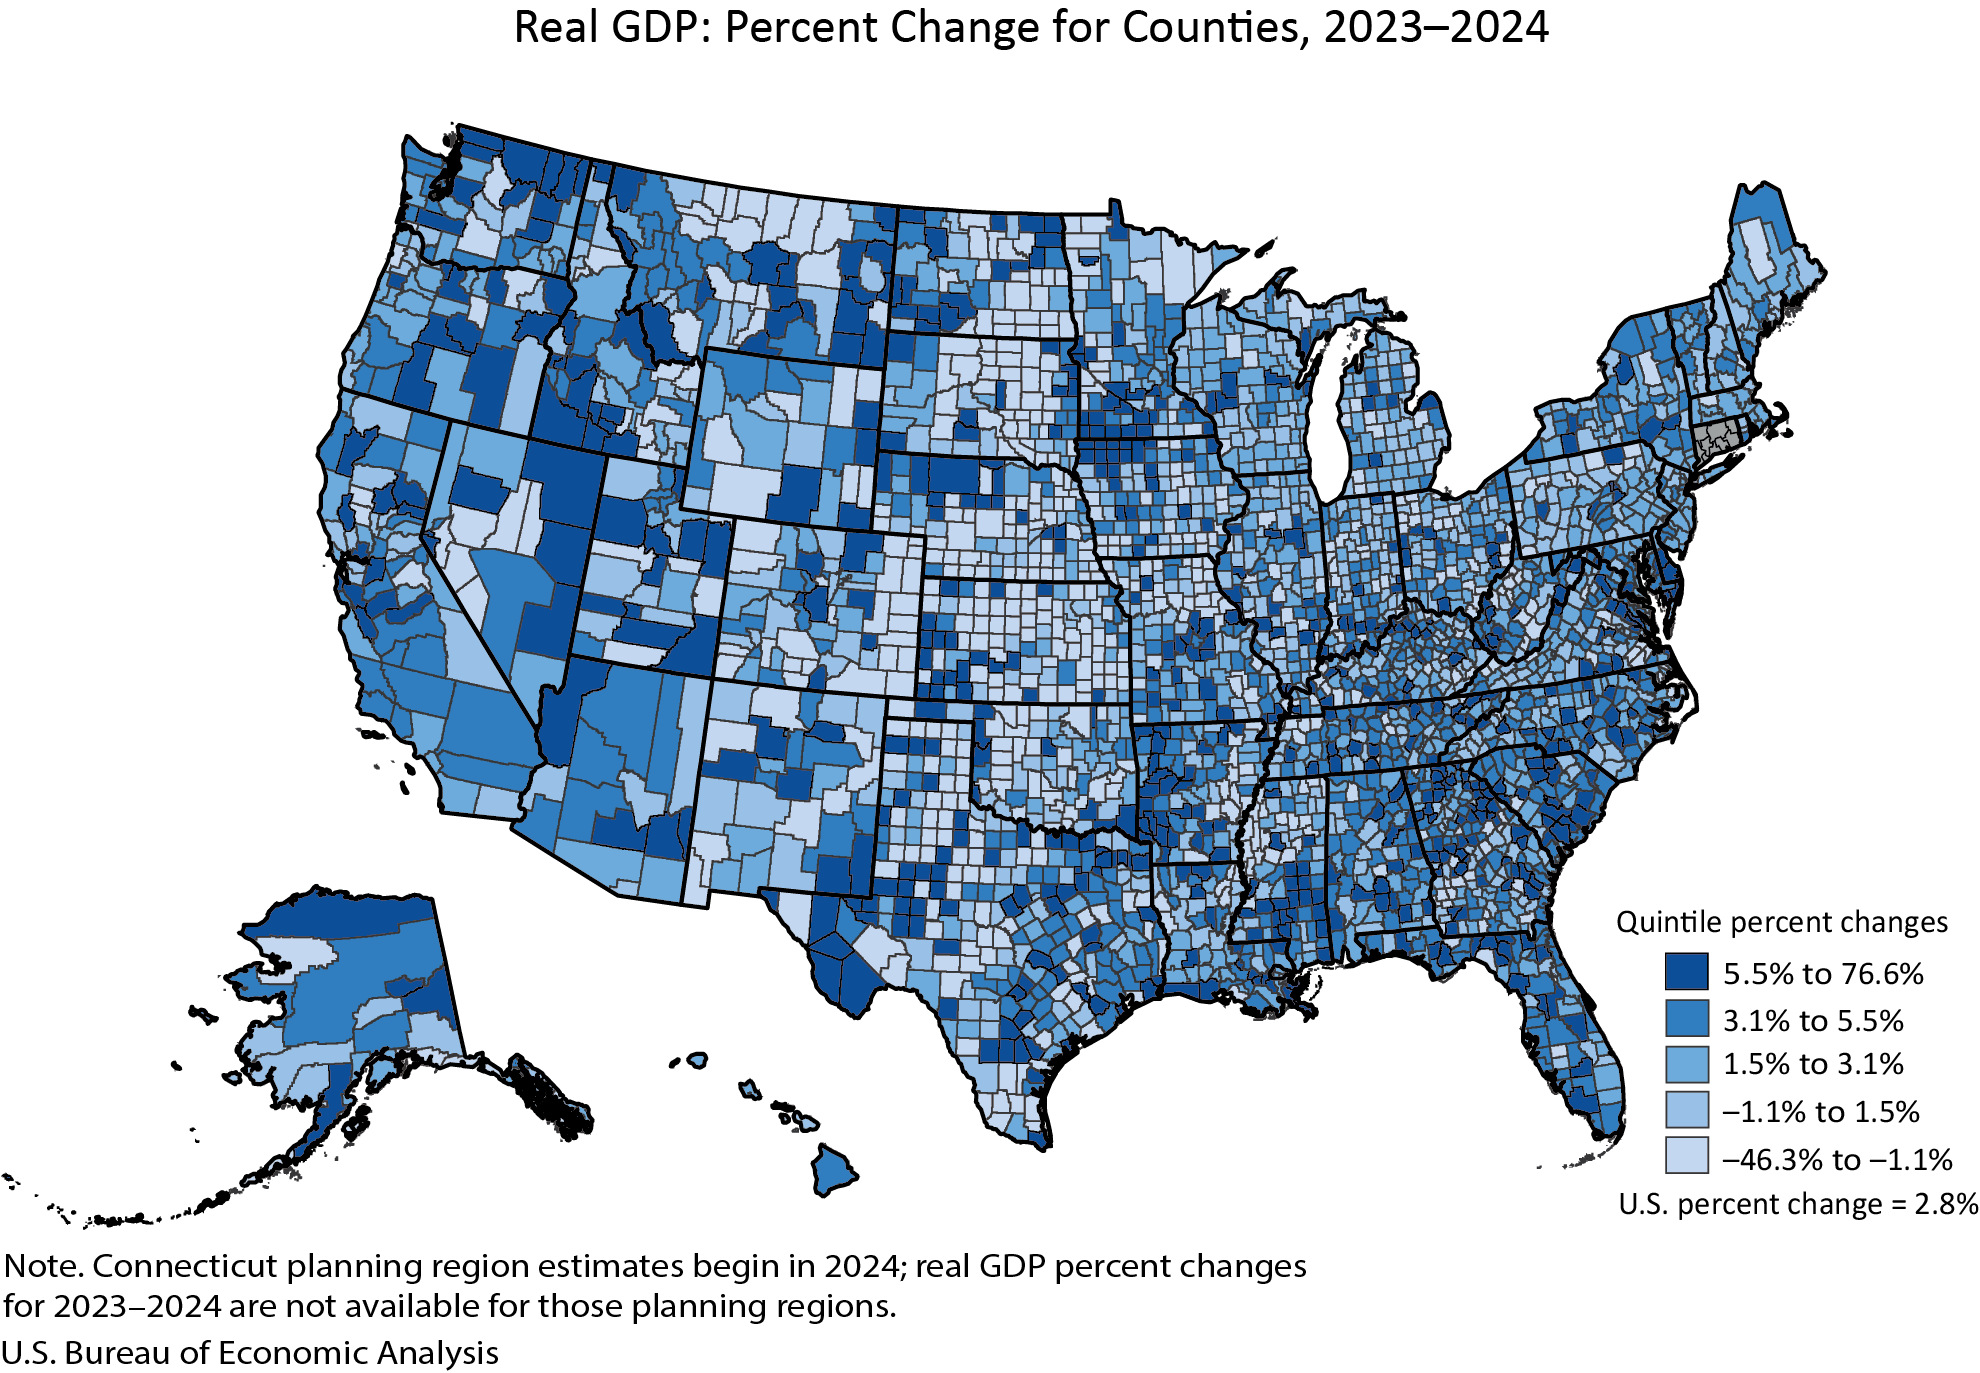
The economic landscape of the United States in 2024 presented a complex and varied picture at the county level, with nearly three-quarters of counties experiencing an increase in real gross domestic product (GDP), according to the latest estimates released by the U.S. Bureau of Economic Analysis (BEA). This broad-based growth, however, was juxtaposed against notable declines in hundreds of other counties, highlighting persistent regional disparities. In total, real GDP saw an increase in 2,273 counties, while 809 counties experienced a decrease, and 24 reported no change.
The magnitude of these economic shifts varied dramatically. The most striking growth was recorded in Carter County, Montana, which surged by an impressive 76.6 percent. Conversely, Baca County, Colorado, faced a significant economic contraction, with its real GDP declining by 46.3 percent. These outliers underscore the localized nature of economic performance and the diverse factors influencing growth and decline across the nation.
The BEA’s comprehensive report, which integrates GDP and personal income data for counties, offers a granular view of economic activity. This year marks a significant change in presentation, with the BEA combining these two crucial economic indicators into a single, unified news release for the first time. This consolidated approach aims to provide a more holistic understanding of county-level economic health, replacing previous separate releases.
County GDP: A Tale of Growth and Decline
The overall trend of GDP growth in 2024 was positive for a substantial majority of U.S. counties. This expansion is a testament to the resilience and adaptability of local economies, even amidst national economic uncertainties. The data reveals that 2,273 counties, representing approximately 73% of all counties, experienced an uptick in their real GDP. This widespread growth suggests a broad-based recovery or sustained expansion across various sectors of the American economy at the local level.
However, the economic narrative is not uniformly positive. A significant minority of counties, 809 in total, registered a decline in their real GDP. This figure, representing about 26% of all counties, points to ongoing economic challenges in certain regions. These declines could be attributed to a multitude of factors, including industry-specific downturns, demographic shifts, or the lingering effects of localized economic shocks. The remaining 24 counties reported no discernible change in their real GDP, indicating a period of economic stasis.
The sheer scale of economic output also varies immensely from one county to another. In 2024, New York County, New York (Manhattan), stood as the economic powerhouse, boasting a real GDP of $813.7 billion. This figure dwarfs the economic output of smaller counties, such as Issaquena County, Mississippi, which registered a real GDP of just $15.7 million. This vast disparity in economic scale highlights the uneven distribution of economic activity and wealth across the United States.
Breaking Down GDP Trends by County Size
The BEA’s analysis further segments economic performance by county population size, offering nuanced insights into how different types of communities are faring.
Large Counties (Population > 500,000): These economic centers, often home to major metropolitan areas, demonstrated robust growth. 145 large counties saw their real GDP increase, with Pinal County, Arizona, leading the pack with a remarkable 10.7% expansion. No large counties experienced a decline, and only one reported no significant change, underscoring the economic stability and capacity for growth often found in more populous regions. The economic output in these counties is substantial, with New York County, NY, leading at $813.7 billion. Even smaller large counties, like Pinal County, AZ, still command significant economic activity, with its GDP measured at $12.7 billion.
Medium Counties (Population 100,000 to 500,000): This group also exhibited predominantly positive economic trends. 451 medium-sized counties experienced GDP growth. Jefferson County, Texas, stood out with a 12.4% increase in its real GDP. A smaller number, 20 counties, saw their economies contract, and 3 reported no change. The economic scale in medium counties ranges from $46.6 billion in Mercer County, New Jersey, to $2.6 billion in Liberty County, Texas.
Small Counties (Population < 100,000): This category, encompassing the vast majority of U.S. counties, displayed the widest range of economic performance. A total of 1,677 small counties experienced GDP growth, with Carter County, Montana, demonstrating the most exceptional surge at 76.6%. However, this group also bore the brunt of economic contractions, with 789 counties seeing their GDP decline. Baca County, Colorado, recorded the most significant drop at -46.3%. The economic output in small counties varies greatly, from $15.1 billion in Martin County, Texas, down to $15.7 million in Issaquena County, Mississippi.
Personal Income Trends Mirror GDP Dynamics
Beyond GDP, personal income serves as another crucial barometer of economic well-being at the individual and community level. In 2024, personal income also showed a predominantly positive trend across U.S. counties. A total of 2,768 counties, representing an even larger proportion than GDP growth, saw an increase in personal income. This suggests that while GDP measures the total value of goods and services produced, personal income growth indicates that individuals in many areas benefited from increased earnings.
Conversely, 331 counties experienced a decrease in personal income, and 7 reported no change. The range of personal income changes was also significant, though generally less extreme than GDP fluctuations. Harding County, South Dakota, recorded the highest personal income growth at 22.6%, while Issaquena County, Mississippi, faced the steepest decline at -23.3%.
The distribution of personal income also reflects significant economic stratification across counties. Los Angeles County, California, led the nation with a total personal income of $818.5 billion. At the other end of the spectrum, Loving County, Texas, had a total personal income of $10.6 million.
Personal Income Performance by County Size
Similar to GDP, personal income trends were analyzed by county population size:
Large Counties (Population > 500,000): 146 large counties reported an increase in personal income. San Joaquin County, California, saw the highest growth at 9.7%, while Philadelphia County, Pennsylvania, experienced a lower but still positive growth of 2.7%. No large counties reported a decline in personal income. The highest personal income levels are concentrated in these counties, with Los Angeles County, CA, at $818.5 billion and Pinal County, AZ, at $26.1 billion.
Medium Counties (Population 100,000 to 500,000): 474 medium-sized counties experienced an increase in personal income. Merced County, California, led this group with a 10.9% increase, followed by Genesee County, Michigan, with 1.6%.
Small Counties (Population < 100,000): The most substantial variations in personal income growth were observed in smaller counties. Harding County, South Dakota, saw a notable 22.6% increase. However, this category also included the largest number of counties experiencing declines, with Issaquena County, Mississippi, facing a significant -23.3% drop. Small counties show a broad range of economic scale, from $12.4 billion in Teton County, Wyoming, to $10.6 million in Loving County, Texas.
Methodological Updates and Data Presentation Shifts
The BEA’s release of the 2024 county statistics incorporates important methodological updates and changes in data presentation. The estimates for 2024 are informed by the BEA’s annual updates to GDP and personal income by county, which also involved revisions to data from 2020 to 2023. These revisions integrate more comprehensive source data and align county-level figures with the national income and product accounts and state-level statistics released in late September 2025.
A significant geographical change involves Connecticut. Beginning with the 2024 estimates, Connecticut’s data will be presented based on its planning region definitions rather than county boundaries. As these planning region estimates are only available for 2024, they have been excluded from the percent change calculations for consistency.
Furthermore, the BEA has introduced a new combined news release format for county GDP and personal income statistics. This aims to streamline the dissemination of information and provide a more integrated view of local economies. The practice of publishing separate releases on different days has been discontinued.
In a notable shift impacting regional analysis, the BEA has ceased the publication of statistics for metropolitan statistical areas (MSAs), micropolitan statistical areas, metropolitan divisions, combined statistical areas, and their metropolitan and nonmetropolitan portions. The focus will now be exclusively on county-level data for GDP and personal income. This decision, detailed in an FAQ on the BEA website, reflects a strategic realignment of reporting priorities.
The presentation of data tables has also evolved. Data previously embedded within the news releases are now exclusively available through BEA’s Interactive Data Application. This move is intended to reduce redundancy, enhance efficiency, and direct users to the agency’s most flexible and comprehensive data resources. These online tables allow for customization, full time series retrieval, and various download options, including PDF, Excel, and CSV formats.
Broader Implications and Future Outlook
The divergence in economic performance across U.S. counties in 2024 raises important questions about regional development strategies and the equitable distribution of economic prosperity. While many counties are experiencing growth, the significant number of those facing decline suggests that targeted interventions and support mechanisms may be necessary to foster broader economic resilience.
The discontinuation of MSA-level data and the increased emphasis on county-level statistics could influence how researchers, policymakers, and businesses analyze regional economies. Understanding economic trends at the county level can provide a more granular perspective, potentially revealing localized strengths and weaknesses that might be obscured in broader metropolitan aggregates.
The BEA’s commitment to updating and refining its data, as evidenced by the revisions to past years’ data and the incorporation of new source information, ensures that the statistics remain a reliable foundation for economic analysis. The agency’s forward-looking approach, including the regular release of per capita personal income data calculated with U.S. Census Bureau population figures, further enhances the utility of its economic indicators.
The next release of county GDP and personal income statistics is scheduled for December 2, 2026, covering the 2025 data. This ongoing series of reports will continue to chart the evolving economic geography of the United States, providing essential insights into the diverse fortunes of its counties. The BEA’s archived data will remain a valuable resource for historical comparisons and in-depth research.
The BEA’s announcement also included links to specific interactive data tables for county GDP and personal income, allowing users to delve deeper into the granular data. These tables provide percentage changes from preceding periods and the absolute levels of GDP and personal income, offering a comprehensive toolkit for economic analysis. The agency also points to its "Additional Information" section for definitions, statistical conventions, and other crucial context for understanding the presented data. This commitment to transparency and accessibility underscores the BEA’s role as a primary source of U.S. economic intelligence.