Lana Rhoades
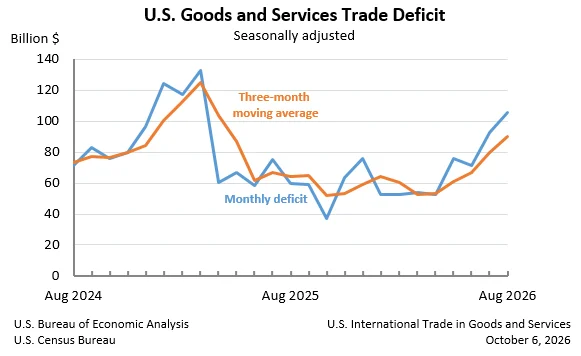
The United States experienced a substantial widening of its trade deficit in goods and services for August, reaching $105.6 billion, an increase of $12.7 billion from the revised $92.8 billion deficit recorded in July. This marks a significant shift in the nation’s international trade balance, with imports outpacing exports at a faster rate. The latest figures, jointly released by the U.S. Census Bureau and the U.S. Bureau of Economic Analysis, highlight a growing demand for foreign goods and a robust, albeit slower, expansion in U.S. exports.
August Trade Dynamics: A Deep Dive into the Numbers
In August, total exports of goods and services rose by $4.5 billion to $315.2 billion. This increase was primarily driven by a $4.4 billion uptick in goods exports, reaching $205.7 billion, while services exports saw a more modest gain of less than $0.1 billion, totaling $109.5 billion. On the import side, the picture was starkly different. Total imports of goods and services surged by $17.2 billion to $420.8 billion. The lion’s share of this increase came from goods imports, which jumped by $17.2 billion to $342.2 billion, while services imports edged up by less than $0.1 billion to $78.5 billion.
The widening deficit was predominantly fueled by an increase in the goods deficit, which expanded by $12.8 billion to $136.6 billion in August. Conversely, the surplus in services narrowed slightly, decreasing by less than $0.1 billion to $31.0 billion. This divergence underscores the significant role that the trade in physical goods plays in the overall balance of payments.
A Shift in Momentum: Comparing August to Previous Periods
While the monthly figures paint a picture of a widening deficit, a broader year-to-date perspective reveals a different narrative. For the period from January through August, the cumulative goods and services deficit actually decreased by $138.2 billion, or 19.9 percent, compared to the same period in the previous year. During this year-to-date period, U.S. exports saw a substantial increase of $267.7 billion, representing an 11.8 percent growth. Imports, while also increasing, grew at a more measured pace of $129.5 billion, or 4.4 percent. This suggests that while August presented a temporary setback, the underlying trend for the year has been one of improved export performance relative to import growth, leading to a shrinking overall deficit for the year to date.
The Impact of Inflation and Real Trade Figures
The reported trade figures are adjusted for seasonal variations but not for price changes, meaning they reflect nominal values. To gain a clearer understanding of the volume of goods traded, the report also provides data on real goods in 2017 dollars on a Census basis. In August, the real goods deficit increased by $8.7 billion, or 8.2 percent, to $114.7 billion. This growth in the real deficit was slightly less pronounced than the 11.1 percent increase in the nominal goods deficit, indicating that some of the widening in nominal terms can be attributed to rising prices of imported goods.
Three-Month Moving Averages: Smoothing Out Volatility
To mitigate the impact of monthly fluctuations, the report also examines three-month moving averages. For the three months ending in August, the average goods and services deficit increased by $9.9 billion to $89.9 billion. This smoothed figure also indicates a worsening trend over the recent past. Looking at the year-over-year trend for these three-month averages, the deficit increased by $25.4 billion for the period ending in August, compared to the three months ending in August of the previous year. This suggests that while the year-to-date trend has been positive, the most recent three-month period has seen a deterioration in the trade balance.
Key Trading Partners: A Look at Surpluses and Deficits
The report provides a detailed breakdown of trade balances with specific countries and regions. In August, the U.S. recorded trade surpluses with several key partners. Notable among these were the Netherlands ($7.7 billion), South and Central America ($5.6 billion), the United Kingdom ($3.6 billion), Hong Kong ($2.3 billion), Brazil ($1.3 billion), Belgium ($1.2 billion), Australia ($0.6 billion), and Saudi Arabia ($0.4 billion).
However, significant deficits were also recorded with a number of major trading nations. Mexico continued to be the largest source of deficit, with $27.7 billion in August. Vietnam followed with a deficit of $24.0 billion, and Taiwan with $18.3 billion. China also contributed significantly to the deficit, with $16.4 billion. Other notable deficits were with the European Union ($11.0 billion), South Korea ($9.4 billion), Canada ($7.1 billion), India ($6.2 billion), Germany ($6.2 billion), Malaysia ($6.0 billion), Italy ($4.3 billion), Japan ($3.7 billion), Ireland ($2.5 billion), France ($1.4 billion), Israel ($0.8 billion), Switzerland ($0.4 billion), and Singapore ($0.3 billion).
These figures highlight the complex and multifaceted nature of U.S. international trade, with significant bilateral imbalances that contribute to the overall deficit. The persistent large deficits with certain Asian economies and the European Union underscore ongoing structural trade dynamics.
Background and Context: Understanding the Trade Deficit
The U.S. trade deficit, the difference between the value of a nation’s exports and its imports, is a closely watched economic indicator. A persistent and widening deficit can have several implications for an economy. It can suggest that a country is consuming more than it produces, potentially leading to increased foreign debt. It can also impact domestic industries, as increased competition from imports may affect employment and investment. Conversely, a trade deficit can also reflect strong domestic demand and investment, as well as the attractiveness of a country’s market to foreign producers.
The U.S. has historically run a trade deficit in goods, often offset by a surplus in services. However, the sheer volume of goods imports means that the goods deficit has typically been larger than the services surplus, leading to an overall deficit. Factors influencing the trade balance include global economic growth, exchange rates, trade policies, consumer demand, and the competitiveness of domestic industries.
The August figures represent a notable reversal from the trend observed for the year to date, which had shown a reduction in the deficit. This widening in August is likely a reflection of a combination of factors, including strong consumer demand for imported goods, potentially higher commodity prices, and the ongoing dynamics of global supply chains.
Potential Implications and Analysis
The widening of the U.S. trade deficit in August could have several implications. From a macroeconomic perspective, a larger deficit means that more money is flowing out of the country than is coming in through trade, which could contribute to a widening current account deficit. This, in turn, could put downward pressure on the U.S. dollar over the longer term, although other factors such as capital flows also play a significant role.
For domestic industries, the increase in imports, particularly in goods, could pose challenges for U.S. manufacturers facing heightened competition. However, it also indicates robust consumer spending, a key driver of economic growth. The increase in exports, while positive, did not keep pace with the rise in imports, suggesting that the U.S. may be experiencing a stronger recovery or demand for imported goods compared to the demand for its own exports in global markets.
The data on real goods deficit provides a crucial counterpoint to the nominal figures. The fact that the real goods deficit grew at a slower pace than the nominal deficit suggests that inflation played a role in the widening of the nominal trade gap. This is an important distinction for policymakers and analysts seeking to understand the underlying drivers of trade imbalances.
Looking Ahead: Future Releases and Data Revisions
The U.S. Census Bureau and the Bureau of Economic Analysis will release the next report on U.S. International Trade in Goods and Services for September 2026 on November 4, 2026. These reports are subject to revisions, as indicated by the adjustments made to the July figures. Such revisions are a standard part of the statistical process, allowing for the incorporation of more comprehensive data as it becomes available.
Notice of Country Name Change
In a minor but notable administrative update, the report also flagged a change in country nomenclature. References to "Nauru" have been replaced with "Naoero" to reflect the country’s official name change. This aligns with recognition by the U.S. Department of State and the International Organization for Standardization, ensuring consistency in international reporting.
The U.S. International Trade in Goods and Services report is a vital source of information for understanding the nation’s economic engagement with the rest of the world. The August figures, while showing a monthly deterioration, are part of a broader economic picture that continues to be shaped by global economic conditions, domestic demand, and evolving trade relationships. Analysts will be closely monitoring future releases to determine if the August widening represents a short-term anomaly or the beginning of a new trend in the U.S. trade balance.