Lana Rhoades
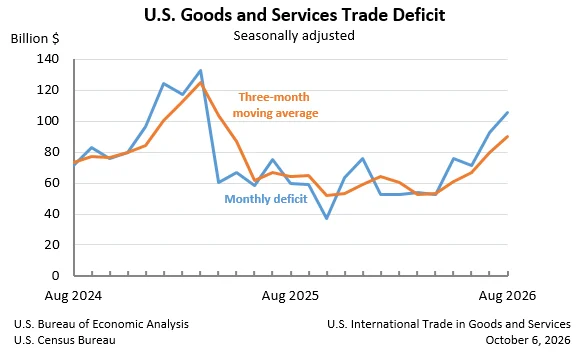
The United States experienced a notable expansion in its trade deficit for goods and services in August, reaching $105.6 billion, a substantial increase of $12.7 billion from the revised $92.8 billion deficit recorded in July. This widening gap signals a complex interplay of increasing import demand and a more modest rise in export activity, underscoring ongoing trends in global trade dynamics. The latest figures, released jointly by the U.S. Census Bureau and the U.S. Bureau of Economic Analysis, provide a detailed snapshot of the nation’s international commerce, revealing shifts in both goods and services trade.
August Trade Imbalance: A Deeper Dive
The August deficit represents a 13.7% increase in the overall imbalance. This escalation was primarily fueled by a significant uptick in imports, which surged by 4.3% to $420.8 billion. Exports, while also showing growth, lagged behind import increases, rising by 1.4% to $315.2 billion. The disparity between these growth rates directly contributed to the wider trade gap.
Breaking down the deficit further, the trade in goods accounted for the largest portion of the imbalance. The goods deficit alone expanded by $12.8 billion to reach $136.6 billion in August. This indicates a robust demand for foreign-made goods within the U.S. economy, outpacing the demand for American-made goods abroad. Conversely, the services sector continued to contribute positively to the U.S. trade balance, with the services surplus increasing by less than $0.1 billion to $31.0 billion. This ongoing surplus in services, which includes areas like tourism, financial services, and intellectual property licensing, partially offsets the deficit in goods but was not sufficient to counteract the overall widening of the trade gap in August.
Examining the Underlying Trends: A Month-Over-Month Analysis
The monthly figures reveal a substantial increase in both imports and exports compared to July. August exports climbed by $4.5 billion to $315.2 billion, a positive development for American producers and exporters. However, this growth was overshadowed by an even larger increase in imports, which rose by $17.2 billion to $420.8 billion. This dynamic suggests that while U.S. goods and services are finding markets abroad, domestic consumption of foreign products is growing at a faster pace.
The details within the goods trade highlight the primary drivers of the deficit’s expansion. Exports of goods alone increased by $4.4 billion to $205.7 billion in August. This figure includes a $4.2 billion increase in goods on a Census basis, alongside a $0.3 billion rise in net balance of payments adjustments. On the import side, goods imports saw a substantial jump of $17.2 billion, reaching $342.2 billion. This was driven by a $17.4 billion increase in goods on a Census basis, partially offset by a $0.2 billion decrease in net balance of payments adjustments. The significant rise in goods imports is a key indicator of the pressures contributing to the widening trade deficit.
The services sector, while contributing a surplus, saw more modest movements. Exports of services increased by less than $0.1 billion to $109.5 billion, indicating stable demand for U.S. services globally. Imports of services also saw a slight increase of less than $0.1 billion, reaching $78.5 billion, suggesting a continued, albeit slow, growth in U.S. demand for foreign services.
The Broader Picture: Year-to-Date Performance and Moving Averages
While the August figures paint a picture of a widening deficit, the year-to-date data offers a different perspective. For the period from January to August, the cumulative goods and services deficit has actually decreased by $138.2 billion, representing a significant 19.9% reduction compared to the same period in the previous year. This suggests that while the month of August saw a setback, the overall trend for the year has been towards a narrowing of the trade imbalance.
This year-to-date improvement is a result of robust export growth outpacing import growth over the longer term. Year-to-date exports have increased by $267.7 billion, an impressive 11.8% rise. Imports, while also increasing, have done so at a slower pace, with a year-to-date increase of $129.5 billion, or 4.4%. This sustained export expansion has been a key factor in mitigating the overall trade deficit for the year.
To smooth out short-term fluctuations, the report also provides data on three-month moving averages. For the three months ending in August, the average goods and services deficit stood at $89.9 billion, an increase of $9.9 billion. This figure is notably higher than the August monthly deficit, indicating that the recent widening trend is reflected in the short-term averages. Looking at a year-over-year comparison, the average goods and services deficit for the three months ending in August increased by $25.4 billion from the same period in 2025, suggesting a recent acceleration in the trade imbalance.
Real vs. Nominal Trade Deficit
The report also distinguishes between nominal and real trade deficits, with the latter adjusted for price changes. In August, the real goods deficit, calculated on a Census basis and expressed in 2017 dollars, increased by $8.7 billion, or 8.2%, to $114.7 billion. This increase in the real goods deficit was slightly less pronounced than the increase in the nominal goods deficit, which rose by 11.1%. This suggests that while inflation is a factor, the underlying volume of goods imports contributing to the deficit has also grown.
Geographic Distribution of Trade: Key Trading Partners
The report also sheds light on the trade balance with specific countries and regions. In August, the U.S. recorded trade surpluses with several key partners, including the Netherlands ($7.7 billion), South and Central America ($5.6 billion), the United Kingdom ($3.6 billion), Hong Kong ($2.3 billion), Brazil ($1.3 billion), Belgium ($1.2 billion), Australia ($0.6 billion), and Saudi Arabia ($0.4 billion). These surpluses indicate that U.S. exports to these regions exceeded imports from them.
Conversely, significant trade deficits were observed with other major trading partners. Mexico led the list of countries with a deficit of $27.7 billion, followed by Vietnam ($24.0 billion), Taiwan ($18.3 billion), and China ($16.4 billion). The European Union as a bloc also represented a substantial deficit of $11.0 billion. Other countries with notable deficits include South Korea ($9.4 billion), Canada ($7.1 billion), India ($6.2 billion), Germany ($6.2 billion), Malaysia ($6.0 billion), Italy ($4.3 billion), Japan ($3.7 billion), Ireland ($2.5 billion), France ($1.4 billion), Israel ($0.8 billion), Switzerland ($0.4 billion), and Singapore ($0.3 billion). These figures highlight the concentrated nature of U.S. trade imbalances, with specific countries being major contributors to the overall deficit.
Context and Implications of the Widening Deficit
The widening trade deficit in August, despite a year-to-date improvement, warrants careful observation. Economists often view persistent and large trade deficits with concern, as they can signal underlying economic imbalances. A sustained trade deficit implies that a country is importing more goods and services than it is exporting, which can lead to an accumulation of foreign debt or a reduction in domestic asset ownership.
The surge in imports in August could be attributed to a variety of factors, including strong domestic consumer demand, a strengthening U.S. dollar making imports cheaper for U.S. consumers and businesses, and potentially supply chain issues that may be resolved by importing finished goods rather than producing them domestically. The increase in exports, while positive, indicates that global demand for U.S. products has not kept pace with domestic demand for foreign goods.
From a policy perspective, the trade figures can inform discussions about trade agreements, manufacturing competitiveness, and currency valuations. A widening deficit can put pressure on domestic industries that compete with imports and may lead to calls for protectionist measures. However, a more nuanced view recognizes that trade deficits are also a reflection of a strong economy that can afford to consume more than it produces, often financed by foreign investment.
The next release of this data, scheduled for November 4, 2026, will cover trade in goods and services for September 2026. It will provide further insight into whether the August trend of a widening deficit was a temporary aberration or the beginning of a new pattern. The consistency of the widening deficit over longer periods, such as the three-month moving averages, suggests that recent trade dynamics are indeed shifting.
Revisions and Data Adjustments
The report also includes revisions to previously released data. For July, the export figures were revised, and similarly, July import figures were adjusted. These revisions are a standard part of the statistical reporting process, allowing for greater accuracy as more complete data becomes available. The data presented is seasonally adjusted, meaning that statistical methods have been applied to remove predictable seasonal patterns, providing a clearer view of underlying trends. However, the data is not adjusted for price changes, except for the "Real Goods" section, which offers a crucial inflation-adjusted perspective.
Notice of Country Name Change
In a minor but notable update, the report also acknowledges a country name change. References to "Nauru" have been replaced with "Naoero" to reflect the country’s official name change. This aligns with recognition by the U.S. Department of State and the International Organization for Standardization.
The comprehensive data released by the Census Bureau and the Bureau of Economic Analysis serves as a vital tool for understanding the intricate dynamics of U.S. international trade, offering a granular view of the nation’s economic engagement with the rest of the world. The August figures, while indicating a widening deficit, are part of a larger economic narrative that includes both short-term fluctuations and longer-term trends in global commerce.