Lana Rhoades
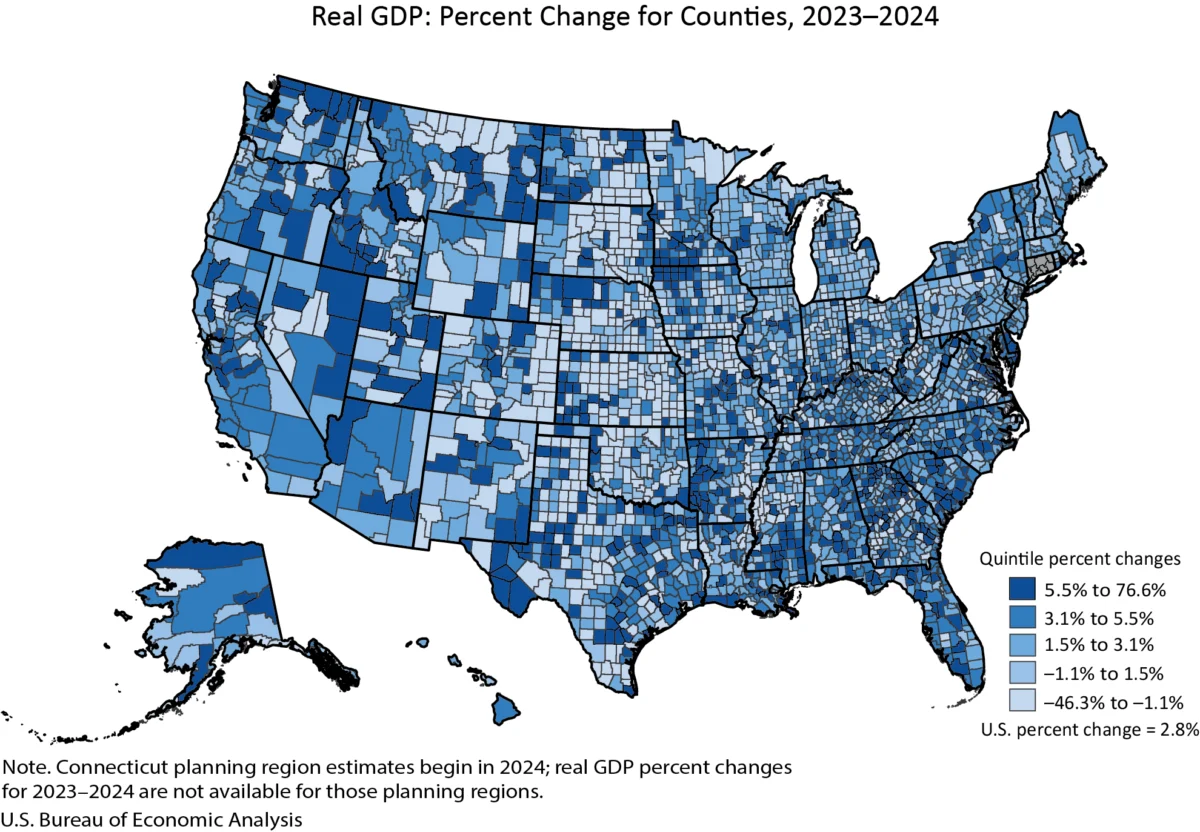
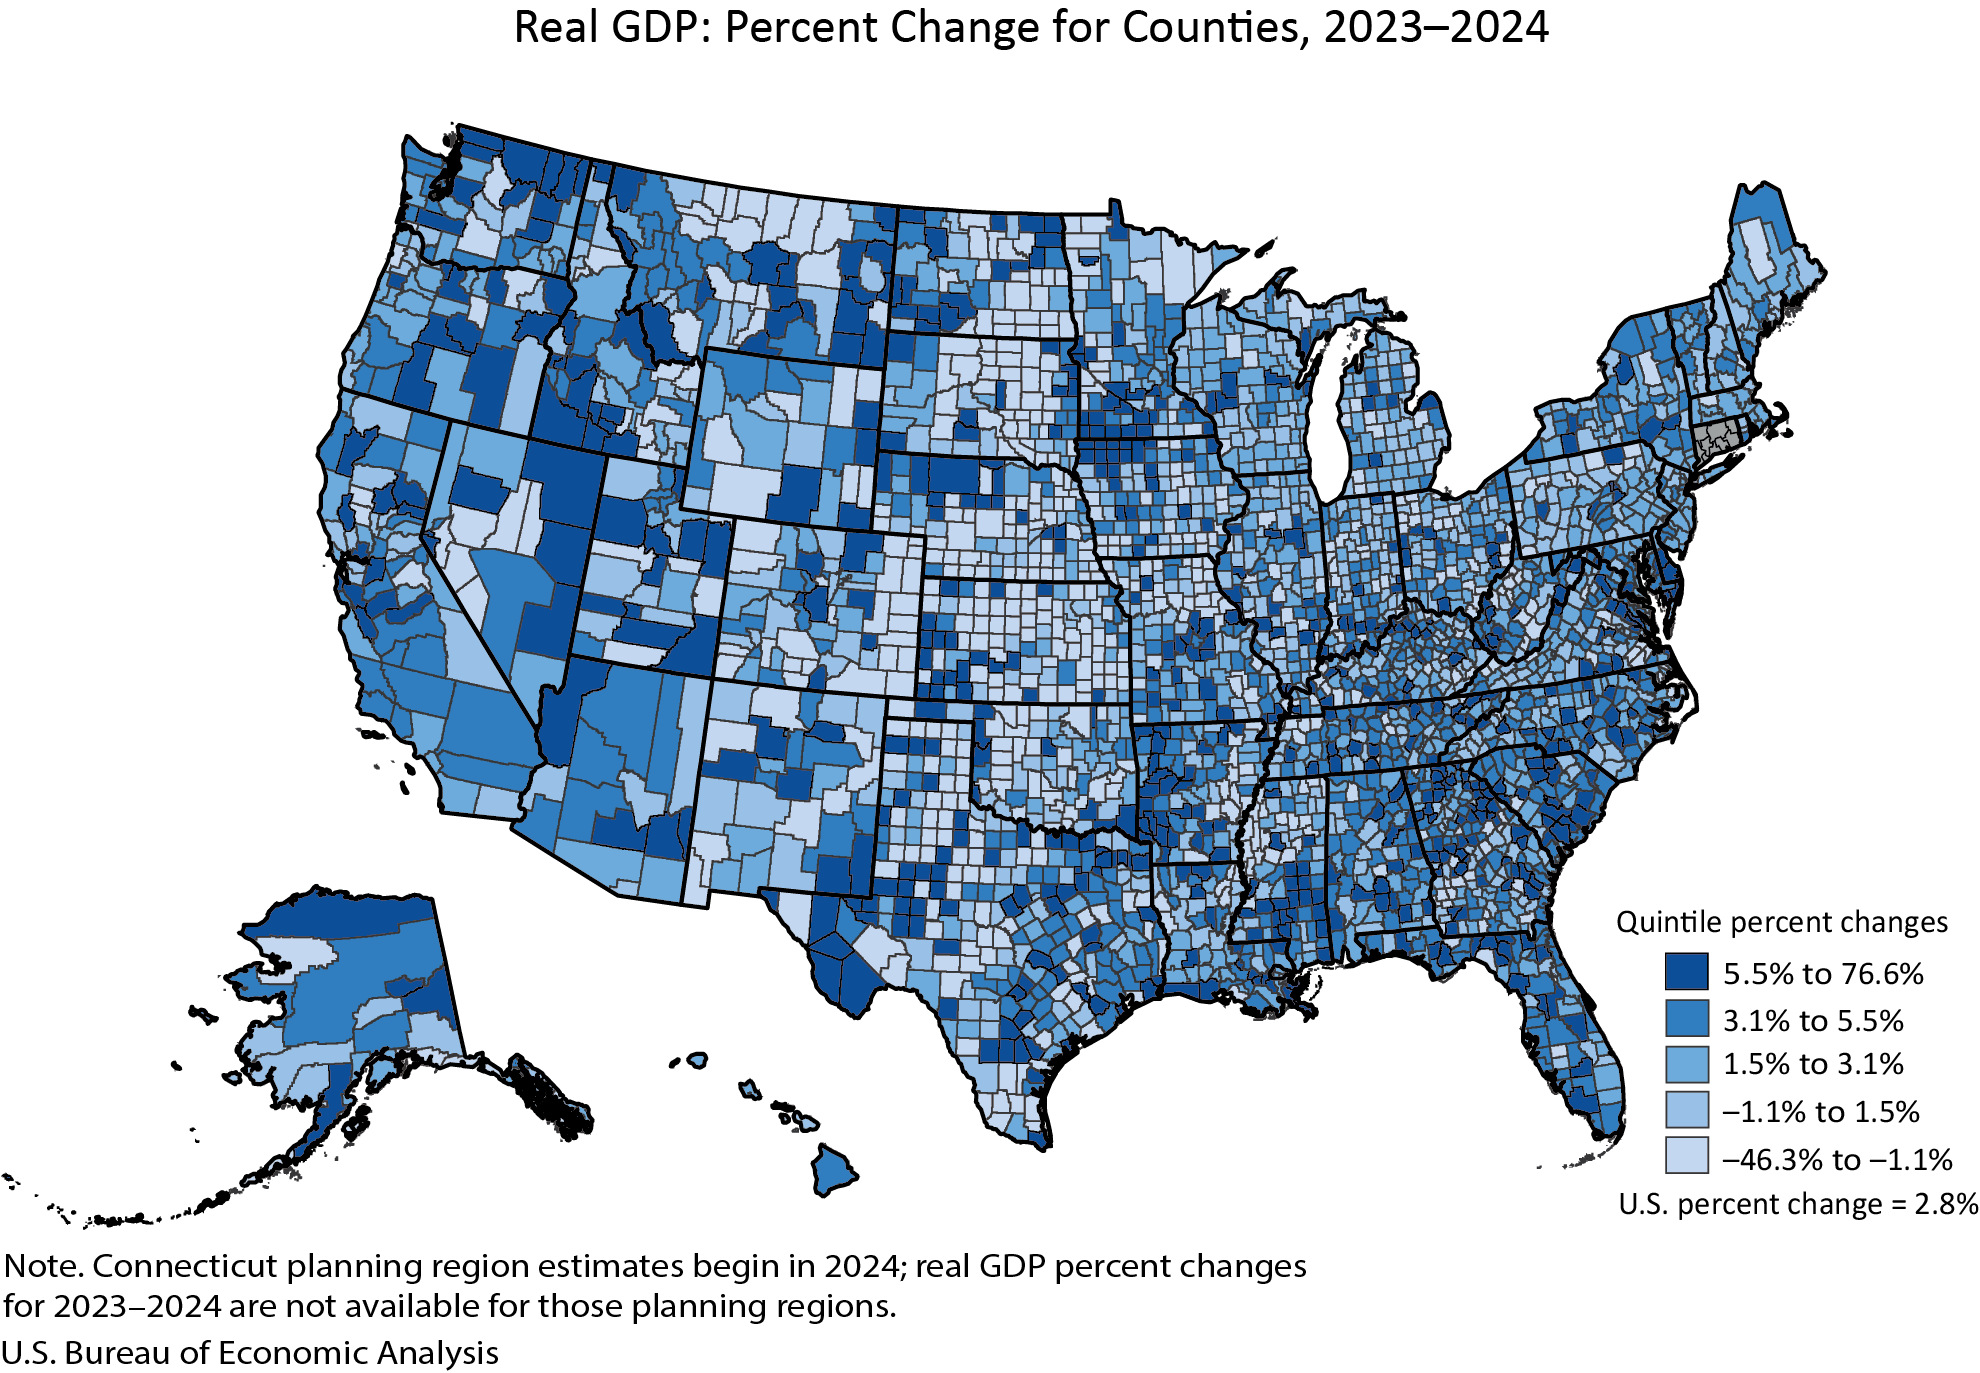
Washington D.C. – The economic landscape of the United States in 2024 presented a complex picture, with real Gross Domestic Product (GDP) experiencing growth in a significant majority of counties but also revealing pockets of decline. According to the latest estimates released by the U.S. Bureau of Economic Analysis (BEA), real GDP saw an increase in 2,273 counties, while 809 counties registered a decrease, and 24 remained unchanged. This broad overview underscores the nuanced nature of economic performance across the nation’s diverse local economies.
The disparity in economic performance is stark, with the percentage change in real GDP ranging dramatically from a remarkable 76.6 percent surge in Carter County, Montana, to a substantial 46.3 percent contraction in Baca County, Colorado. These extreme figures highlight the localized impacts of various economic drivers, from resource-based industries to shifts in consumer spending and investment. The BEA’s data, which incorporates annual updates to national and state-level economic accounts, provides a granular look at how economic activity is distributed and evolving at the county level.
Understanding County GDP: A Snapshot of Economic Activity
Real GDP serves as a primary indicator of the economic health and output of a specific geographic area. It measures the total value of goods and services produced within a county, adjusted for inflation. The BEA’s annual estimates allow for a year-over-year comparison, offering insights into the trajectory of local economies.
In 2024, the sheer scale of economic activity varied immensely across the United States. New York County, New York, a global financial hub, recorded the highest total level of real GDP at an astounding $813.7 billion. In stark contrast, Issaquena County, Mississippi, a rural county with a significantly smaller population and economic base, registered a total real GDP of $15.7 million. This vast difference in economic scale underscores the profound disparities in industrial composition, population density, and the concentration of major economic enterprises across different regions of the country.
Analyzing Economic Trends by County Size
The BEA’s data also provides a breakdown of economic trends based on county population size, offering a more refined perspective on performance.
Large Counties (Population > 500,000)
In the category of large counties, defined as those with populations exceeding 500,000, the economic trends showed a predominantly positive outlook. Out of 146 such counties, 145 experienced growth in real GDP, with none reporting a decline. One county remained unchanged. The range of growth in these economically significant areas was from a high of 10.7 percent in Pinal County, Arizona, to a stable 0.0 percent in Johnson County, Kansas. The substantial economic output of these large counties, often home to major metropolitan areas and diverse industries, suggests a general resilience and capacity for sustained economic expansion.
Medium Counties (Population 100,000 to 500,000)
Medium-sized counties, with populations between 100,000 and 500,000, also demonstrated a strong trend of economic growth. Of the 474 counties in this group, 451 reported an increase in real GDP, with only 20 experiencing a decline. Three counties saw no significant change. The growth spectrum in this segment was led by Jefferson County, Texas, which achieved a 12.4 percent increase, while Black Hawk County, Iowa, recorded a modest decline of 2.6 percent. This segment of the economy often represents a crucial balance between the dynamism of large urban centers and the more specialized economies of smaller regions.
Small Counties (Population < 100,000)
The category of small counties, encompassing those with populations under 100,000, presented the most varied economic performance. Within this large group, which comprises 2,479 counties, 1,677 experienced real GDP growth. However, a notable 789 counties saw their real GDP decline, and 20 remained unchanged. The extreme fluctuations observed in the overall national data were particularly pronounced in this category, with Carter County, Montana, showcasing the highest growth at 76.6 percent, and Baca County, Colorado, facing the steepest decline at 46.3 percent. This highlights the vulnerability of smaller economies to sector-specific challenges or opportunities, as well as to broader economic shifts.
Personal Income Trends Mirror Economic Activity
Complementing the real GDP figures, the BEA’s release also detailed trends in personal income, a measure of the income received by all persons from all sources. In 2024, personal income, in current dollars, increased in a substantial 2,768 counties, while 331 counties experienced a decrease, and 7 remained unchanged. This indicates a generally positive trend in income across a vast majority of the nation’s counties, aligning with the broader pattern of economic growth observed in real GDP.
The percentage change in personal income across counties ranged from a robust 22.6 percent increase in Harding County, South Dakota, to a significant 23.3 percent decline in Issaquena County, Mississippi. These figures underscore that while overall economic activity might be expanding, the distribution and growth of personal income can vary, influenced by factors such as wage growth, employment levels, and the composition of income sources within a county.
Personal Income Levels: A Wide Spectrum
Similar to GDP, the total level of personal income exhibits considerable variation across the United States. Los Angeles County, California, with its massive population and diverse economic base, recorded the highest total personal income at $818.5 billion. Conversely, Loving County, Texas, a sparsely populated county with a unique economic structure tied to oil and gas, had the lowest total personal income at $10.6 million. These disparities reflect the fundamental differences in population, industry, and economic opportunity that define American counties.
Personal Income Highlights by County Size
The BEA also provided a demographic breakdown of personal income trends by county size:
Large Counties (Population > 500,000)
For large counties, personal income growth was nearly universal. Out of 146 counties, 146 saw an increase in personal income. The range of growth in this category was from 9.7 percent in San Joaquin County, California, to 2.7 percent in Philadelphia County, Pennsylvania. This suggests that the economic engines of major metropolitan areas are effectively translating into higher incomes for their residents.
Medium Counties (Population 100,000 to 500,000)
Medium-sized counties also demonstrated strong personal income growth. Of the 474 counties in this group, 474 reported an increase in personal income. The highest growth was seen in Merced County, California, at 10.9 percent, followed by Genesee County, Michigan, with a 1.6 percent increase. This indicates a healthy income expansion in these mid-sized economic centers.
Small Counties (Population < 100,000)
In smaller counties, personal income trends were more varied, mirroring the GDP trends. While the exact number of counties with growth, decline, or no change in this category was not explicitly broken down in the provided text, the trend range highlights significant fluctuations. Harding County, South Dakota, experienced a notable 22.6 percent increase, while Issaquena County, Mississippi, faced a substantial 23.3 percent decline. This reinforces the idea that smaller economies can be more susceptible to significant swings in personal income, influenced by factors like industry-specific booms or busts.
Updates and Methodological Changes by the BEA
The release of these 2024 county-level statistics is part of the BEA’s ongoing commitment to providing timely and comprehensive economic data. This year’s update incorporates the results of the BEA’s annual revisions to GDP and personal income by county, which also included revisions to data from 2020 to 2023. These revisions are crucial as they integrate new and improved source data, ensuring greater accuracy and alignment with broader national economic accounts.
A significant methodological change for the 2024 estimates is the incorporation of Connecticut’s planning region geographic definitions, replacing its previous county-based definitions. This shift, while providing a more regionally relevant economic picture for Connecticut, means that these specific planning region estimates are not included in the overall percent change ranges for counties nationwide.
Furthermore, the BEA has enhanced its data presentation by consolidating the annual GDP and personal income by county releases into a single, combined news release for the first time. This move aims to provide a more holistic view of county economies and streamline the dissemination of information, replacing two separate releases that were previously issued on different days.
In a notable discontinuation, the BEA has ceased the publication of statistics for metropolitan statistical areas, micropolitan statistical areas, and their related divisions and areas. While GDP and personal income estimates will continue to be available at the county level, the aggregation of data for these broader metropolitan classifications has been retired. The BEA cites its FAQ for further details on this decision.
Enhanced Data Accessibility Through Interactive Tools
In line with modern data dissemination practices, the BEA has transitioned the detailed statistical tables from being embedded directly within the news release to being accessible via its online Interactive Data Application. This approach aims to reduce redundancy and provide users with more flexible and comprehensive data access. The interactive tables allow for full time series analysis, customization, and download options in various formats, including PDF, Excel, and CSV.
This strategic shift directs data users to a more robust platform for exploring historical data and performing in-depth analysis. Links to specific tables, such as "County GDP Summary (Percent Change From Preceding Period)" and "County Personal Income Summary (Thousands of Dollars)," are provided within the release, guiding users to the most relevant data sets for their research.
Broader Implications and Future Outlook
The divergent economic trajectories observed at the county level in 2024 have several implications for policymakers, businesses, and residents. For counties experiencing robust growth, the focus may be on managing expansion, investing in infrastructure, and attracting further talent and capital. Conversely, counties facing economic decline will need to address underlying structural issues, explore diversification strategies, and potentially implement support programs for affected populations.
The BEA’s commitment to refining its data collection and presentation methods, including the integration of new data sources and the move towards interactive platforms, signals a continuous effort to provide the most accurate and user-friendly economic intelligence. The discontinuation of certain statistical series, while potentially impacting some users, reflects an evolving understanding of data needs and the prioritization of county-level granularity.
The next release of GDP and personal income by county statistics, scheduled for December 2, 2026, will supersede the 2024 data and offer insights into the economic performance of 2025. This ongoing cycle of data updates and revisions allows for a dynamic understanding of the U.S. economy’s performance at its most granular level, providing essential information for informed decision-making across various sectors.