
 Candice Horbacz
The Tax Foundation has released its highly anticipated 2027 State Tax Competitiveness Index, marking a significant evolution in its long-standing analysis of state tax systems. This year’s edition introduces a comprehensive methodological overhaul and a rebranding from the "State Business Tax Climate Index" to better reflect its broader assessment of states’ overall tax competitiveness. The new index, which offers an invaluable roadmap for policymakers and taxpayers alike, evaluates tax systems as of July 1, 2026, the start of fiscal year 2027 for most states.
A Refined Lens on State Tax Policy: The 2027 Rankings
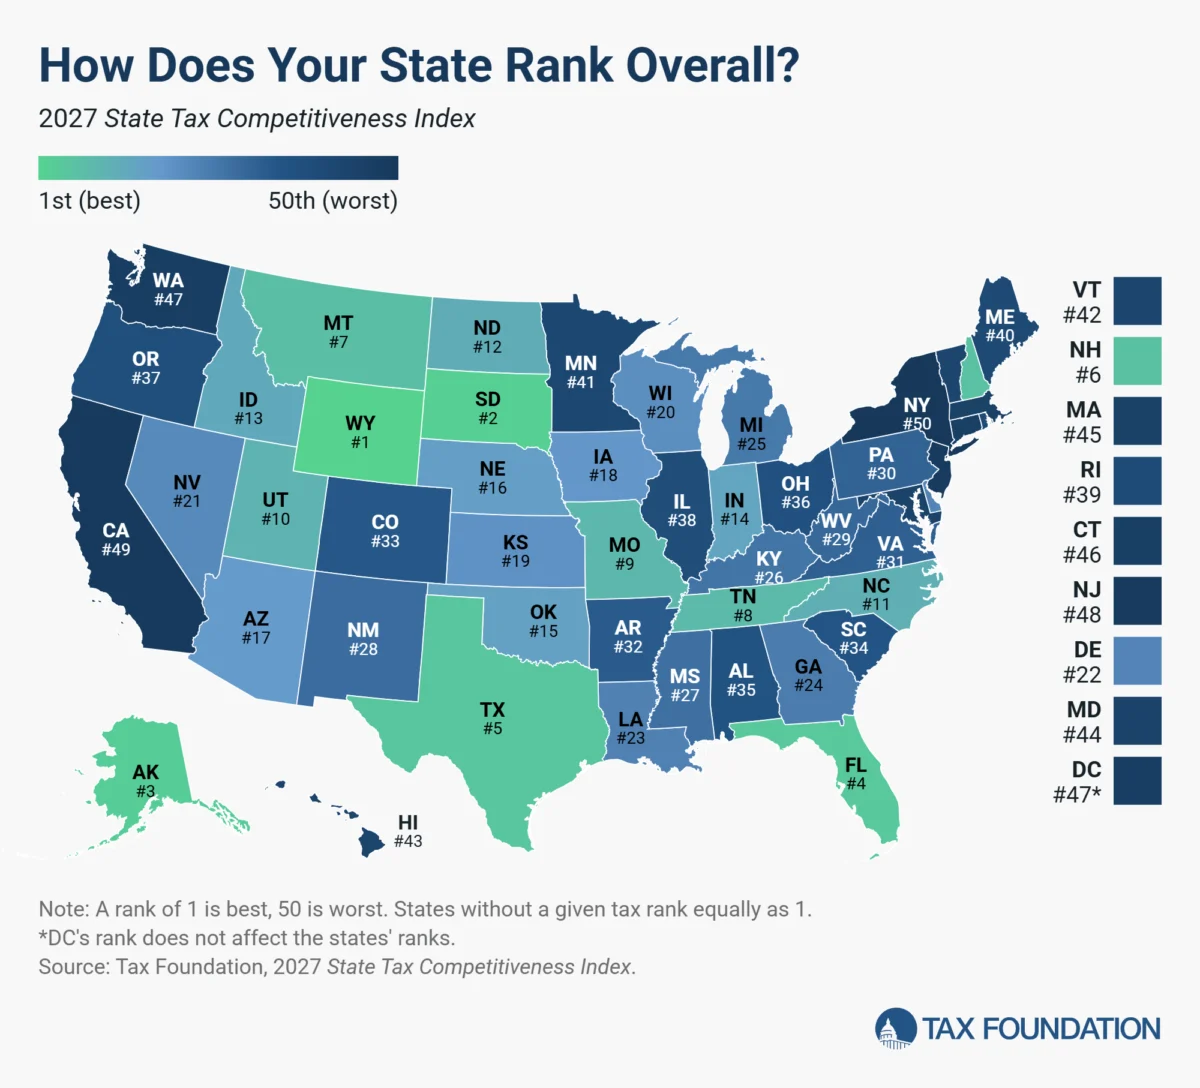
The 2027 Index provides a critical benchmark for how states structure their tax systems, moving beyond mere tax collections to analyze the economic efficiency and neutrality of their tax codes. While the full list of 50 states is extensive, the top and bottom performers highlight distinct approaches to taxation.
The ten highest-ranked states in this year’s Index demonstrate a common characteristic: the absence of one or more major tax types. South Dakota and Wyoming stand out for having no corporate or individual income tax, while Alaska and New Hampshire forgo individual income and state-level sales taxes. Florida, Tennessee, and Texas levy no individual income tax, and Montana operates without a state sales tax. These states leverage their streamlined tax structures to achieve high competitiveness scores. However, the Index also acknowledges that states can achieve strong rankings even while imposing all major taxes, provided they do so with moderate rates and well-designed structures. Missouri and Utah, for instance, both levy all major tax types and rank among the top 10, demonstrating that thoughtful policy can overcome a broader tax base. Other states from 11th to 16th, including North Carolina, North Dakota, Idaho, Indiana, Oklahoma, and Nebraska, also manage to rank highly with comprehensive tax systems.
Conversely, the ten lowest-ranked states in the 2027 Index are often characterized by complex, nonneutral taxes and comparatively high rates. New Jersey, for example, faces significant challenges due to some of the nation’s highest property tax burdens, the highest corporate income tax rate in the country, and one of the highest individual income tax rates. The state’s inheritance tax and poorly structured individual income taxes further diminish its competitiveness.
Evolution of an Essential Tool: Rebranding and Methodological Overhaul
For over two decades, the Index has served as a vital resource for policymakers evaluating their tax codes. First launched in 2003 as the State Business Tax Climate Index, the study has consistently undergone methodological refinements to adapt to changes in tax law, such as the introduction of global intangible low-taxed income (GILTI) or the design of remote seller taxes following the Supreme Court’s Wayfair decision.
However, the pace of change in recent years necessitated a more fundamental transformation. Key federal reforms like the Tax Cuts and Jobs Act (TCJA), the enduring impact of the Wayfair decision on sales tax nexus, the rise of remote work, and other economic shifts stemming from the global pandemic (including changes to unemployment insurance tax regimes) have reshaped the tax landscape. The adoption of the "One Big Beautiful Bill Act" (OBBBA), the emergence of digital advertising taxes, and growing interest in wealth and unrealized gains taxes further underscored the need for a comprehensive update.
Recognizing this accelerated pace, the Tax Foundation embarked on a "ground-up" reworking of the Index for the 2025 edition, leading to its rebranding as the State Tax Competitiveness Index. This shift reflects a broader assessment of state tax policy, moving beyond just the business tax climate to encompass all aspects of a state’s overall tax competitiveness. The overhaul aimed to provide greater granularity in evaluating existing tax provisions and to address new developments more comprehensively. Independent evaluations have consistently demonstrated a strong correlation between Index ranks and state economic outcomes, affirming the study’s predictive power. The refresh also allowed for better systematization and rebalancing of outlier state tax provisions that previously required "shoehorning" into the methodology.
Beyond methodology, the presentation of the Index has been reimagined for a digital environment. The publication now features interactive, sortable, and filterable datasets, historical rate tools, and new visuals. Each state receives a dedicated summary, highlighting notable tax code features, explaining its ranking, and suggesting specific reforms to enhance competitiveness. This enhanced accessibility allows users to compare states, drill down into specific variables, and explore policy choices with unprecedented ease.
The extensive nature of these methodological changes means that some states’ rankings in the 2027 edition may appear to shift more dramatically than in previous years. To ensure "apples-to-apples" comparisons and maintain transparency, the Tax Foundation has backcast state rankings under the new methodology for seven years prior to this edition. These backcast rankings are the definitive source for tracking actual state movement over time, reflecting the addition of more variables and adjustments than in prior revisions.
Understanding the Index: A "Wins Above Replacement" Approach to Tax Policy
The Tax Foundation likens tax competition to "Wins Above Replacement" in baseball, where a well-structured tax code, while not a silver bullet, significantly contributes to a state’s economic successes. The Index posits that every state can benefit from a tax structure that is simple, neutral, transparent, and pro-growth.
The Index scores states across five primary subindices: corporate taxes, individual income taxes, sales and excise taxes, property and wealth taxes, and unemployment insurance taxes. Each subindex’s weight is determined by the variability of scores across states, meaning areas where states have more opportunities to compete (and thus show greater divergence in policy) are given more emphasis. For instance, individual income taxes carry the highest weight at 30.2%, reflecting significant state-level differences, followed by sales and excise taxes (21.7%) and corporate taxes (21.3%). Property and wealth taxes (15.2%) and unemployment insurance taxes (11.6%) complete the weighting.
States that forgo a major tax altogether (e.g., individual income tax, corporate income tax, or sales tax) naturally score perfectly on that specific subindex, explaining the high rankings of states like Wyoming and South Dakota. However, as demonstrated by states like Missouri, Utah, and North Carolina, high rankings are achievable with all major taxes present if rates are moderate and structures are well-designed. These "Missouri, Utah, and North Carolina models" offer practical blueprints for states seeking to improve competitiveness without entirely eliminating a revenue source.
For policymakers, the Index serves as a diagnostic tool, providing detailed data on over 150 variables—from tax rates and throwback rules to the treatment of net operating losses, expensing provisions, and digital product taxation. This granularity allows for precise comparisons and informed decisions regarding tax reform. The underlying philosophy emphasizes that while taxes are not the only factor in economic development (factors like workforce, infrastructure, and quality of life also matter), they are a crucial, controllable element. Modernizing a state’s tax structure positions it for growth, yielding "Wins Above Replacement."
Impact of Federal Tax Legislation on State Competitiveness
Recent federal legislation, particularly the Tax Cuts and Jobs Act (TCJA) of 2017 and the subsequent "One Big Beautiful Bill Act" (OBBBA), has significantly influenced state tax codes and, consequently, their rankings in the Index. Many states base their tax codes on the federal Internal Revenue Code (IRC), meaning federal changes often cascade to the state level unless states actively decouple.
The OBBBA, for example, altered or added several key expensing provisions. It restored full expensing under Section 168(k) for investments in machinery and equipment, making it permanent. It also introduced first-year expensing for certain manufacturing structures under Section 168(n) and restored immediate cost recovery for research and experimentation (R&E) expenses under Section 174, which had previously shifted to five-year amortization under the TCJA. States that conform to these pro-growth expensing provisions generally see their corporate tax rankings improve, as they incentivize capital investment and innovation. Conversely, states that fail to conform or actively decouple from these provisions may see their rankings fall as competitors embrace more favorable policies.
Another area of federal influence is the shift from Global Intangible Low-Taxed Income (GILTI) to Net CFC Tested Income (NCTI) under the OBBBA. While intended as a guardrail for the federal territorial tax system, states that include NCTI (or GILTI) in their tax base without allowing foreign tax credits can create problematic double taxation of international income. The Index penalizes states that adopt these provisions without appropriate adjustments.
The rise of remote work and the Supreme Court’s Wayfair decision have also forced states to re-evaluate sales tax nexus rules and the taxation of digital products and services. The Index now specifically tracks states’ approaches to digital advertising taxes and exemptions for data center equipment, recognizing the growing importance of these areas in the modern economy. These federal-level changes underscore the dynamic nature of state tax policy and the continuous need for states to adapt to remain competitive.
Notable State-Specific Changes in the 2027 Index
Several states experienced significant shifts in their 2027 rankings due to legislative actions and methodological adjustments:
- Arizona dropped three places to 17th. Its corporate income tax ranking fell from 16th to 20th due to non-conformity with federal full expensing (Section 168(k)) and retroactive conformity legislation lacking an emergency clause. Its sales and use tax ranking also declined from 35th to 40th following a three-year moratorium on tax incentives for new data centers, suspending sales tax exemptions for qualifying equipment.
- Arkansas fell three spots to 32nd, largely due to other states’ improvements and its continued non-conformity with federal full expensing, causing its corporate income tax ranking to drop nine places to 19th, despite a reduction in its top individual income tax rate.
- Georgia dropped from 18th to 24th, primarily due to a reduction in its corporate income tax score. The state did not conform to competitive corporate expensing provisions in the OBBBA, and partially exempted tips and overtime pay from individual income tax, narrowing the base.
- Idaho fell four places to 13th, with its individual income tax component dropping eight places. This was largely due to conforming to the OBBBA’s temporary individual deductions for tips and overtime, which narrow the tax base without substantial economic growth.
- Indiana moved down three spots to 14th. Its individual income tax ranking fell from 21st to 28th due to authorized local income taxes and deductions for qualified tips and overtime. Non-conformity to key expensing provisions also caused its corporate income tax ranking to fall from 7th to 11th.
- Iowa saw a slight dip from 17th to 18th. Its individual income tax ranking fell eight places to 18th due to federal provisions (no tax on tips, overtime, auto loans) narrowing its base, and other states reducing rates. However, its corporate income tax ranking rose eight places to 17th due to conformity to full bonus depreciation and decoupling from NCTI.
- Kansas improved four places overall to 19th, with significant gains in corporate and individual tax components. This was primarily due to rolling conformity to the OBBBA’s pro-growth business expensing provisions.
- Louisiana experienced a notable 9-place improvement to 23rd overall, driven by a 17-place jump in its property tax rank. This was attributed to the elimination of the capital stock tax and newly allowing S corporations to file through the individual income tax.
- Maine slid seven places to 40th, following the adoption of a 2% "high-income surcharge" that brought its top individual income tax rate to 9.15% on incomes over $1 million, including a substantial marriage penalty.
- Michigan dropped nine places to 25th overall. Non-conformity to OBBBA’s expensing provisions, combined with a new exemption for tipped and overtime income and a low Section 179 limit, significantly impacted its rankings.
- Missouri broke into the top 10, rising from 12th to 9th. This improvement stemmed from conforming to new expensing provisions in the OBBBA and resisting base-narrowing exemptions for tipped and overtime pay.
- Montana fell two spots to 7th. Despite a lower top income tax rate and the elimination of the marriage penalty, its individual income tax ranking dropped from 13th to 21st due to federal provisions narrowing the base and other states’ rate reductions.
- Nebraska improved eight places to 16th, driven by the continued phase-down of its income tax rates, including a reduction in its top individual income tax rate to 4.55% and a flat corporate rate decrease.
- North Carolina rose two spots to 11th, primarily due to an individual income tax rate reduction from 4.25% to 3.99%. The state continues to boast the nation’s lowest corporate income tax rate among those that impose one, which further declined to 2.0%.
- Ohio moved from a graduated to a flat individual income tax rate of 2.75%, improving its individual income tax ranking five places to 33rd and its overall ranking to 36th.
- Oklahoma jumped from 19th to 15th overall. It moved from six individual income tax brackets to three, reduced its top rate to 4.5%, and conformed to OBBBA’s improved expensing treatment while avoiding exemptions for tips and overtime pay.
- Utah improved five places to 10th overall. The state conformed to pro-growth provisions of the OBBBA, trimmed individual and corporate income tax rates to 4.45%, and enhanced expensing for manufacturing machinery and R&E expenses. Its corporate tax component saw a 7-place improvement.
- Washington’s overall rank fell one place to 47th. While it improved five places on property and wealth taxes by reverting the top estate tax rate, the inclusion of digital advertising in the sales tax base dropped its sales and excise tax component rank to 50th.
Forthcoming Changes and Future Outlook
The landscape of state tax policy remains highly dynamic, with several significant changes scheduled to take effect beyond the 2027 Index’s July 1, 2026, snapshot date. These forthcoming changes will undoubtedly impact future rankings:
- Arkansas is scheduled for a corporate income tax rate reduction to 4.1% in 2027.
- Georgia‘s top individual income tax rate will fall annually by 0.125 percentage points if revenue thresholds are met, with triggered increases to the standard deduction, potentially improving future scores.
- Hawaii adopted a new, additional tax bracket with a 13% rate on incomes over $500,000 (effective 2027), which is expected to cause a significant drop in its individual income tax and overall rankings, mirroring Maine’s recent experience.
- Illinois‘s 2026 budget includes new and increased taxes taking effect January 1, 2027, such as a targeted advertising services tax, a digital asset tax, and a social media platform fee, which will negatively affect its 2028 Index performance.
- Iowa enacted property tax levy limits for counties and municipalities in May 2026, taking effect in 2027, which will be reflected in future Index editions.
- New Mexico lawmakers enacted a law decoupling the state from federal expensing provisions (Sections 168(k) and 168(n)) and expanding the corporate tax base to include NCTI, effective January 1, 2027. These changes will negatively impact New Mexico’s future scores.
- North Carolina‘s individual income tax rate is projected to drop to 3.49% in 2027 and 2.99% in 2028, with the corporate rate scheduled to fall to 1% in 2028 and total elimination planned for 2030, promising continued improvements in its rankings.
- Rhode Island adopted a new 3-percentage-point surtax on individual income over $1 million, phasing in over three years (2027-2029), which will significantly raise its top marginal individual income tax rate and hurt future performance.
- Utah enacted a tax on "targeted advertising" (primarily digital advertising) in 2026, effective January 2027, which will impact its next Index score.
- Washington adopted a new 9.9% tax on income above $1 million in 2026, going into effect in 2028. This tax, despite the state’s judicial history regarding income taxes, is expected to significantly affect its future Index scores.
These pending changes underscore the constant evolution of state tax policy, driven by revenue needs, economic development goals, and ideological shifts. The Tax Foundation’s annual Index will continue to track these developments, providing essential analysis for a dynamic fiscal environment.
The Academic Consensus: Taxes Matter for Economic Growth
The comprehensive literature review underpinning the Index highlights a clear and evolving academic consensus: taxes significantly influence economic behavior and business location decisions. While early studies in the mid-22th century often dismissed the impact of taxes, research since the 1980s has increasingly demonstrated a strong, negative correlation between high or poorly structured taxes and economic growth.
Economists like Charles Tiebout (1956) introduced the concept of "voting with their feet," where individuals and businesses choose jurisdictions that best suit their preferences for public services and tax levels. While individuals consider a broader range of factors, businesses, driven by profitability, are often more responsive to tax differentials. Studies have shown that corporations engage in "yardstick competition," comparing costs across jurisdictions.
Key findings from decades of research include:
- Taxes definitely change behavior: This has been the prevailing view since the late 1980s, with numerous studies demonstrating significant effects.
- Negative impact on employment growth: Higher wages, utility prices, and personal income tax rates discourage employment growth. Personal property taxes and sales taxes have particularly large negative effects on private employment growth.
- Impact on business start-ups: Property taxes, which are paid regardless of profit, have a strong negative effect on new business formation, as many start-ups are not profitable in their early years.
- Sensitivity of foreign direct investment: Corporate tax rates are a critical factor for foreign investors’ location decisions.
- Entrepreneurship and progressivity: High marginal tax rates and progressive tax structures discourage entrepreneurial entry.
- Ineffectiveness of targeted incentives: While some studies suggest job creation tax credits can have long-term effects, executives generally prefer broad-based tax reductions over selective incentives, which often complicate the tax system and distort the market.
- Mobility of high-income individuals: Recent evidence confirms that high-income individuals, including inventors, entrepreneurs, and billionaires, are highly mobile and responsive to major income and estate tax changes, eroding potential revenue windfalls from tax increases.
The Index, therefore, is built on a robust foundation of economic theory and empirical evidence, reflecting the strong belief that state lawmakers control a powerful lever for economic growth through their tax policies. It offers a counterpoint to arguments that dismiss taxes as insignificant, asserting that well-structured tax systems are a competitive advantage in attracting and retaining businesses and talent.
Methodological Innovations for the 2027 Index
The 2027 State Tax Competitiveness Index introduces several significant methodological changes to enhance its accuracy and relevance:
- Expanded IRC Conformity Variables: New variables now track states’ general conformity methods with the IRC for both individual and corporate income taxes. States with rolling conformity receive full credit, static conformity to the current IRC gets partial credit, and selective or lagged static conformity receives no credit. This acknowledges the administrative simplification and consistency benefits of aligning with federal definitions.
- OBBBA Expensing Provisions: The corporate tax category now includes specific variables for conformity to Section 168(n) (first-year expensing for certain structures) and Section 174 (R&E expensing), recognizing their importance for capital investment.
- Individual Income Tax Base Adjustments: The individual income tax category now tracks states’ adoption of federal deductions for tips and overtime pay, which are considered base-narrowing changes that reduce competitiveness.
- Sales Tax Exemption for Data Centers: Given growing interest in data centers, a new variable highlights sales tax exemptions for data center machinery and equipment purchases, aligning with the principle of exempting business inputs.
- Revised Subindex Weightings: To accommodate these additions and ensure accurate representation, the weights within certain subindices have been adjusted. For instance, in the corporate tax base, the "capital" subcategory, now including new expensing provisions, sees its weight increased to 45%.
The methodology continues to assign scores on a relative scale of 0 (worst among states) to 10 (best among states), with components weighted based on their variability across states. States without a particular tax generally receive a perfect score in that subcomponent. All scores are normalized to allow for accurate cross-component comparisons. This robust and continually refined methodology ensures the State Tax Competitiveness Index remains a leading resource for understanding and improving state tax policy.
Conclusion: A Guide for Navigating State Tax Policy
The 2027 State Tax Competitiveness Index serves as an indispensable guide for navigating the complex world of state tax policy. By ranking states both overall and across five critical subindices—corporate, individual income, sales and excise, property and wealth, and unemployment insurance taxes—it clearly illustrates where states compete effectively and where there is ample room for improvement. For would-be reformers, the newly accessible interactive datasets offer an unparalleled resource for understanding how states structure their tax codes and where they diverge, for better or worse, from their peers.
The Tax Foundation remains committed to educating policymakers and the public on these vital issues. As the nation’s tax landscape continues to evolve, tools like the State Tax Competitiveness Index will be crucial for fostering economic growth and ensuring fair, simple, and transparent tax systems across the United States.