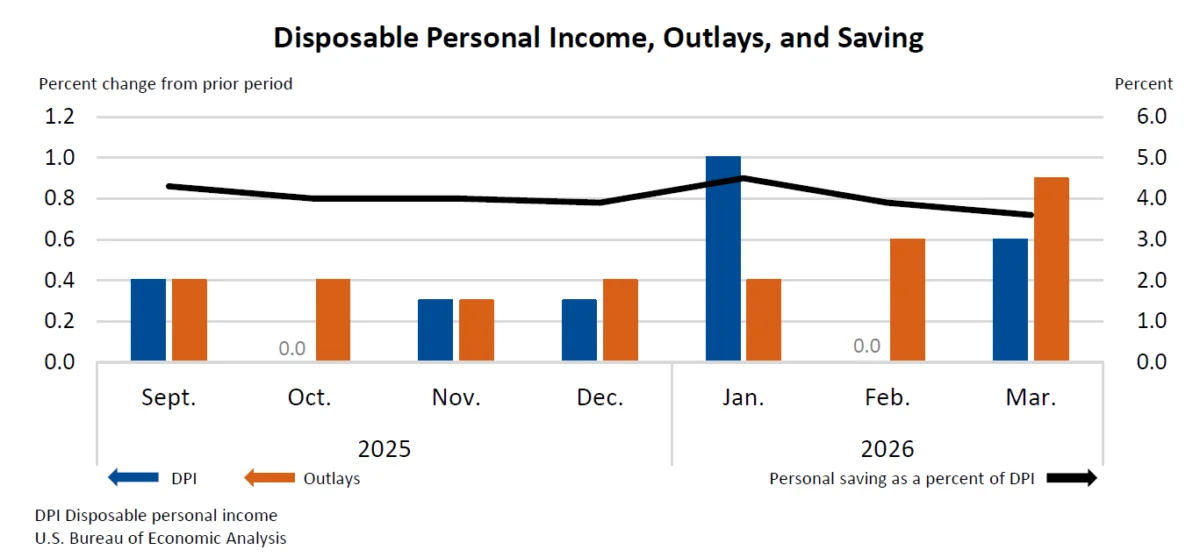
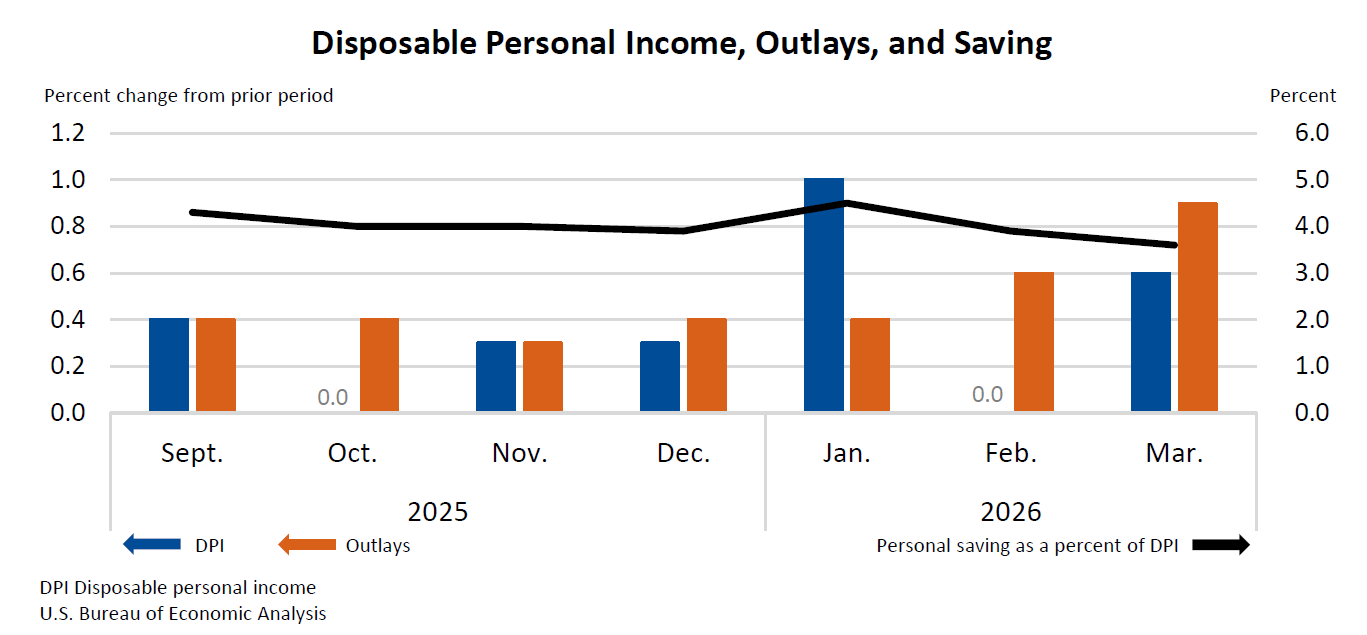
Personal income increased $149.2 billion (0.6 percent at a monthly rate) in March, according to estimates released today by the U.S. Bureau of Economic Analysis (BEA). Disposable personal income (DPI)—personal income less personal current taxes—increased $142.5 billion (0.6 percent), and personal consumption expenditures (PCE)—a key measure of consumer spending—increased $195.4 billion (0.9 percent).
This robust performance in March signals a strengthening economic landscape, with individuals seeing their earnings rise and subsequently translating that into increased spending. The gains in personal income were primarily fueled by significant upticks in compensation and income derived from farm proprietors, demonstrating a broad-based improvement across key sectors of the economy. While these positive trends were somewhat tempered by a decline in other government social benefits, the overall trajectory for personal income was decidedly upward.
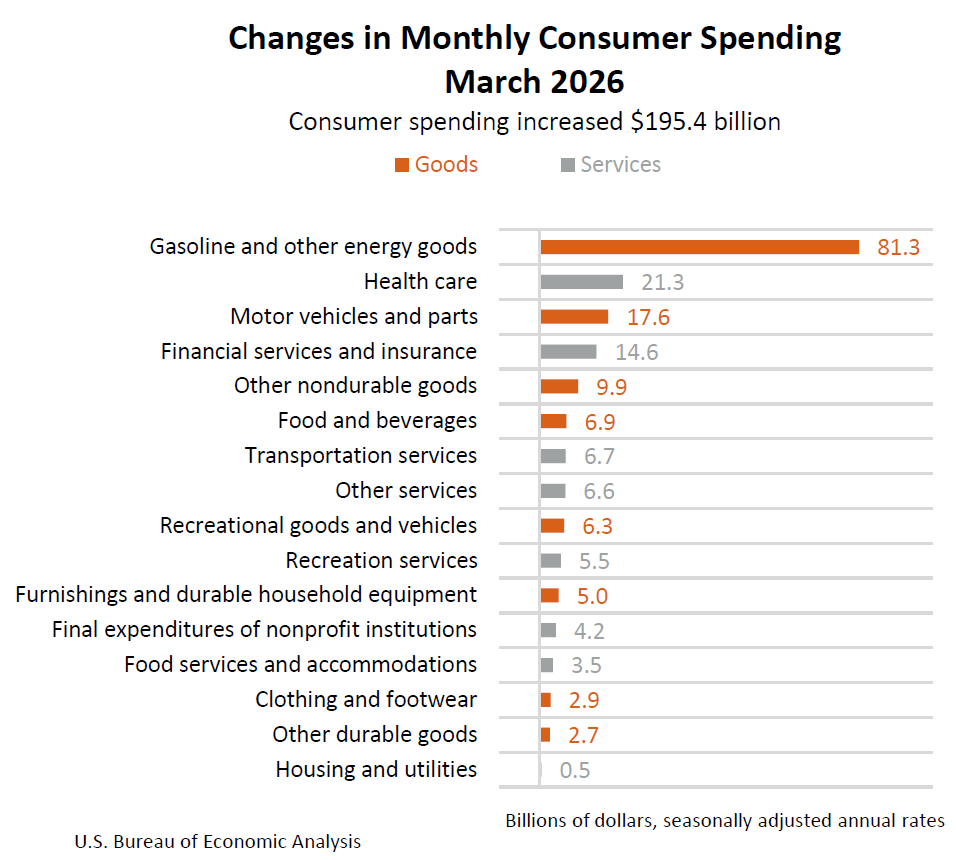
The surge in consumer spending, as measured by PCE, was particularly noteworthy. The $195.4 billion increase reflects a dynamic market where consumers actively engaged in purchasing both goods and services. Spending on goods saw a substantial rise of $132.6 billion, indicating strong demand for tangible products. Simultaneously, spending on services climbed by $62.9 billion, suggesting a continued recovery and expansion in sectors reliant on consumer interaction and service provision. This dual growth in goods and services spending paints a picture of a healthy and active consumer base.
Economic Indicators at a Glance: March Performance
The U.S. Bureau of Economic Analysis (BEA) report for March provides a detailed snapshot of the nation’s economic health through several key metrics:
- Personal Income: Increased by $149.2 billion, marking a 0.6 percent rise on a monthly basis. This signifies a broad-based increase in earnings across the population.
- Disposable Personal Income (DPI): Grew by $142.5 billion, also a 0.6 percent increase. This is the income available to individuals after taxes, indicating more discretionary funds for spending or saving.
- Personal Consumption Expenditures (PCE): Saw a significant jump of $195.4 billion, representing a 0.9 percent monthly increase. This is a critical indicator of consumer demand and economic activity.
- Personal Outlays: The total spending by individuals, which includes PCE, personal interest payments, and personal current transfer payments, rose by $198.6 billion.
- Personal Saving: In March, personal saving stood at $857.3 billion.
- Personal Saving Rate: This metric, representing personal saving as a percentage of DPI, was 3.6 percent. While a decrease from previous periods, it still indicates a portion of income being set aside.
Breakdown of Spending Trends
The increase in personal consumption expenditures (PCE) was a dominant feature of the March economic data. The overall rise of $195.4 billion was composed of:
- Spending on Goods: Increased by $132.6 billion. This substantial growth suggests robust consumer appetite for durable and non-durable goods. Factors such as improved consumer confidence, increased disposable income, and potentially seasonal purchasing patterns could have contributed to this surge.
- Spending on Services: Increased by $62.9 billion. This rise indicates continued recovery and expansion in sectors like travel, entertainment, healthcare, and professional services. The ongoing normalization of post-pandemic behaviors likely plays a significant role in this sustained growth.
Real vs. Nominal Growth: Understanding Purchasing Power
While nominal figures show the dollar amount of income and spending, real figures adjust for inflation to reflect actual purchasing power. In March:
- Real Personal Consumption Expenditures (Real PCE): Increased by $39.6 billion, or 0.2 percent on a monthly rate. This indicates that while nominal spending rose significantly, a portion of that increase was due to higher prices. The real growth suggests that consumers were indeed buying more goods and services, but at a moderated pace compared to the nominal figures. This is a crucial distinction for understanding the true expansion of economic activity.
Inflationary Pressures and Consumer Prices
The report also shed light on inflationary trends, a critical factor influencing consumer purchasing power and monetary policy decisions.
PCE Price Index
- Monthly Change: The PCE price index for March increased by 0.7 percent from the preceding month. This acceleration in headline inflation suggests that price pressures were building across the economy during March.
- Excluding Food and Energy: The core PCE price index, which excludes volatile food and energy prices, rose by 0.3 percent. This figure is closely watched by the Federal Reserve as it provides a clearer picture of underlying inflationary trends. While lower than the headline number, a 0.3 percent increase still points to persistent price pressures in key sectors.
Year-Over-Year Inflation
- Headline PCE Price Index: Increased by 3.5 percent compared to March of the previous year. This year-over-year figure indicates that overall prices have risen considerably over the past twelve months, impacting the cost of living for households.
- Core PCE Price Index: Increased by 3.2 percent from one year ago. The core inflation rate also shows a significant year-over-year increase, suggesting that inflation has been a sustained challenge, impacting a wide range of goods and services beyond those directly tied to energy and food markets.
The elevated PCE price index, particularly the core measure, suggests that inflation remains a significant economic concern. While the increase in personal income provides consumers with more resources, the rising cost of goods and services erodes the purchasing power of that income. This dynamic can lead to a slower pace of real spending growth, as seen in the 0.2 percent increase in Real PCE, and may prompt further scrutiny from policymakers regarding interest rate strategies.
Drivers of Personal Income Growth
The primary drivers behind the $149.2 billion increase in current-dollar personal income for March were:
- Compensation: This category, which includes wages, salaries, and benefits, saw a notable increase. This is a positive sign for the labor market, indicating that employers are continuing to invest in their workforce through higher pay and benefits. This aligns with broader economic indicators that suggest a tight labor market where demand for workers remains strong.
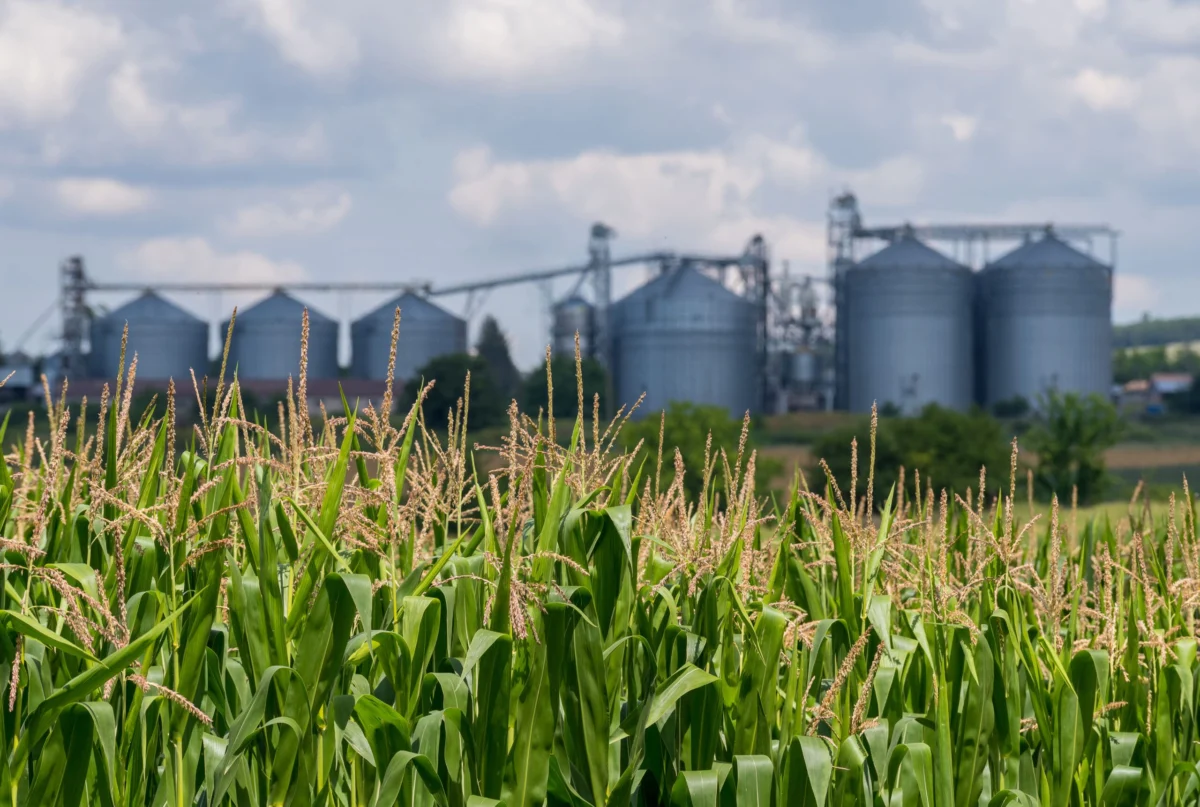
- Farm Proprietors’ Income: This component also experienced an increase, suggesting a favorable period for the agricultural sector. Factors such as crop yields, commodity prices, and government support programs can influence this income stream. A rise here indicates a healthy contribution from agriculture to the overall national income.
- Offsetting Decrease in Government Social Benefits: While not a driver of growth, it’s important to note that a decrease in "other government social benefits" partially offset the gains from compensation and farm income. This could be due to a variety of factors, such as the winding down of specific pandemic-related support programs or shifts in eligibility criteria for certain benefits. Understanding the specific nature of these benefits would provide further clarity on the composition of this decrease.
Personal Saving and Outlays: A Look at Financial Behavior
The relationship between income, spending, and saving offers insights into household financial behavior and economic stability.
Personal Outlays represent the total amount individuals spend on consumption, interest payments, and transfers. In March, personal outlays increased by $198.6 billion, closely mirroring the rise in personal consumption expenditures. This indicates that while consumers are spending more, the overall increase in outlays is primarily driven by their purchasing of goods and services.
Personal Saving in March was reported at $857.3 billion. This figure represents the amount of disposable income that households did not spend. The personal saving rate, which is personal saving as a percentage of disposable personal income (DPI), stood at 3.6 percent. This rate signifies that for every dollar of disposable income, households saved approximately 3.6 cents.
The saving rate of 3.6 percent in March suggests a moderate level of saving. While it indicates that households are still setting aside funds, it also implies a significant portion of disposable income is being channeled into consumption. Compared to periods of higher saving rates, such as those seen during the height of the pandemic when spending opportunities were limited, this rate reflects a normalization of consumer behavior. The increase in disposable income, coupled with strong consumer demand, has led to a situation where a larger absolute amount of money is being spent, which naturally exerts downward pressure on the saving rate when viewed as a percentage of income.
Broader Economic Context and Implications
The March data on personal income and spending arrives amidst a complex economic environment. While the robust growth in income and nominal spending signals underlying economic strength, the persistent inflationary pressures and the more moderate growth in real spending present a nuanced picture.
Positive Economic Momentum
The increase in compensation suggests a healthy labor market, which is a cornerstone of economic stability. When individuals earn more, they have greater capacity to spend, invest, and save, fueling further economic activity. The strong performance in both goods and services consumption indicates broad-based demand, which is crucial for business growth and job creation.
Inflationary Concerns and Policy Response
The rise in the PCE price index, especially the core measure, raises concerns about sustained inflation. Policymakers, including the Federal Reserve, closely monitor these figures to guide monetary policy decisions. Elevated inflation can erode purchasing power, increase the cost of borrowing, and potentially slow down economic growth if not managed effectively. The Federal Reserve has been actively working to bring inflation back to its target rate, and these latest figures will likely be a key factor in their upcoming policy deliberations. The divergence between nominal and real spending growth highlights the impact of inflation on consumers’ actual ability to increase their consumption of goods and services.
Consumer Behavior and Future Outlook
The personal saving rate of 3.6 percent suggests that consumers are balancing their spending needs with their saving goals. While the absolute amount of savings remains substantial, the rate indicates a shift towards increased consumption. This pattern of spending is generally positive for economic growth in the short term, but the sustainability of this trend will depend on continued income growth and the management of inflationary pressures.
The BEA’s release also included updates and technical notes that provide further context:
- Revisions to Previous Data: Estimates for January and February were updated to reflect new data on Medicaid benefits, demonstrating the dynamic nature of economic reporting and the BEA’s commitment to accuracy.
- Legal Services Price Adjustments: The BEA noted adjustments to the PCE price index for legal services in January and March. Such adjustments are part of the BEA’s methodology to ensure the accuracy of its inflation measures, reflecting changes in the quality and pricing of specific services.
- Upcoming Releases: The next release of Personal Income and Outlays data, covering April, is scheduled for May 28, 2026. This forthcoming report will provide the latest insights into the evolving economic landscape.
The March data presents a picture of an economy that is experiencing significant nominal growth, driven by increased earnings and robust consumer spending. However, the persistence of inflation remains a key challenge that will likely shape economic conditions and policy responses in the months ahead. The interplay between rising incomes, consumer spending, and inflationary pressures will be critical to monitor as the economy navigates the remainder of the year.