Lana Rhoades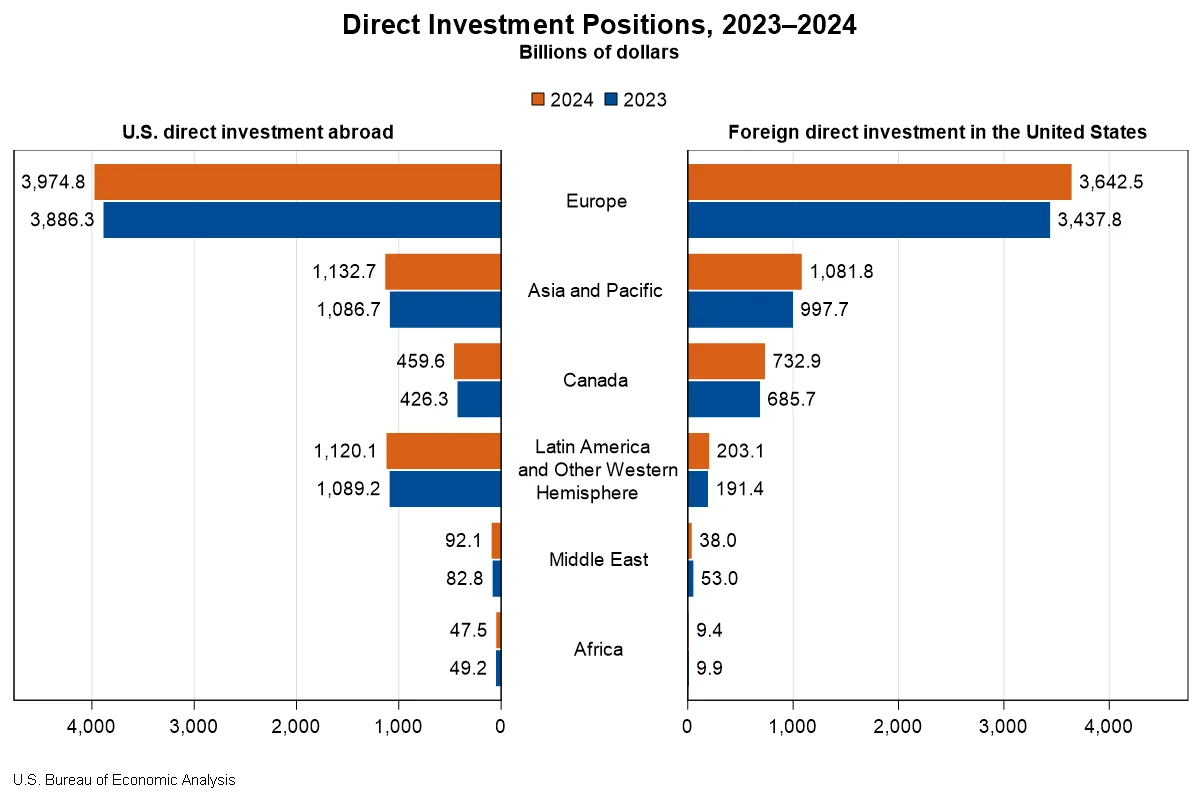
The cumulative level of U.S. direct investment abroad, a key indicator of American economic engagement internationally, experienced a significant surge in 2024, reaching a total of $6.83 trillion. This represents an increase of $206.3 billion from the previous year, according to the latest statistics released by the U.S. Bureau of Economic Analysis (BEA). Concurrently, foreign direct investment in the United States also demonstrated robust growth, climbing by $332.1 billion to a total of $5.71 trillion. These figures underscore a dynamic global investment landscape and highlight the interconnectedness of major economies.
European Markets Fuel U.S. Outbound Investment Surge
The expansion of U.S. direct investment abroad was notably concentrated in Europe, which saw an increase of $88.4 billion in investment positions. This growth was primarily driven by substantial investments in Luxembourg and Germany. These European economic powerhouses continue to be attractive destinations for American businesses seeking to expand their global footprint, likely due to their stable economic environments, access to skilled labor, and strategic market positions within the European Union.
By industry, manufacturing affiliates reported the largest increase in U.S. investment abroad. Within this sector, the production of computers and electronic products stood out, indicating a continued global demand for advanced technological goods and components manufactured by American companies or their foreign subsidiaries. This trend suggests that U.S. multinationals are strategically investing in their overseas manufacturing capabilities to optimize supply chains, access new markets, or leverage specialized production advantages.
Manufacturing Sector Dominates Inbound Foreign Investment
On the other side of the ledger, foreign direct investment in the United States also witnessed a substantial increase, with Europe again playing a pivotal role. The total foreign direct investment position in the U.S. rose by $332.1 billion to $5.71 trillion. Of this growth, Europe contributed a significant $204.7 billion. Key contributors within Europe included the United Kingdom, which saw a $52.9 billion increase in its investment position in the U.S., and Germany, with an increase of $39.7 billion.
Similar to outbound investment, the manufacturing sector was the primary beneficiary of inbound foreign investment. This indicates a strong global confidence in the U.S. manufacturing base, its technological capabilities, and its domestic market. The BEA data reveals that affiliates in the U.S. manufacturing sector experienced the most substantial increase in foreign investment, signaling a renewed interest from international entities in establishing or expanding their production and operational presence within the United States.
Top Destinations for U.S. Outbound Investment
While U.S. multinational enterprises (MNEs) invest in a vast array of countries, their cumulative direct investment abroad is significantly concentrated in a few key economies. At the close of 2024, the United Kingdom remained the leading destination for U.S. direct investment, with a total position of $1,024.6 billion. The Netherlands followed closely with $1,012.0 billion, and Luxembourg held the third position with $569.6 billion. Singapore ($467.6 billion) and Ireland ($466.8 billion) rounded out the top five countries attracting U.S. direct investment. This concentration highlights the strategic importance of these nations for U.S. global business operations, often serving as hubs for regional operations, financial centers, or key markets.
Industry Breakdown of U.S. Outbound Investment
Examining the industry composition of U.S. direct investment abroad reveals distinct patterns. Holding companies accounted for the largest share of the total U.S. direct investment position abroad, representing 47.3 percent in 2024. This suggests that a significant portion of U.S. overseas investment is structured through holding entities, potentially for tax efficiency, asset management, or strategic corporate structuring.
Manufacturing affiliates secured the second-largest share, accounting for 16.0 percent of the total outbound investment. This underscores the continued importance of manufacturing in the global operations of U.S. MNEs. Finance and insurance affiliates ranked third, with 14.2 percent of U.S. investment abroad. When viewed from the perspective of the U.S. parent company’s industry, manufacturing MNEs were the most significant investors abroad, contributing 50.9 percent of the total position. MNEs in the finance and insurance sectors followed, representing 15.1 percent of the outbound investment.
Income Generation from U.S. Investments Abroad
In 2024, U.S. MNEs generated substantial income from their cumulative investments abroad. The total income earned reached $601.9 billion, marking a 3.8 percent increase compared to the previous year. The finance and insurance sector was a significant driver of this income growth, with earnings increasing by $12.0 billion, a notable rise of 17.6 percent from 2023. This indicates a strong performance of U.S.-owned financial and insurance operations in foreign markets.
Key Sources of Foreign Direct Investment in the U.S.
The landscape of foreign direct investment in the United States is similarly characterized by concentrations in specific countries. At the end of 2024, four countries accounted for more than half of the total foreign direct investment position in the U.S. Japan emerged as the leading investing nation, with a substantial position of $754.1 billion. The United Kingdom followed closely with $742.7 billion, followed by Canada at $732.9 billion, and the Netherlands with $726.4 billion. These figures reflect long-standing economic ties and strategic investments by these nations in the U.S. economy.
The Role of Ultimate Beneficial Owners (UBOs)
An analysis based on the country of the ultimate beneficial owner (UBO) provides a deeper insight into the origins of foreign investment. On this basis, Japan again ranked as the top investing country in the U.S. for 2024, with an investment position of $819.2 billion. Canada secured the second position with $811.7 billion, and Germany was third with $677.3 billion.
Interestingly, when examining investment by UBO, the positions from the Netherlands and Luxembourg were considerably lower than when viewed by the country of the foreign parent. This suggests that a significant portion of investment channeled through Dutch and Luxembourgish parent companies ultimately originates from investors in other countries. This phenomenon is often attributed to the role of these nations as financial centers that facilitate international capital flows.
Industry Concentration of Inbound Investment
The U.S. manufacturing sector continues to be a primary recipient of foreign direct investment, accounting for 42.3 percent of the total position in 2024. The total investment position of foreign MNEs in U.S. manufacturing reached $2.42 trillion. Within this broad sector, chemical manufacturing alone accounted for a third of the total manufacturing investment, amounting to $827.5 billion. This highlights the strategic importance of the U.S. chemical industry for global players. Sizable investments were also observed in the finance and insurance sector ($599.4 billion) and wholesale trade ($520.5 billion), indicating the diverse attractiveness of the U.S. economy to foreign investors.
Income Earned by Foreign Investors in the U.S.
Foreign MNEs earned a significant income of $310.9 billion in 2024 from their cumulative investments in the United States. This represents a notable increase of 13.1 percent from the previous year, underscoring the profitability and robust returns available to foreign investors operating within the U.S. market.
Historical Context and Revisions
The BEA also provided revised statistics for 2022 and 2023, reflecting the incorporation of newly available and updated source data. For 2022, U.S. direct investment abroad was revised to $6,245 billion from a previously published $6,313 billion, while foreign direct investment in the U.S. was revised to $5,124 billion from $5,167 billion. In 2023, U.S. direct investment abroad was revised to $6,620 billion from $6,676 billion, and foreign direct investment in the U.S. was revised to $5,376 billion from $5,394 billion. These revisions are standard practice and ensure the accuracy and reliability of the economic data.
Implications for the Global Economy
The robust growth in both U.S. outbound and inbound direct investment in 2024 signals a healthy and active global economic environment. The continued strength of European markets as both sources and destinations for investment underscores their integral role in the international financial system. The significant investment in the manufacturing sector, both by U.S. companies abroad and by foreign companies in the U.S., suggests a sustained global focus on production, innovation, and supply chain resilience.
The data also highlights the strategic importance of holding companies and financial centers like Luxembourg and the Netherlands in structuring international investments. The analysis of UBOs provides a more nuanced understanding of capital flows, revealing that investment often follows complex global ownership structures.
For the United States, the strong inflow of foreign direct investment, particularly into its manufacturing sector, is a positive indicator of its attractiveness as an investment destination. It suggests continued job creation, technological transfer, and economic expansion within the U.S. Conversely, the significant U.S. investment abroad demonstrates the global competitiveness and reach of American corporations, contributing to their profitability and the U.S. economy’s overall economic health.
The BEA’s commitment to providing detailed data, including breakdowns by country, industry, and ownership structure, is crucial for policymakers, businesses, and researchers seeking to understand and navigate the complexities of international economic relations. As global economic dynamics continue to evolve, these comprehensive statistics will remain essential for informed decision-making and strategic planning. The next release of direct investment data, scheduled for July 2026, will provide insights into the 2025 investment landscape, offering a continued view into the ongoing trends and shifts in global capital flows.