The United States experienced a significant reduction in its current-account deficit during the fourth quarter of 2025, a key indicator of the nation’s economic interactions with the rest of the world. The deficit, which reflects the balance of trade in goods and services, income from investments, and unilateral transfers, contracted by $48.4 billion, or 20.2 percent, to $190.7 billion. This improvement represents a positive shift in the nation’s international economic standing, bringing the deficit down from a revised $239.1 billion in the third quarter of the same year.
This narrowing of the current-account deficit, as reported by the U.S. Bureau of Economic Analysis (BEA), is particularly noteworthy as it reduced the deficit’s share of the nation’s gross domestic product (GDP) to 2.4 percent, a decrease from 3.1 percent in the preceding quarter. This suggests a more balanced economic relationship with foreign entities during the latter part of 2025.
Key Drivers of the Deficit Reduction
The substantial improvement in the fourth quarter was primarily attributed to two significant factors: a turnaround in the balance on primary income from a deficit to a surplus, and a reduction in the deficit associated with goods trade. These developments indicate a dual improvement in both investment income flows and the trade of tangible products.
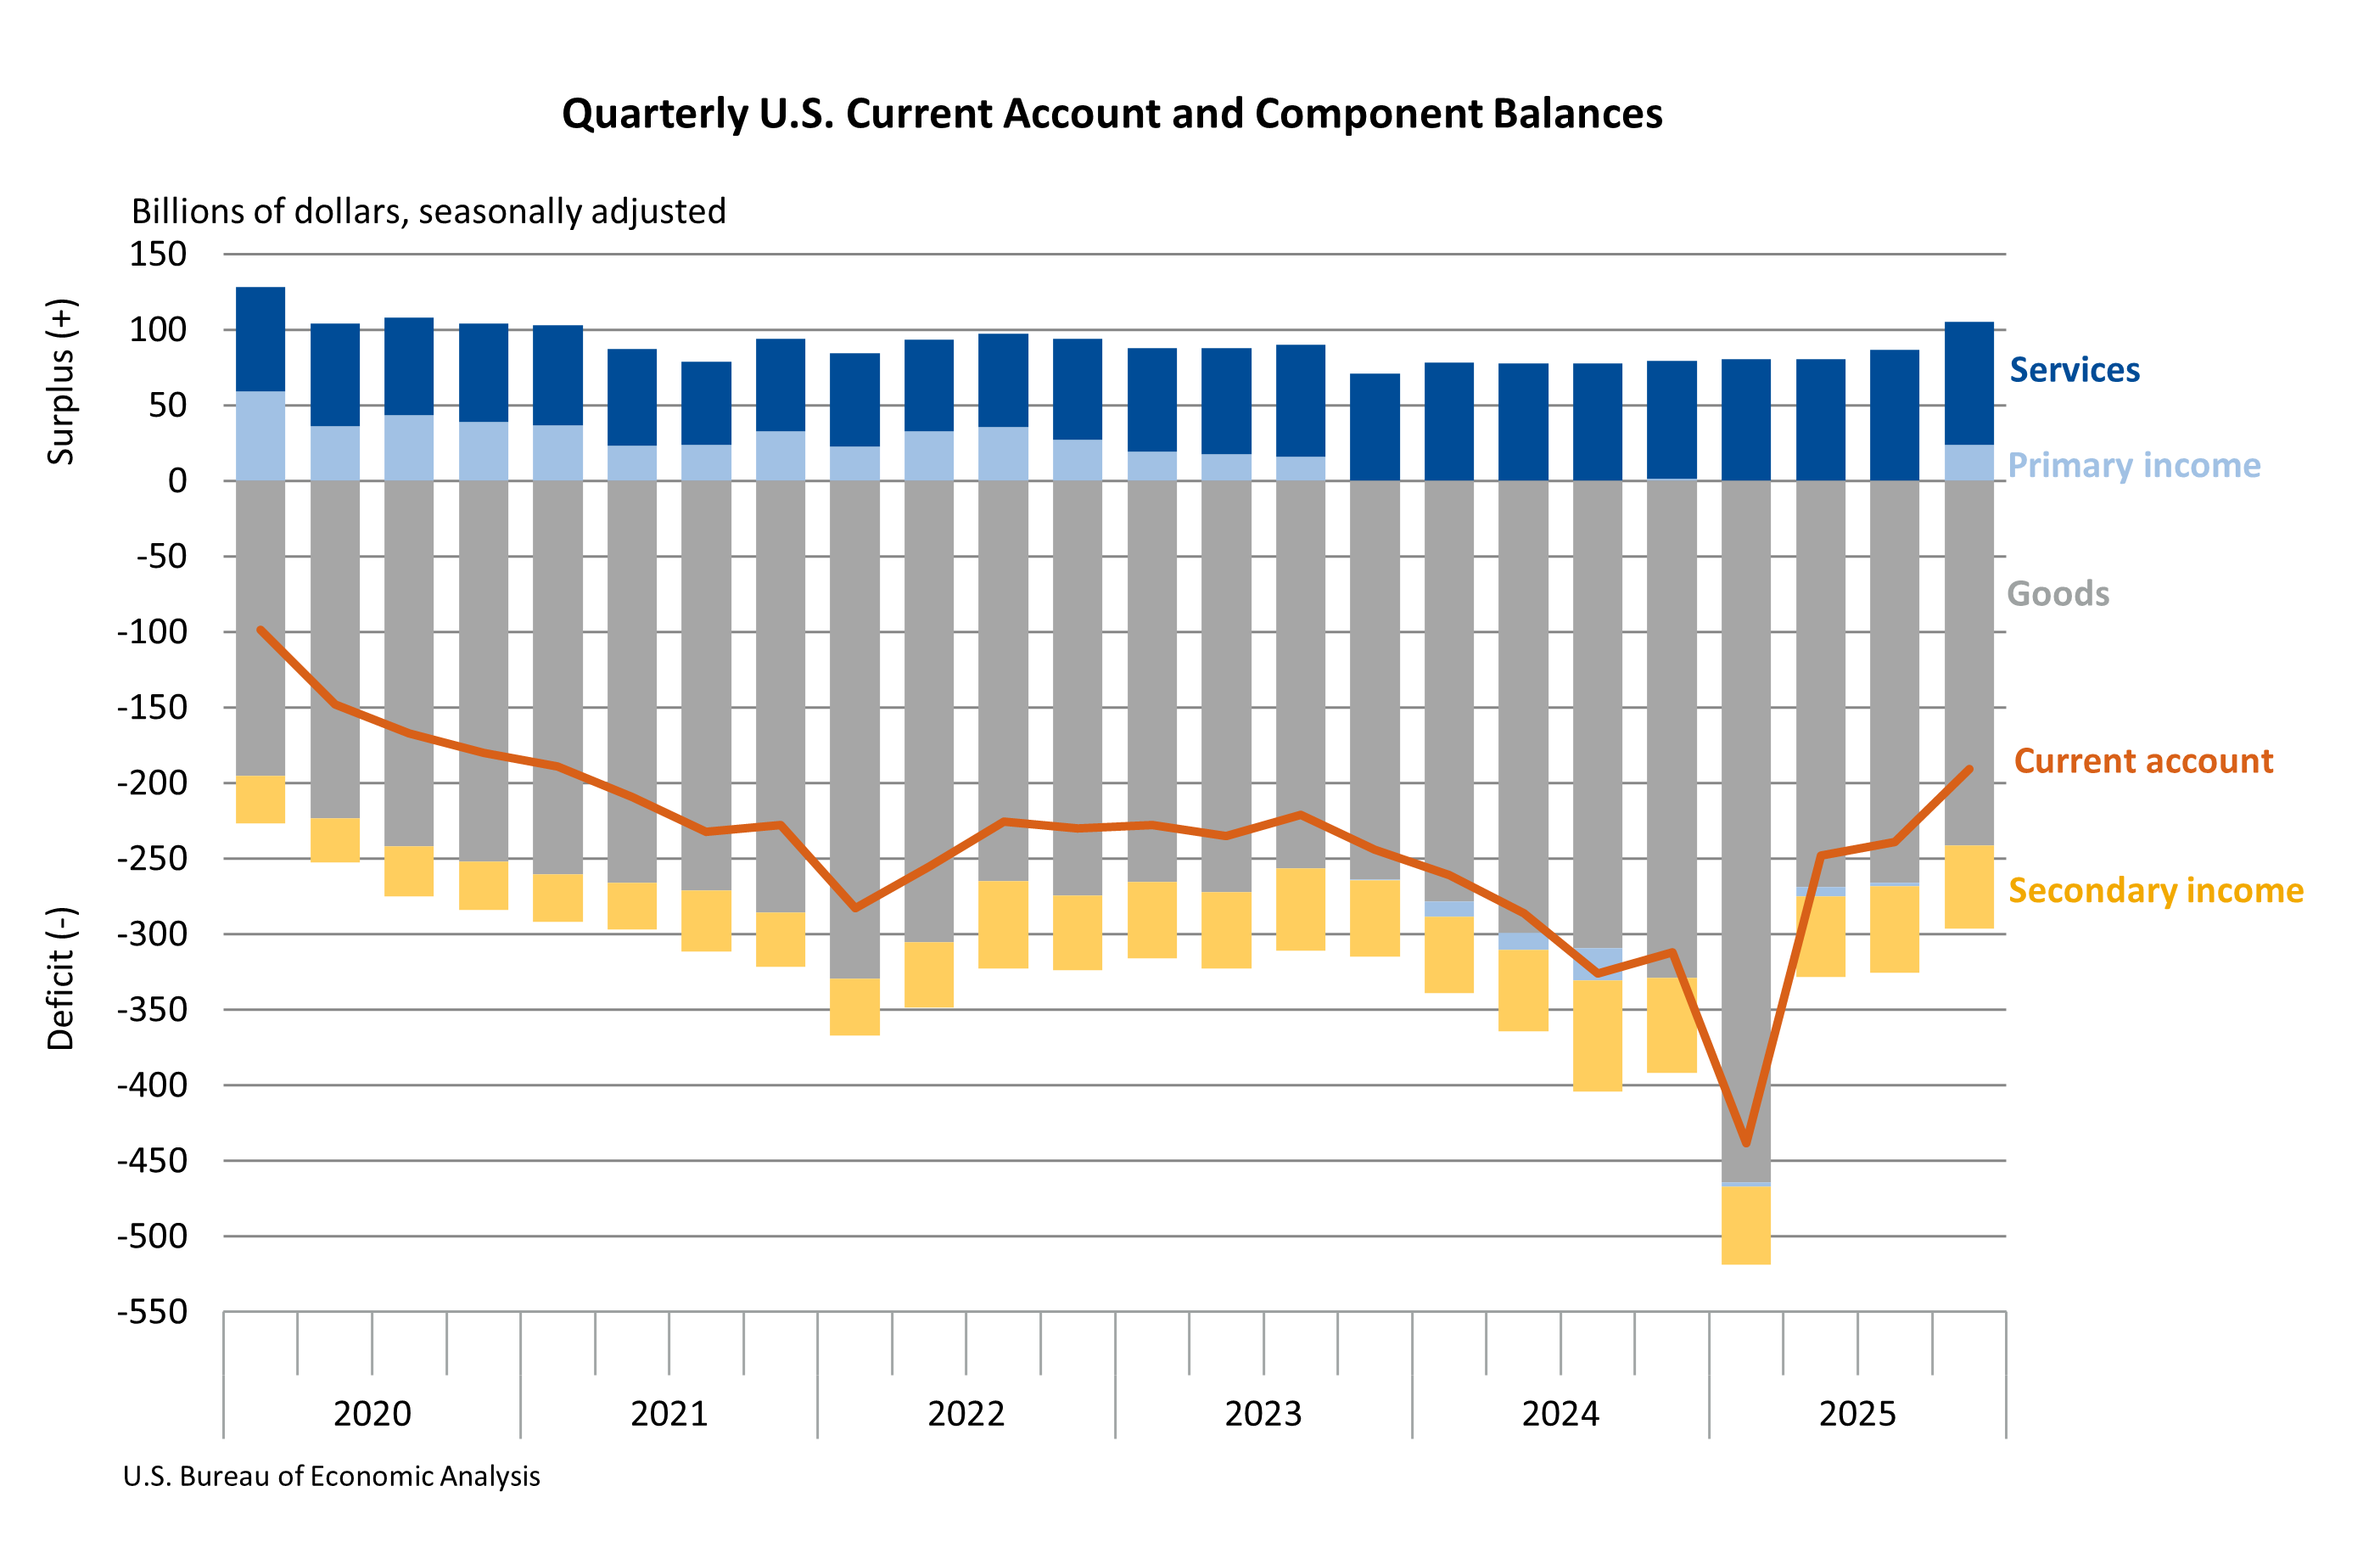
Primary income, which includes earnings from foreign direct investments and portfolio investments, saw a positive swing. In the third quarter, the U.S. recorded a deficit in primary income, meaning more income was paid out to foreign residents than was received from abroad. However, by the fourth quarter, this dynamic had reversed, contributing positively to the current account. Concurrently, the deficit in goods trade diminished, implying either an increase in the value of goods exported or a decrease in the value of goods imported, or a combination of both.
Trade Dynamics in the Fourth Quarter
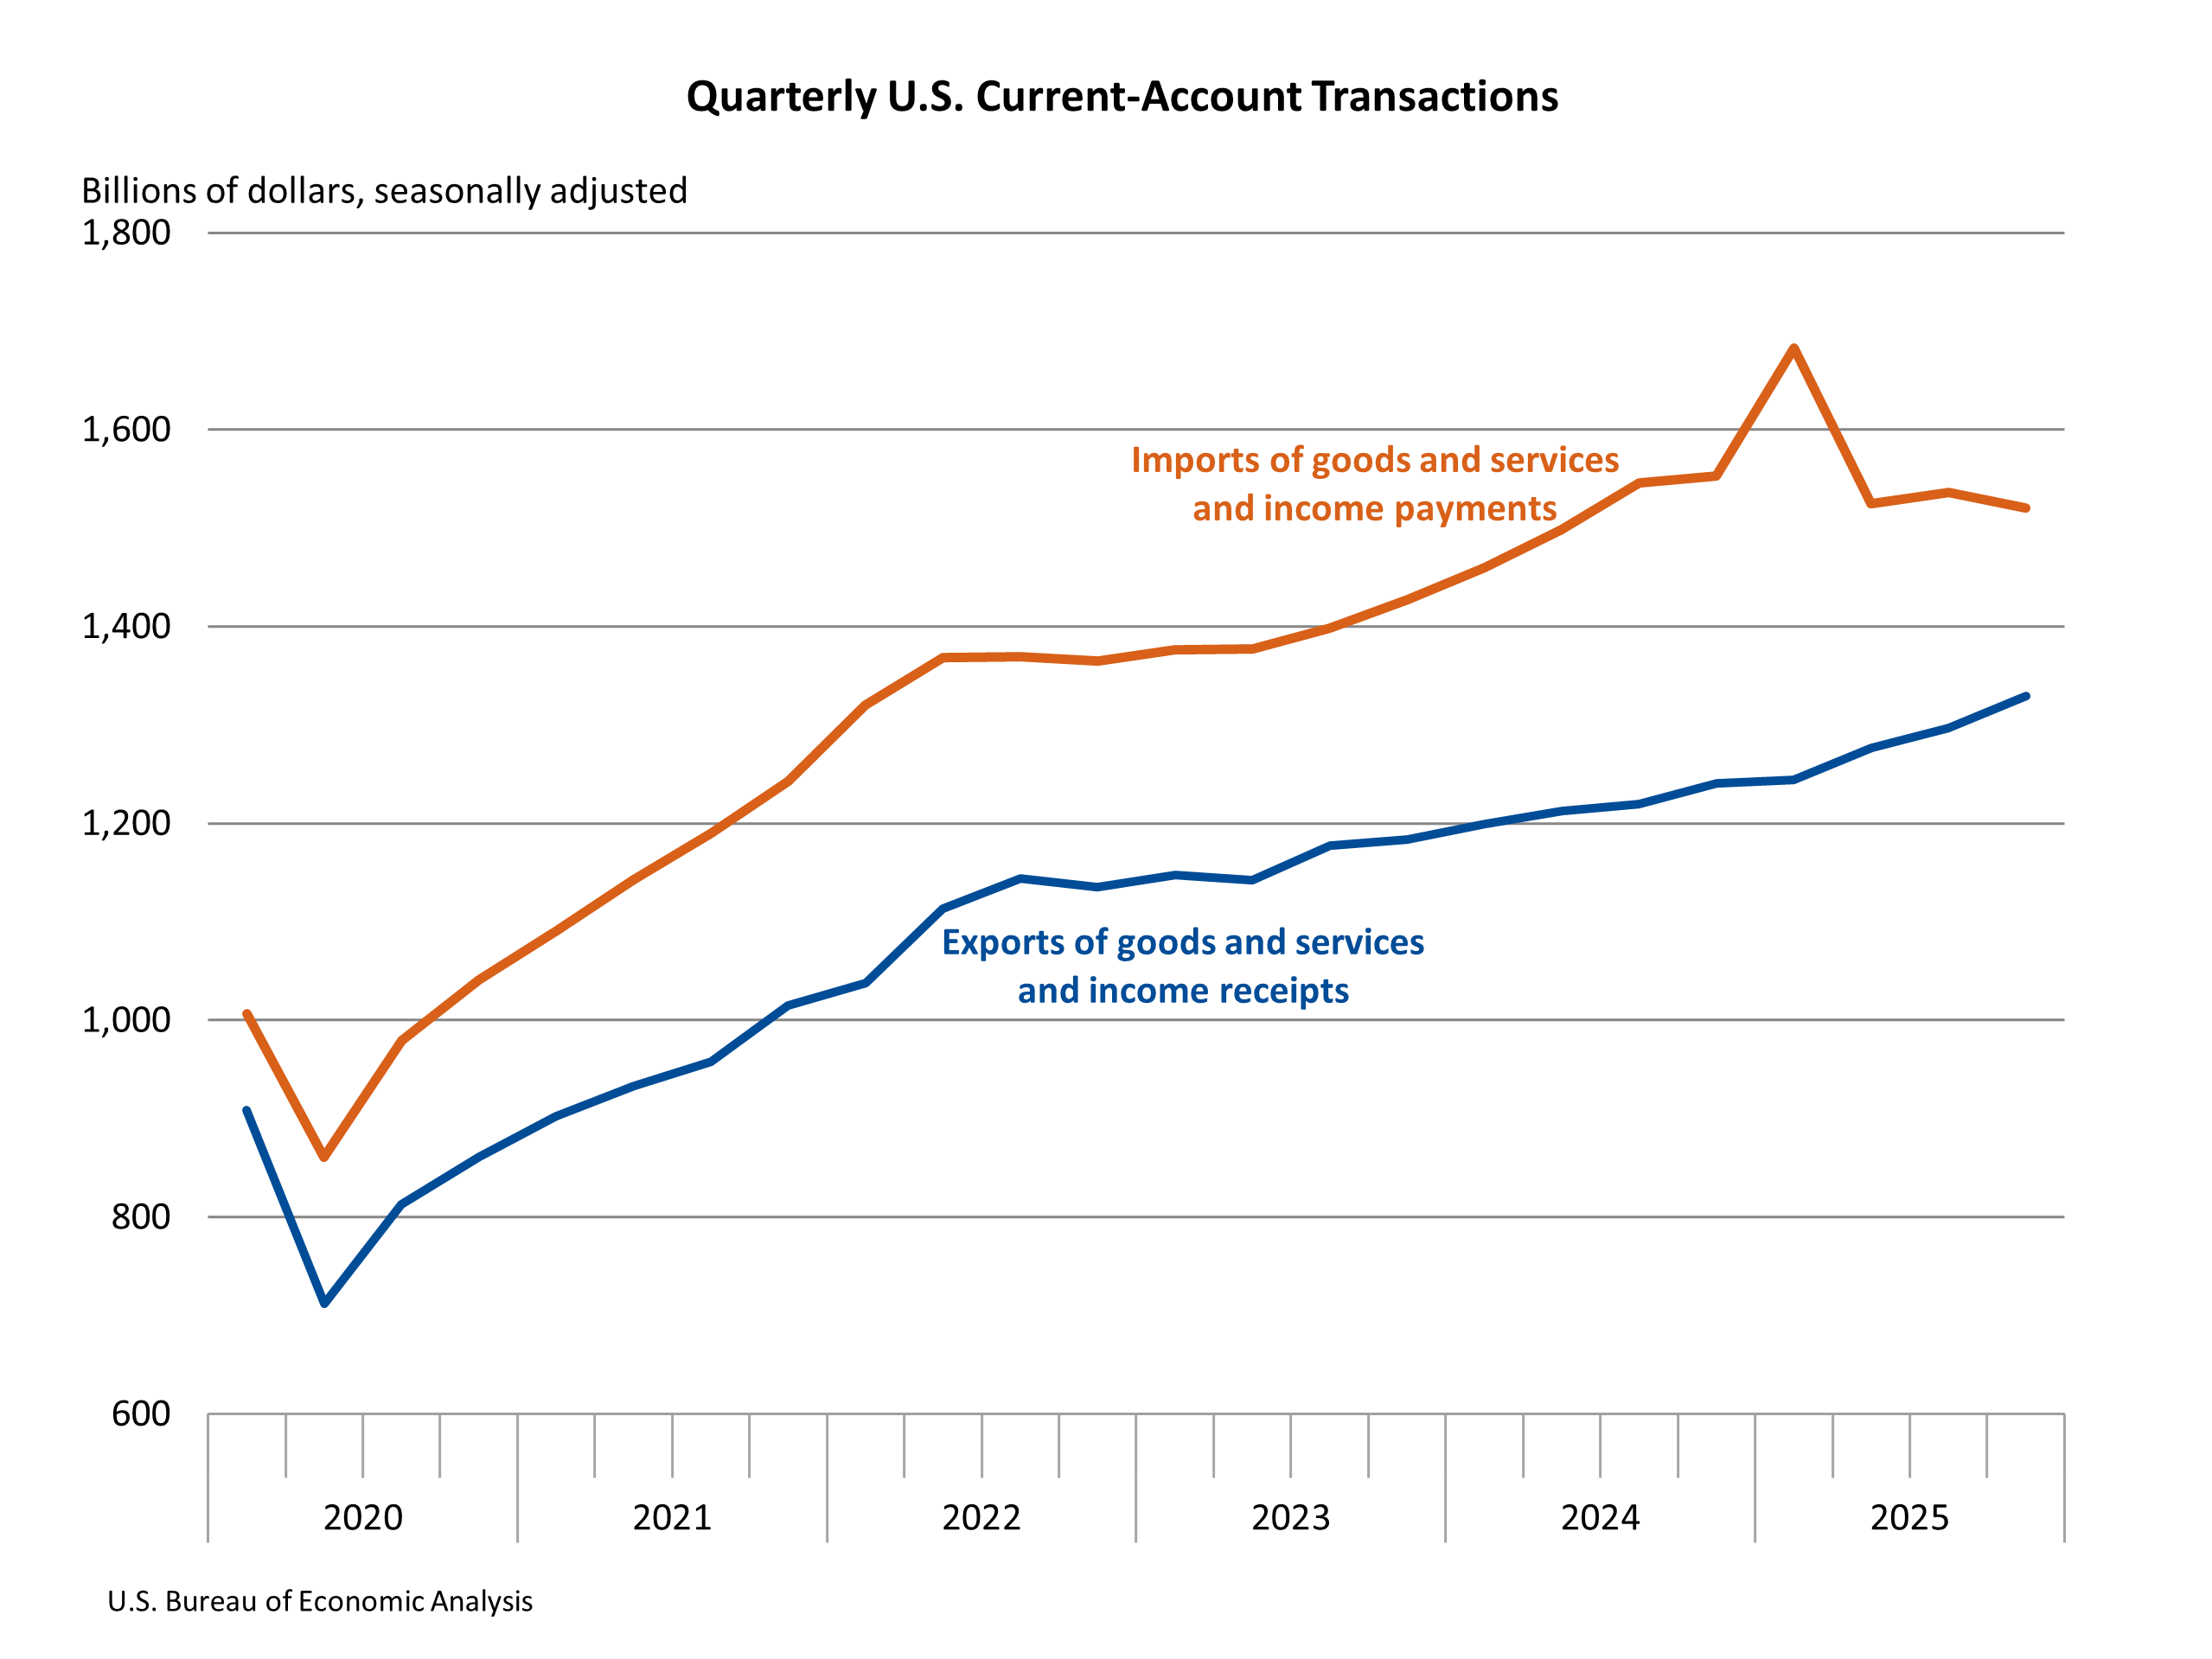
Overall exports of goods and services to, and income received from, foreign residents saw a robust increase of $32.4 billion, reaching a total of $1.33 trillion in the fourth quarter. This rise was propelled by notable increases in the value of goods exports and a surge in primary income receipts from overseas investments. This indicates a strengthening demand for American products and a more lucrative return on U.S. investments held abroad.
Conversely, imports of goods and services from, and income paid to, foreign residents experienced a decline of $16.0 billion, settling at $1.52 trillion. This decrease was largely driven by lower primary income payments to foreign residents and a reduction in the value of goods imported into the U.S. The combined effect of increased exports and decreased imports in goods trade played a crucial role in narrowing the overall trade deficit.
Capital Transfers and Financial Account Transactions
Beyond the core components of trade and income, capital transfers also played a role, albeit a smaller one, in the current account balance. Capital-transfer receipts, which are one-sided transactions without any direct quid pro quo, decreased by $80 million to $101 million in the fourth quarter. In contrast, capital-transfer payments saw a significant increase of $1.8 billion, reaching $3.0 billion. These movements, while not as impactful as trade or income flows, still contribute to the overall current-account calculation.
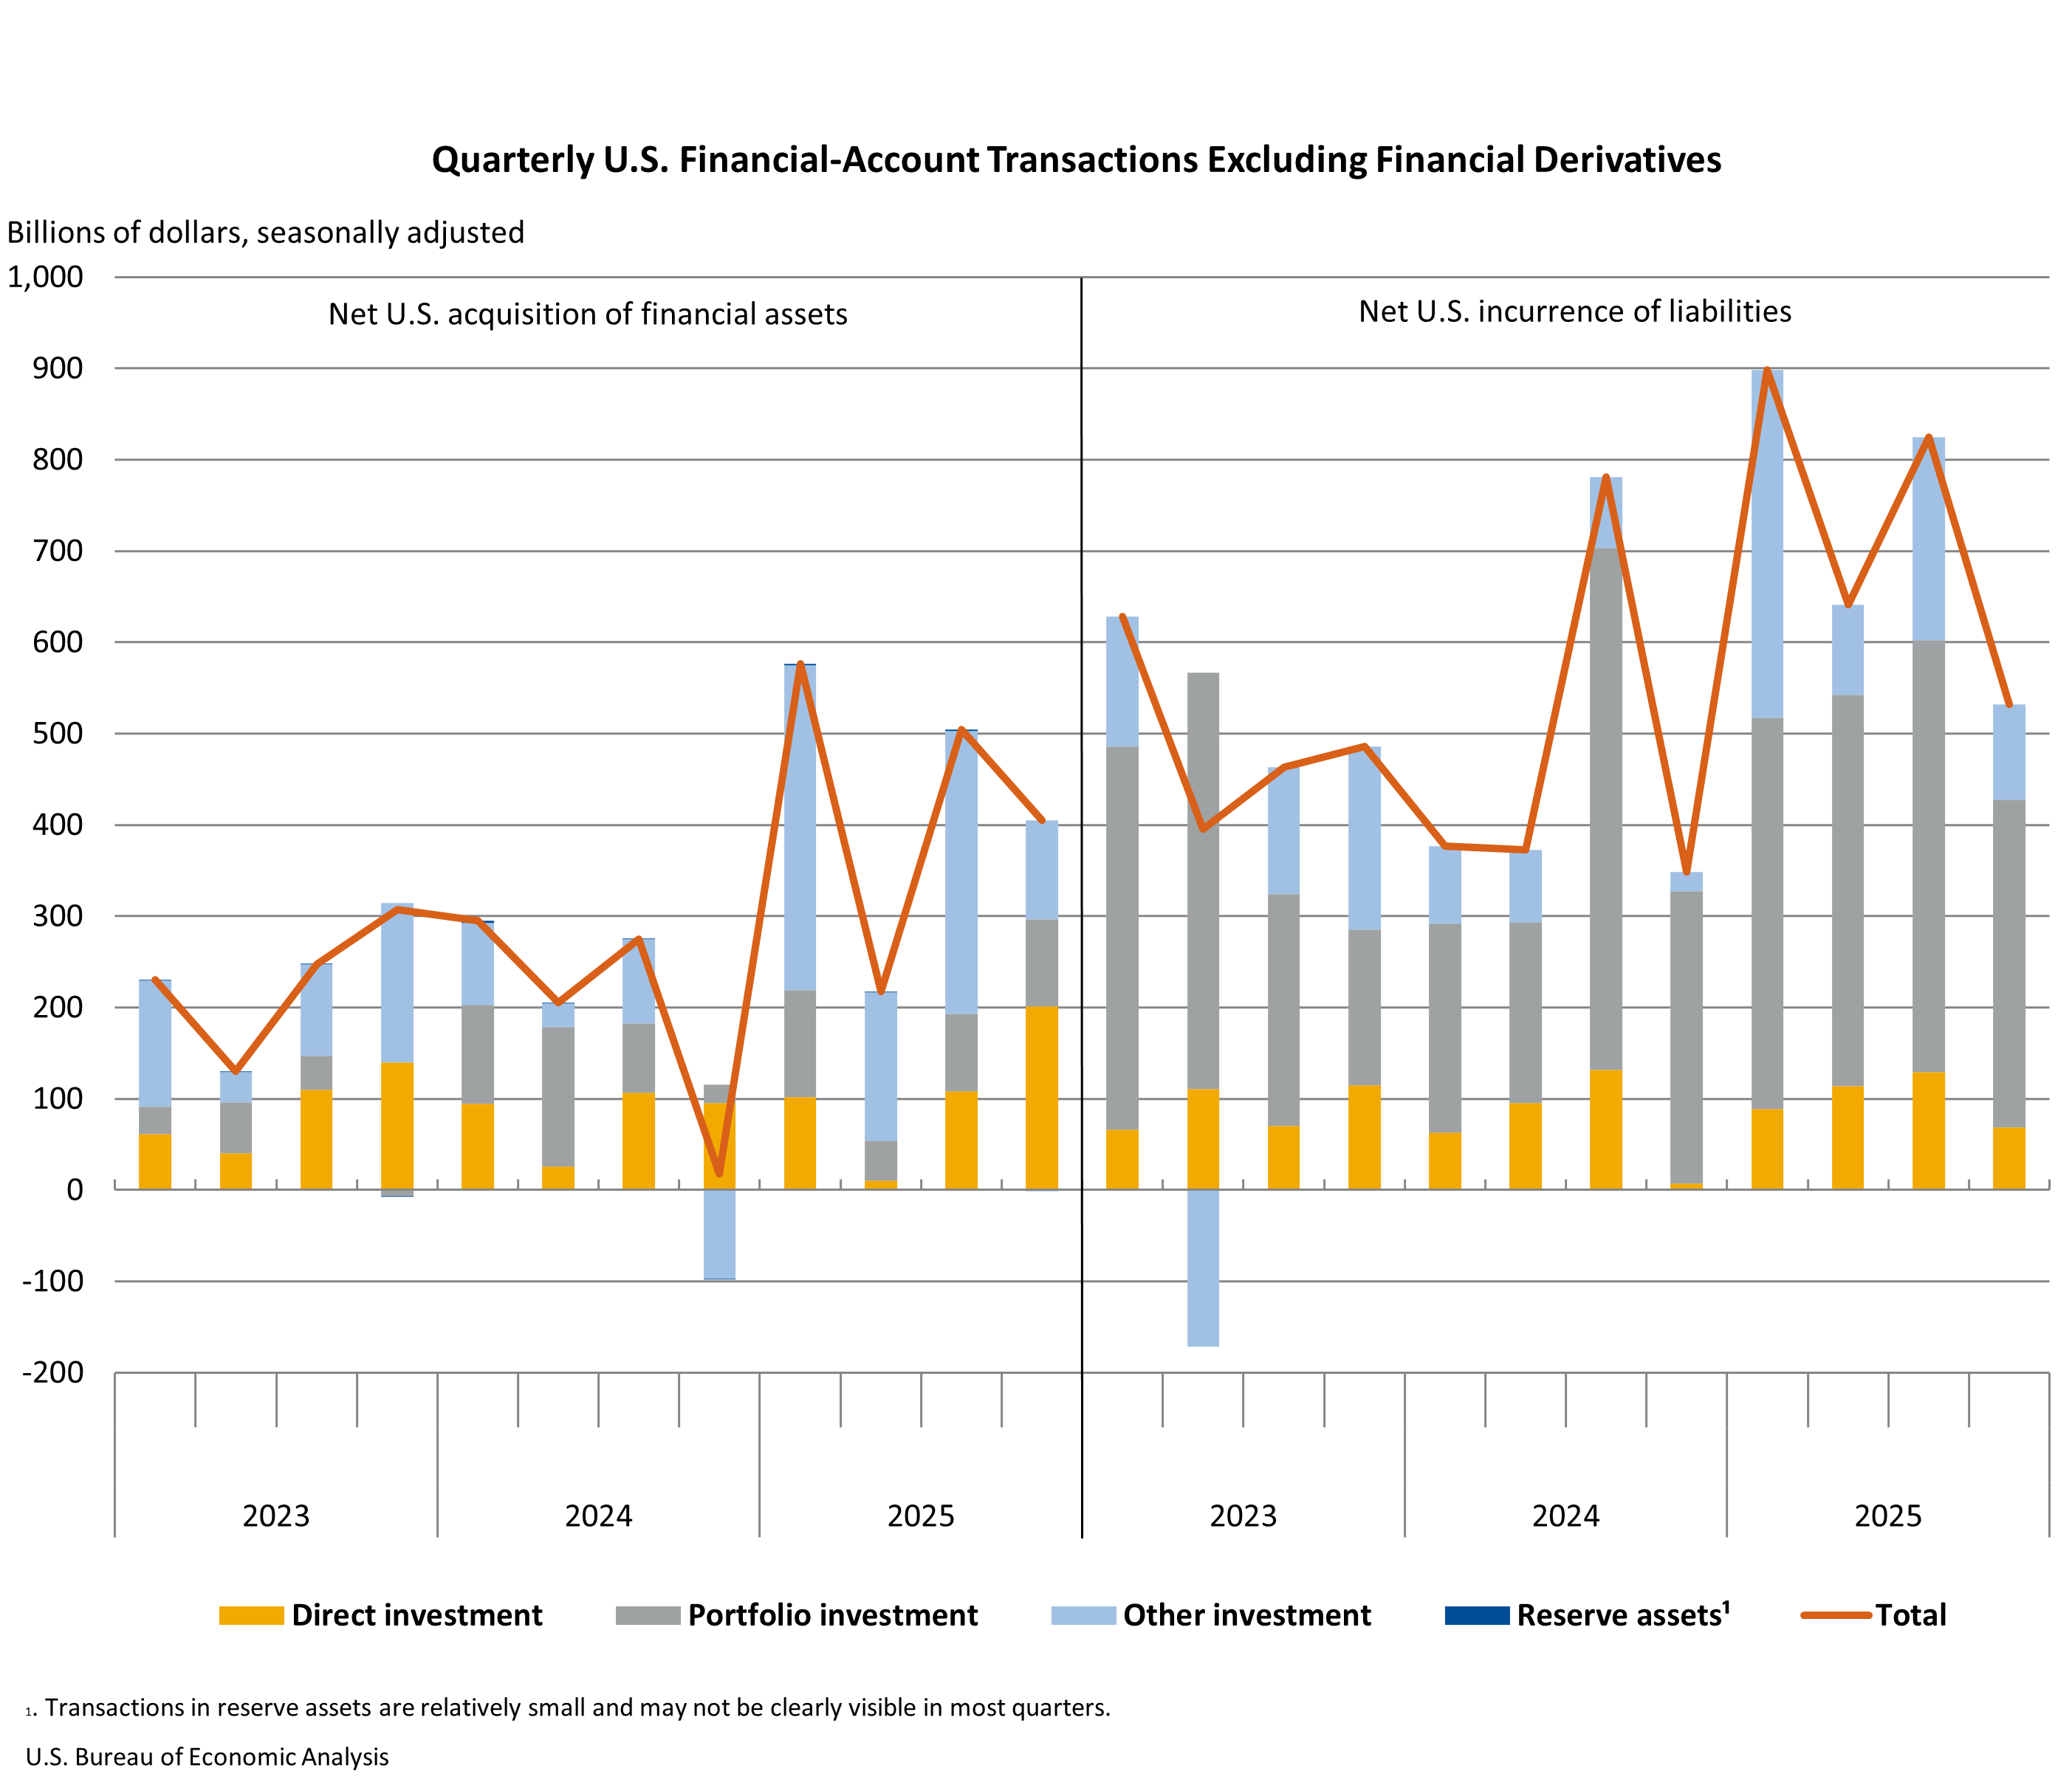
The financial account, which tracks cross-border investment flows, presented a different picture. Net financial-account transactions for the fourth quarter were -$135.9 billion. This negative balance signifies that the U.S. engaged in net borrowing from foreign residents, meaning liabilities to foreigners increased more than foreign assets acquired by U.S. residents. Specifically, U.S. residents increased their holdings of foreign financial assets by $405.0 billion, while simultaneously increasing their liabilities to foreign residents by a larger $532.0 billion. This net outflow of capital underscores the U.S.’s role as a destination for foreign investment.
U.S. Net International Investment Position
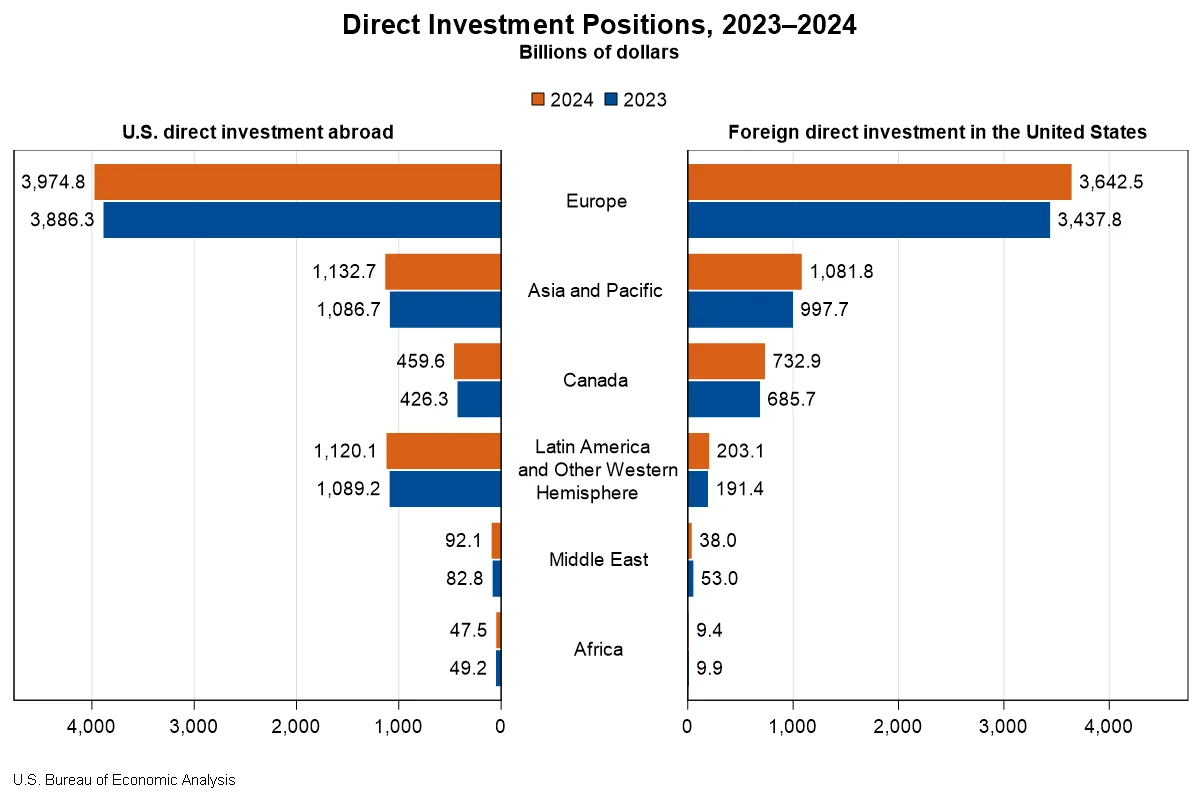
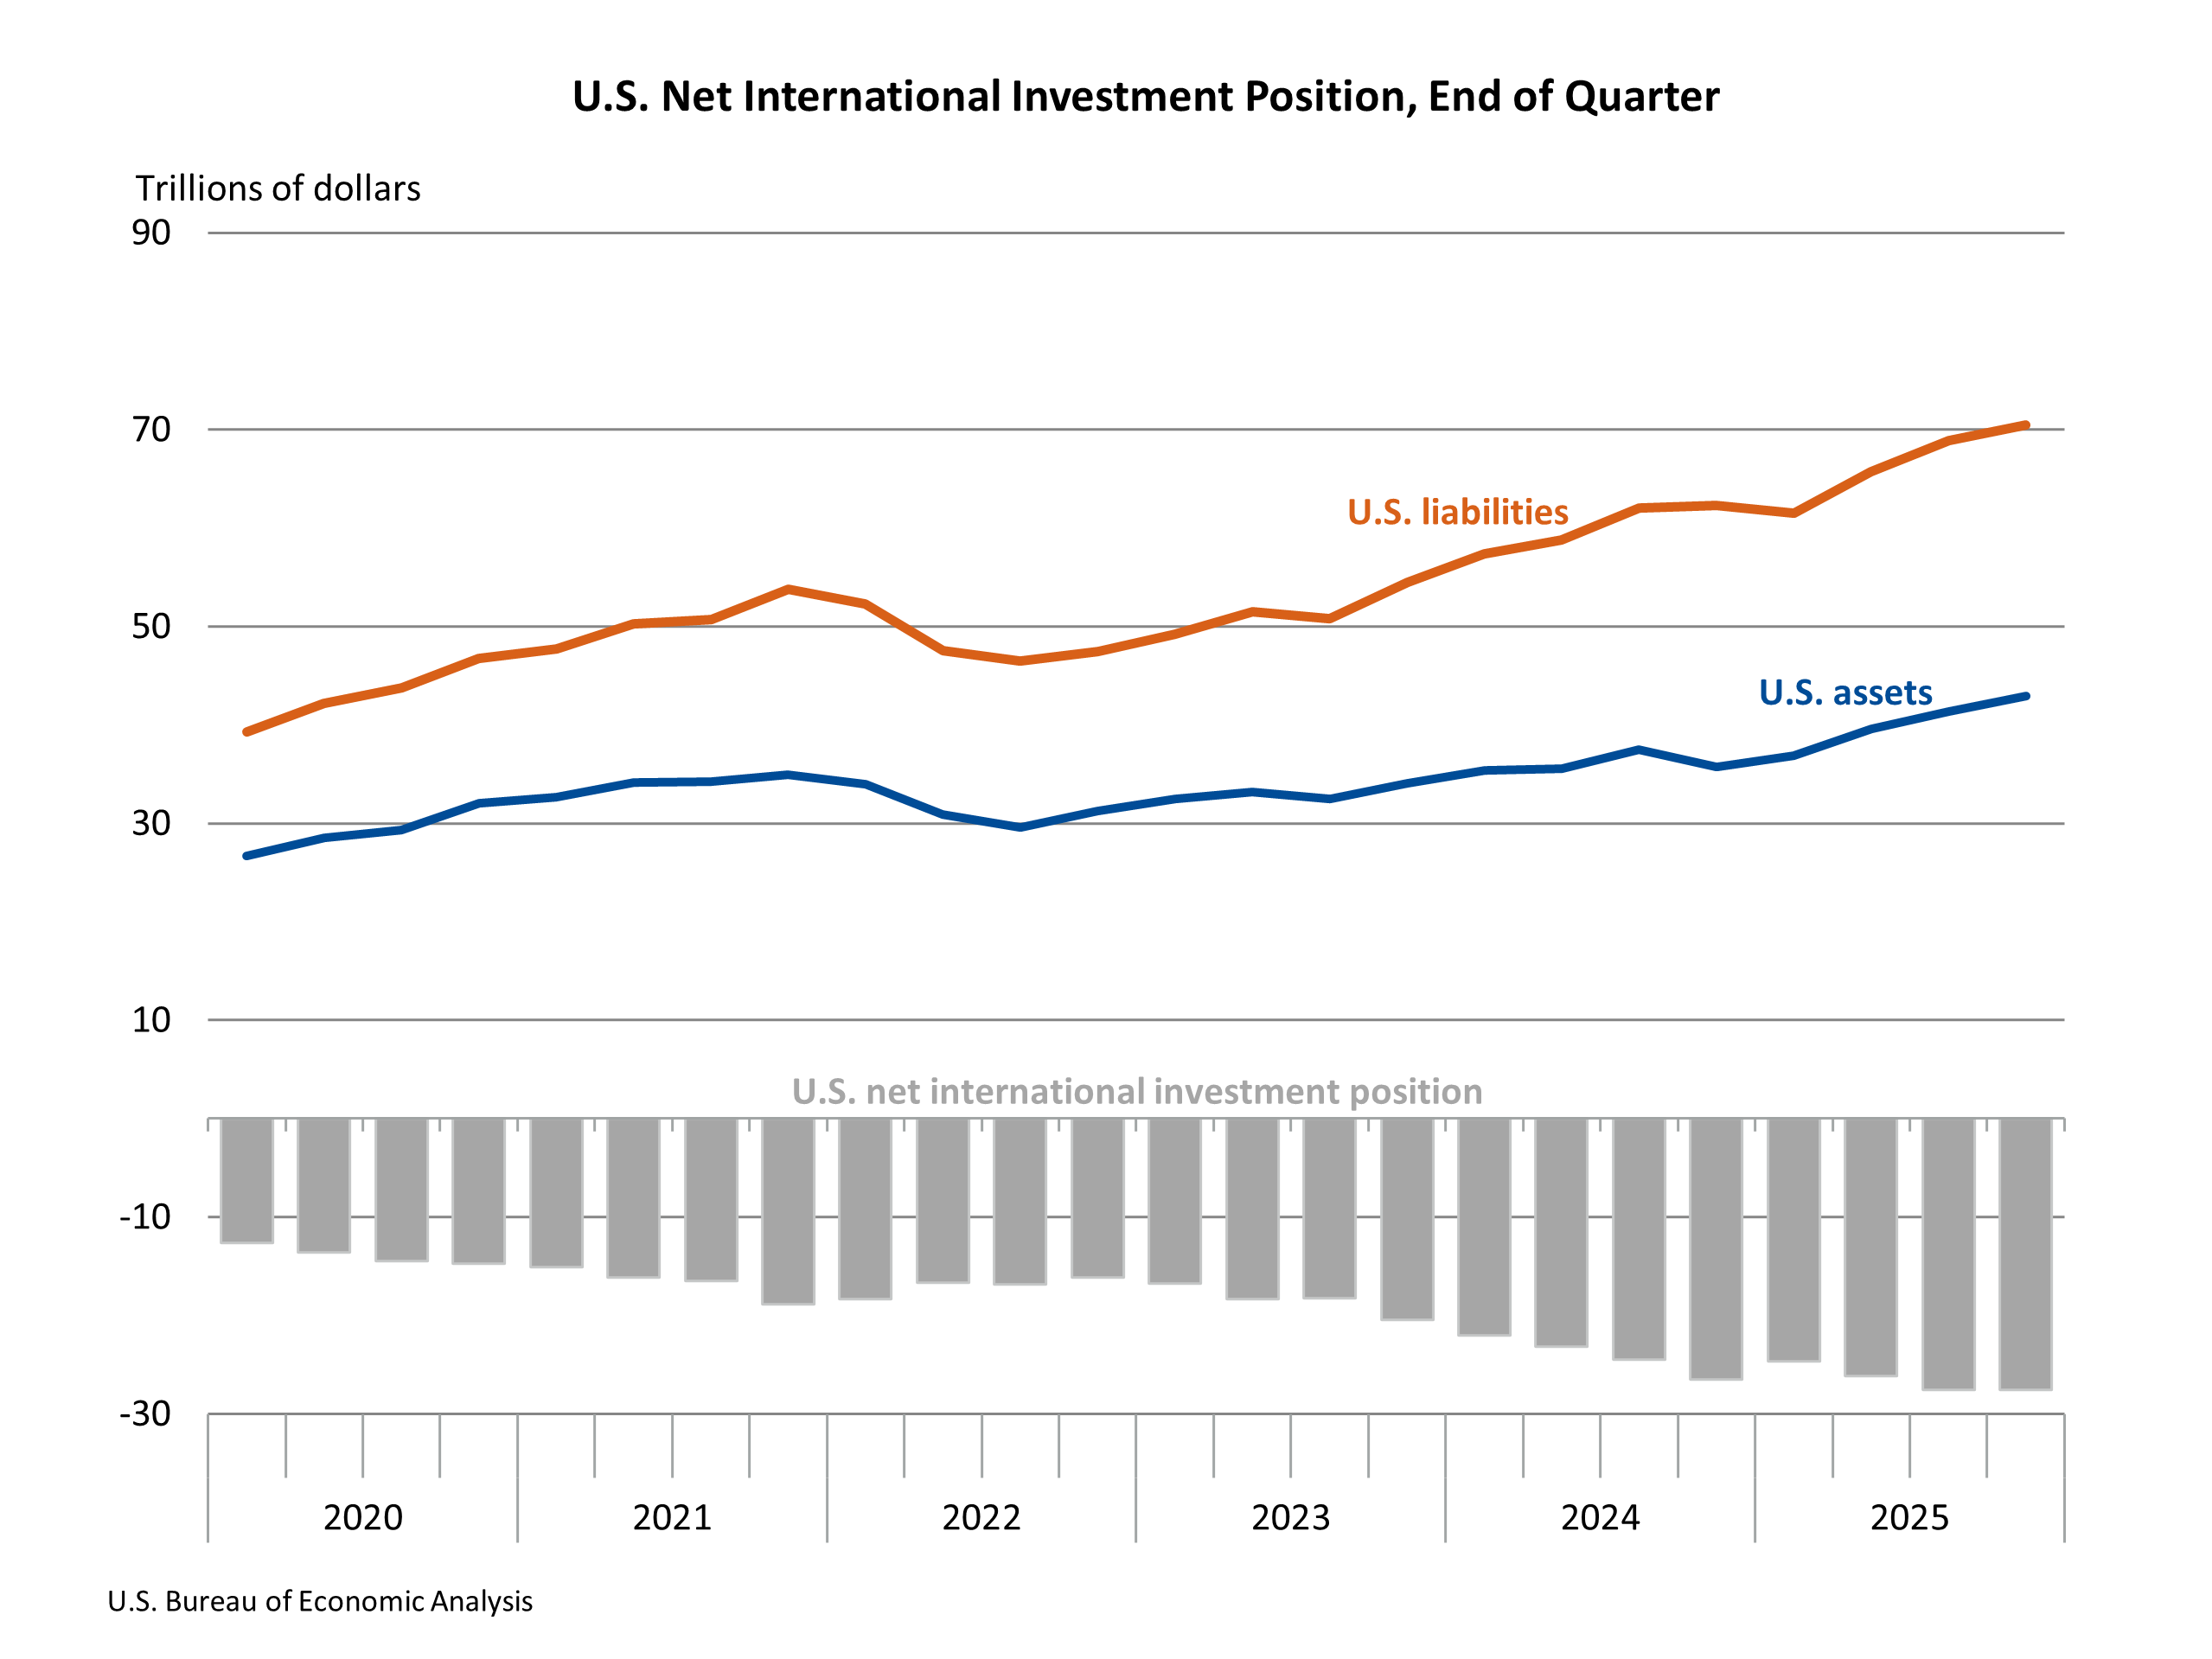
At the close of the fourth quarter of 2025, the U.S. net international investment position—the difference between the value of U.S. residents’ foreign financial assets and their liabilities to foreign residents—stood at -$27.54 trillion. This substantial net liability position has been a persistent feature of the U.S. economy, reflecting decades of cumulative borrowing from abroad.
U.S. assets abroad totaled $42.96 trillion, while liabilities to foreign residents amounted to $70.49 trillion. This represents a slight improvement from the end of the third quarter of 2025, when the net investment position was -$27.55 trillion (revised).
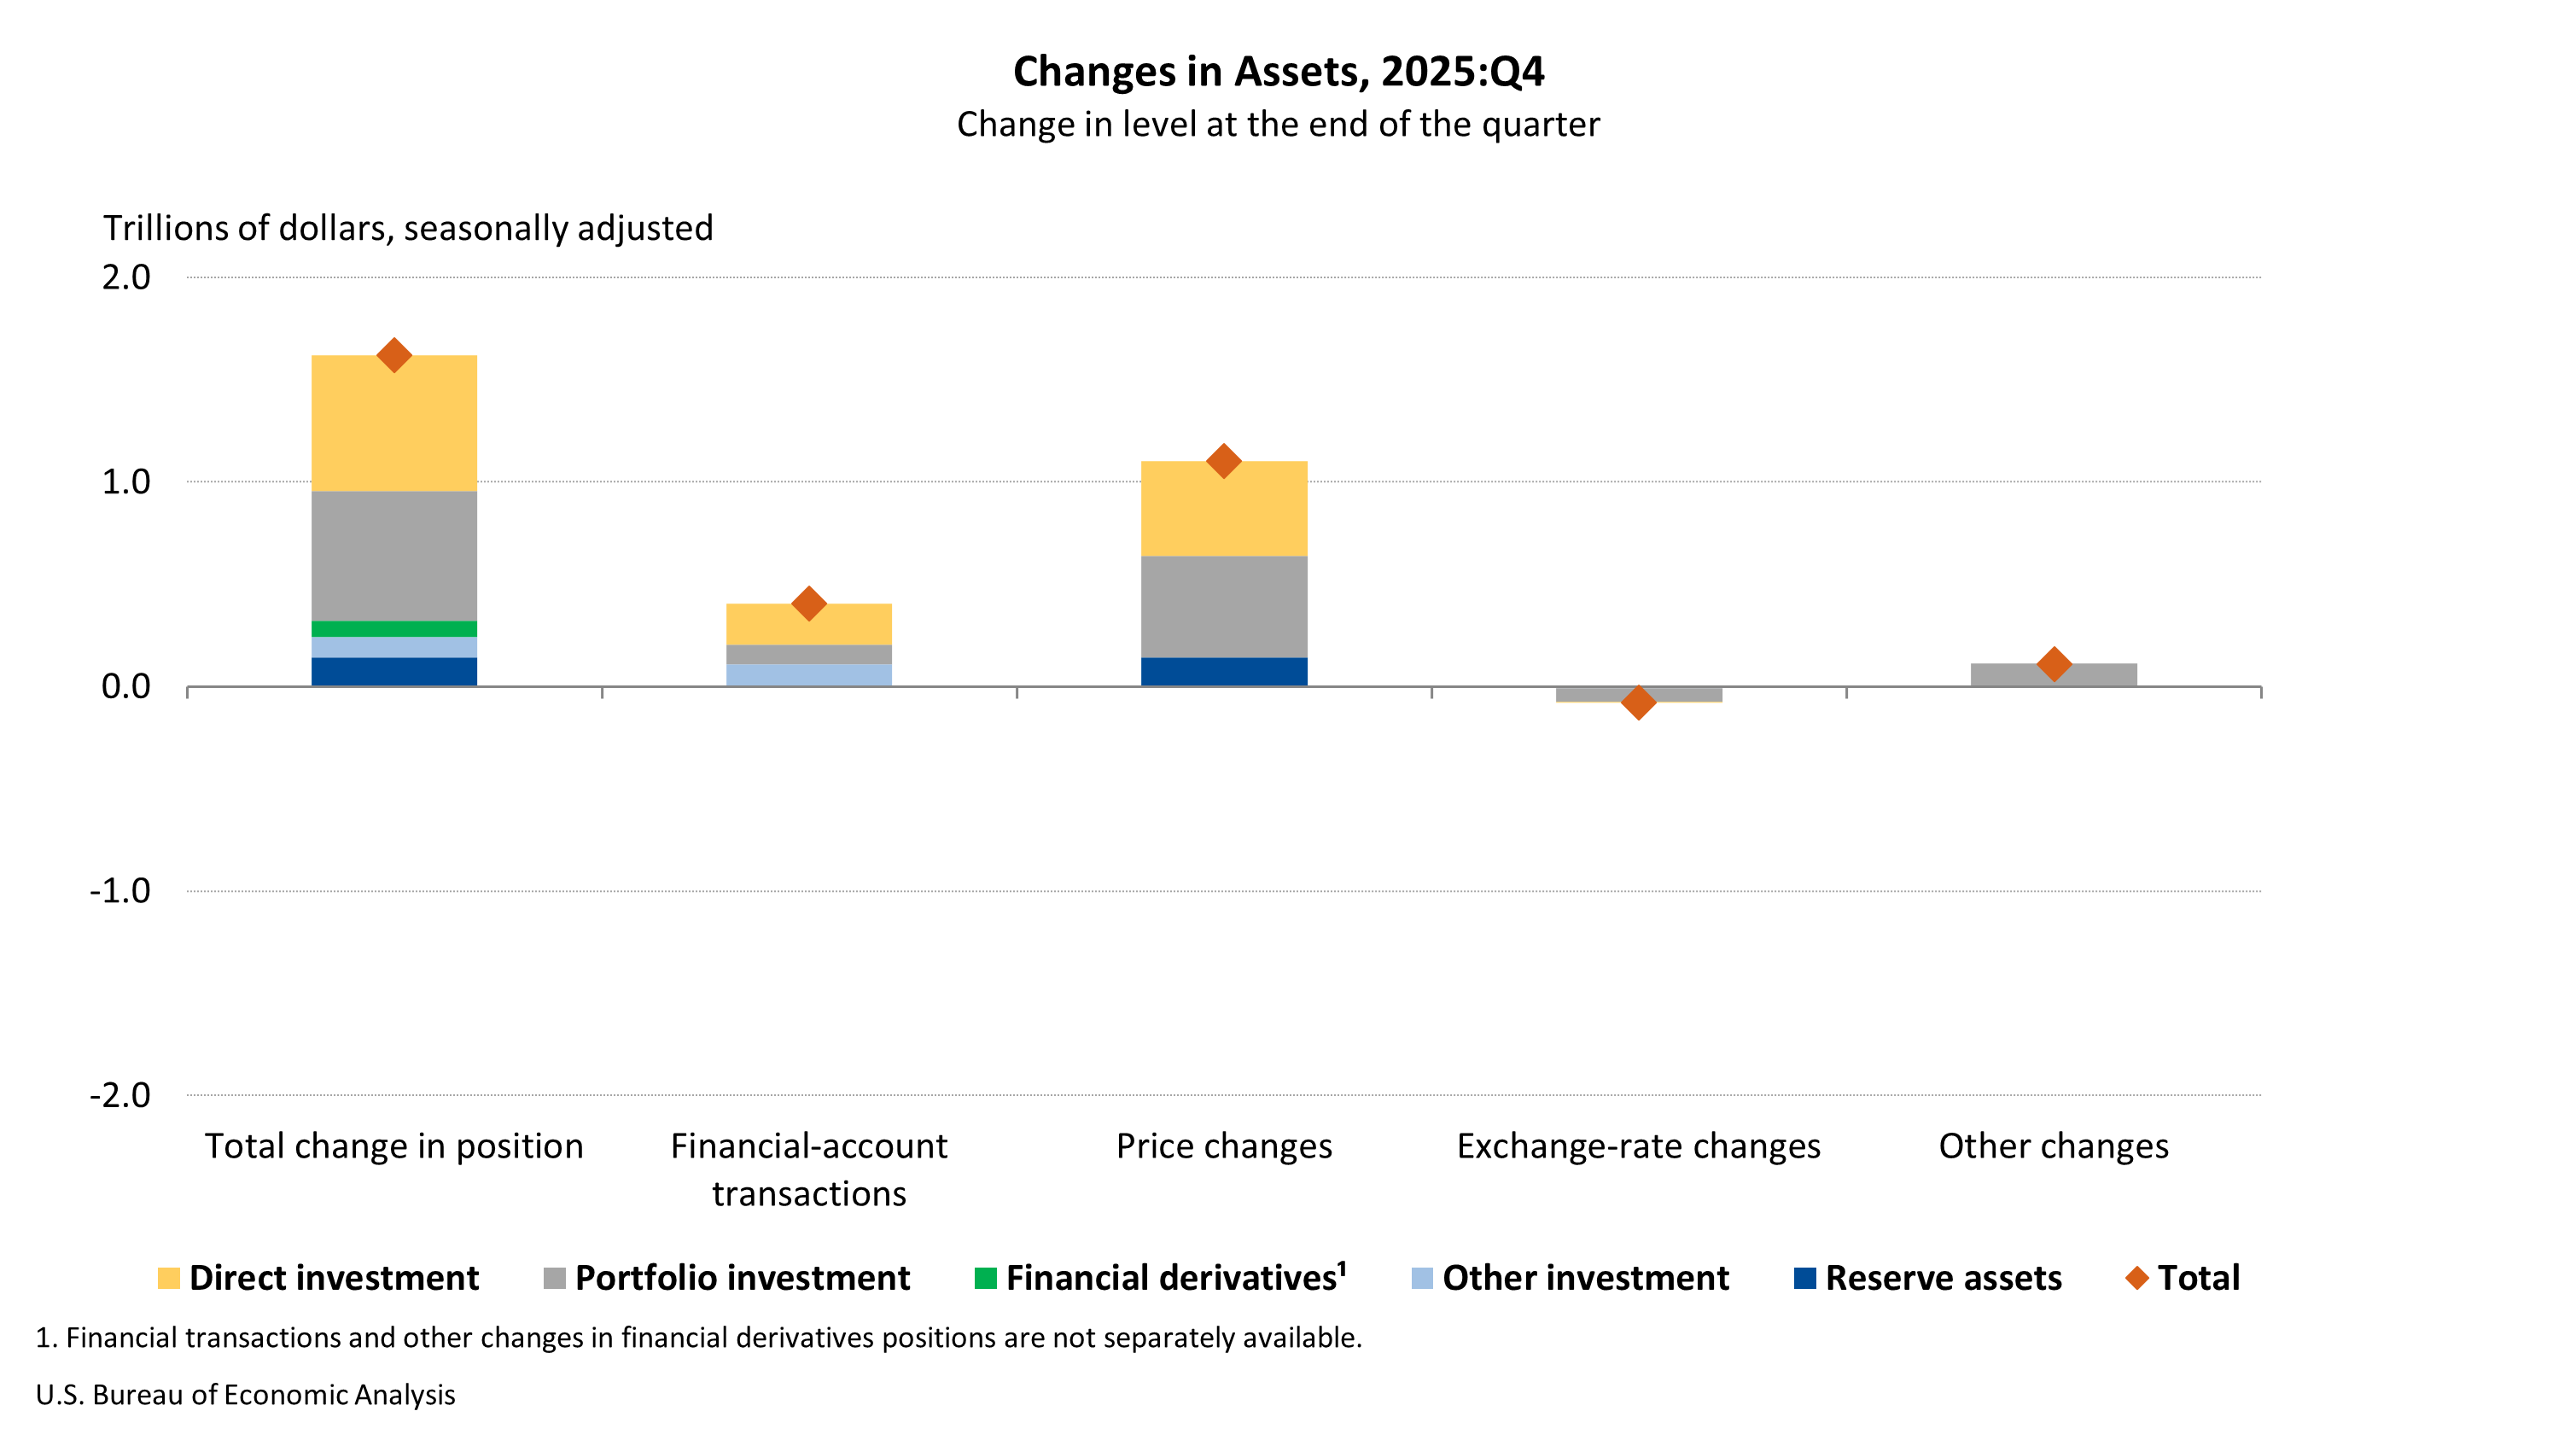
The changes in the investment position during the fourth quarter were significant. U.S. assets abroad increased by $1.62 trillion. This growth was broadly distributed across major investment categories, with notable expansions in direct investment and portfolio investment. The increase in asset values was driven by both price changes, which contributed $1.10 trillion, and financial transactions, accounting for $405.0 billion.
Similarly, U.S. liabilities to foreign residents increased by $1.61 trillion. This rise was also seen across most investment categories, with portfolio investment showing a particularly strong increase. Price changes accounted for $631.6 billion of this increase, while financial transactions contributed $532.0 billion. The near-parallel growth in assets and liabilities, driven by valuation changes and ongoing investment flows, resulted in only a marginal shift in the overall net international investment position.
Revisions to Third-Quarter Data
The BEA’s release also provided revised estimates for the third quarter of 2025, offering a clearer picture of prior economic performance. The current-account deficit for the third quarter was revised upward from preliminary estimates of -$226.4 billion to -$239.1 billion. This revision was influenced by adjustments to the goods balance, services balance, primary income balance, and secondary income balance. Notably, the primary income balance was revised to a deficit of -$2.5 billion, a shift from the preliminary estimate of a surplus of $5.2 billion.
In terms of financial-account transactions, the net figure for the third quarter was revised from -$409.9 billion to -$376.4 billion. This revision reflects adjustments in the underlying data for U.S. assets and liabilities. The net international investment position at the end of the third quarter was revised slightly to -$27.55 trillion from a preliminary estimate of -$27.61 trillion. These revisions highlight the dynamic nature of economic data and the importance of ongoing statistical updates.
Full-Year 2025 Performance
Looking at the entirety of 2025, the U.S. current-account deficit narrowed by $69.3 billion, or 5.8 percent, to $1.12 trillion. This annual improvement indicates a trend towards greater external balance over the course of the year. The deficit as a percentage of current-dollar GDP also decreased, falling from 4.0 percent in 2024 to 3.6 percent in 2025.
Throughout 2025, exports of goods and services, along with income received from foreign residents, saw a substantial increase of $276.2 billion, reaching $5.15 trillion. Imports of goods and services, along with income paid to foreign residents, also rose, but at a slower pace, increasing by $206.9 billion to $6.26 trillion. This differential growth in exports and imports contributed to the overall reduction in the current-account deficit for the year.
Capital-transfer receipts decreased by $3.6 billion to $9.2 billion for the full year, while capital-transfer payments decreased by $1.0 billion to $8.2 billion.
Net financial-account transactions for the year 2025 were -$1.21 trillion, indicating continued net borrowing from foreign residents. Over the year, U.S. residents’ foreign financial assets increased by $1.7 trillion, and liabilities to foreign residents rose by a larger $2.90 trillion.
The U.S. net international investment position at the end of 2025 stood at -$27.54 trillion, a widening of the net liability from -$26.54 trillion at the end of 2024. This deterioration over the year was driven by substantial increases in both U.S. assets and liabilities. U.S. assets abroad grew by $7.24 trillion to $42.96 trillion, while liabilities to foreign residents surged by $8.24 trillion to $70.49 trillion. The larger increase in liabilities compared to assets contributed to the widening of the net investment position deficit.
Methodological Updates and Future Releases
The BEA also announced an update to "Table 1.3. Change in the U.S. Net International Investment Position" to incorporate seasonally adjusted financial transactions. This enhancement provides a more nuanced view of financial flows by accounting for predictable seasonal variations. The BEA noted that the primary differences between seasonally adjusted and unadjusted data are found in specific categories of direct investment and changes in volume and valuation. Further details on these methodological updates can be found in the BEA’s "U.S. International Economic Accounts: Concepts and Methods."
Looking ahead, the BEA will release its annual updates to the U.S. International Transactions Accounts (ITAs) and International Investment Position (IIP) Accounts, alongside preliminary estimates for the first quarter of 2026, on June 24, 2026. A preview of these annual updates is scheduled for publication in the "Survey of Current Business" in April 2026.
The BEA provides extensive interactive data tables for these statistics, allowing users to access detailed historical time series and explore specific components of the U.S. international economic accounts. These resources are crucial for researchers, policymakers, and the public seeking a deeper understanding of the nation’s economic engagement with the global economy. The data featured in the current release will be superseded by subsequent updates, with archived data accessible through the BEA’s Data Archive.
The next release, scheduled for June 24, 2026, at 8:30 a.m. EDT, will cover the first quarter of 2026 and the comprehensive annual update. This upcoming release will provide the most current figures and incorporate the latest statistical revisions, offering an updated perspective on the U.S. economic relationship with the rest of the world.