

 Lana Rhoades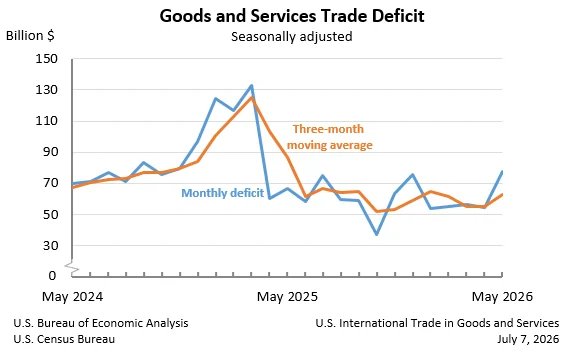
The United States experienced a significant widening of its trade deficit in May, with the goods and services shortfall reaching $77.6 billion, a substantial increase of $23.0 billion from the revised $54.6 billion recorded in April. This dramatic shift underscores a growing imbalance in international commerce, primarily attributed to a surge in imports of goods that outpaced a decline in exports. The U.S. Census Bureau and the U.S. Bureau of Economic Analysis jointly released these figures, highlighting a key economic indicator that influences domestic production, employment, and consumer prices.
May Trade Deficit Surges Amidst Shifting Trade Flows
The stark month-over-month deterioration in the U.S. trade balance was a primary concern for economists and policymakers. The $77.6 billion deficit in May represents a considerable escalation, reflecting both an increase in the value of goods imported into the United States and a decrease in the value of goods and services exported. This widening gap is particularly noteworthy given that the deficit had shown signs of moderation in prior periods, making the May figures a significant departure from recent trends.
Breaking down the components of the deficit, the report detailed that the goods deficit alone expanded by $23.6 billion to reach $106.5 billion. This significant increase in the goods deficit was partially offset by a modest increase in the services surplus, which grew by $0.6 billion to $28.9 billion. However, the growth in the services surplus was insufficient to counterbalance the sharp rise in the goods deficit.
The data also revealed that total exports in May amounted to $317.7 billion, marking a decrease of $10.5 billion compared to April. Conversely, imports saw a significant uptick, reaching $395.3 billion, an increase of $12.5 billion from the previous month. This divergence in export and import values directly contributed to the ballooning trade deficit.
Analysis of Key Trade Components
The report provided a granular view of the trade landscape, with several key metrics shedding light on the drivers of the May deficit.
Exports Decline, Imports Accelerate
- Total Exports: May exports stood at $317.7 billion, down $10.5 billion from April. This decline was primarily driven by a decrease in goods exports, which fell by $11.3 billion to $210.6 billion. Exports of services, however, showed resilience, increasing by $0.8 billion to $107.1 billion.
- Total Imports: In contrast, imports climbed to $395.3 billion, an increase of $12.5 billion over April. The surge in imports was concentrated in goods, which rose by $12.3 billion to $317.0 billion. Imports of services also saw a modest increase of $0.2 billion, reaching $78.2 billion.
The juxtaposition of declining exports and rising imports is a classic recipe for an expanding trade deficit. This dynamic can have several implications for the U.S. economy, including potential pressure on domestic industries competing with imports and a drag on economic growth if the deficit is not financed by productive investment.
Real Goods Deficit Shows Persistent Growth
When adjusted for inflation, the real goods deficit – a measure that reflects the volume of goods traded rather than just their price – also exhibited a significant increase. The real goods deficit, calculated in 2017 dollars on a Census basis, climbed by $15.8 billion, or 18.7 percent, to $100.0 billion in May. This increase in the real deficit, which was larger than the nominal deficit increase, suggests that the volume of imported goods grew more substantially than the volume of exported goods, even after accounting for price changes.
Year-to-Date Trends Offer a Contrasting Perspective
While the May figures painted a concerning picture of a widening trade gap, a look at the year-to-date data presented a more nuanced and somewhat optimistic outlook. For the period from January through May, the cumulative goods and services deficit actually decreased by $203.9 billion, or 40.6 percent, compared to the same period in the previous year. This indicates that earlier months in the year had seen a stronger trade performance.
During this year-to-date period, exports had increased by $164.7 billion, or 11.7 percent, demonstrating robust growth in the country’s sales abroad. Concurrently, imports had decreased by $39.2 billion, or 2.1 percent, suggesting a moderation in foreign goods and services entering the U.S. market. This year-to-date trend suggests that the May figures might represent a temporary setback rather than a sustained shift in the trade balance.
Three-Month Moving Averages Suggest Moderation
The report also provided insights into trade trends using three-month moving averages, which help to smooth out monthly volatility. The average goods and services deficit for the three months ending in May increased by $7.5 billion to $62.9 billion. This indicates that, on average over the recent past, the deficit has been widening, albeit at a slower pace than the single-month figure for May.
However, when looking at the year-over-year trend for these three-month averages, the picture improved. The average goods and services deficit for the three months ending in May decreased by $23.8 billion from the corresponding period in 2025. This suggests that, on a comparative basis, the U.S. trade balance has seen improvement over the past year, even with the recent monthly uptick.
Trade Balance by Country and Region
The report detailed specific trade balances with various countries and regions, offering insights into the geographical distribution of the U.S. trade deficit.
-
Surpluses Recorded: The U.S. maintained trade surpluses with several key partners, including the Netherlands ($9.1 billion), Hong Kong ($5.6 billion), South and Central America ($4.8 billion), Australia ($1.9 billion), the United Kingdom ($1.4 billion), Brazil ($1.1 billion), Singapore ($0.9 billion), Belgium ($0.7 billion), and Saudi Arabia ($0.3 billion). These surpluses indicate that the value of U.S. exports to these regions exceeded the value of imports from them.
-
Deficits Recorded: Significant trade deficits were recorded with a number of countries, highlighting areas of substantial trade imbalance. These included Vietnam ($20.6 billion), Mexico ($20.1 billion), Taiwan ($19.4 billion), China ($14.5 billion), the European Union ($9.3 billion), Canada ($7.0 billion), Germany ($5.7 billion), Malaysia ($4.7 billion), South Korea ($4.4 billion), India ($4.1 billion), Ireland ($4.0 billion), Italy ($2.9 billion), Switzerland ($2.3 billion), Japan ($2.0 billion), France ($1.5 billion), and Israel ($0.4 billion). The deficits with countries like Vietnam, Mexico, and Taiwan were particularly pronounced, suggesting significant import volumes from these nations.
The concentration of deficits with certain countries and blocs can have implications for trade policy, manufacturing competitiveness, and geopolitical relationships. Addressing these imbalances often becomes a focal point for trade negotiations and domestic industrial policy.
Revisions and Data Adjustments
The report also included information on revisions to previous data, a standard practice in economic reporting to ensure accuracy. Revisions to April exports and imports were noted, though specific figures for these revisions were not detailed in the provided excerpt. Such adjustments are crucial for providing the most accurate historical context for current economic performance.
All statistics presented in the report are seasonally adjusted, meaning they have been adjusted to account for predictable seasonal patterns in trade, such as holiday shopping or agricultural cycles. This allows for a clearer comparison of month-over-month and year-over-year trends. Statistics are presented on a balance of payments basis, which is a comprehensive measure of trade flows that includes adjustments for factors not captured in simple customs data. Data on a Census basis, which reflects more direct customs reporting, was also provided for goods.
Broader Economic Context and Potential Implications
The widening trade deficit in May occurs against a backdrop of global economic uncertainty, fluctuating currency exchange rates, and ongoing shifts in global supply chains. Several factors could have contributed to the surge in imports and decline in exports:
- Consumer Demand: Strong domestic consumer demand, fueled by factors such as government stimulus or a robust labor market, can lead to increased demand for imported goods.
- Exchange Rates: Fluctuations in the U.S. dollar’s value can make imports cheaper and exports more expensive, influencing trade flows. A stronger dollar, for instance, typically exacerbates trade deficits.
- Global Economic Conditions: The economic health of trading partners plays a crucial role. If demand for U.S. exports weakens in key markets, exports will likely decline.
- Supply Chain Dynamics: Disruptions or shifts in global supply chains can lead to increased import reliance for certain goods or components.
The implications of a persistent and widening trade deficit can be far-reaching. It can contribute to a buildup of U.S. debt held by foreign entities, potentially impact the value of the U.S. dollar over the long term, and create competitive challenges for domestic industries. Conversely, a strong inflow of imports can contribute to lower consumer prices and provide a wider variety of goods. However, a sustained deficit that is not matched by productive domestic investment can be a drag on long-term economic growth and employment.
Economists will be closely monitoring future trade reports to determine if the May figures represent a temporary anomaly or the beginning of a new trend. The interplay between global economic recovery, U.S. domestic economic policies, and international trade relations will be key factors shaping the U.S. trade balance in the months ahead.
The next release of the U.S. International Trade in Goods and Services report is scheduled for August 4, 2026, which will provide data for June 2026, offering further insights into the trajectory of U.S. international trade.








