Lana Rhoades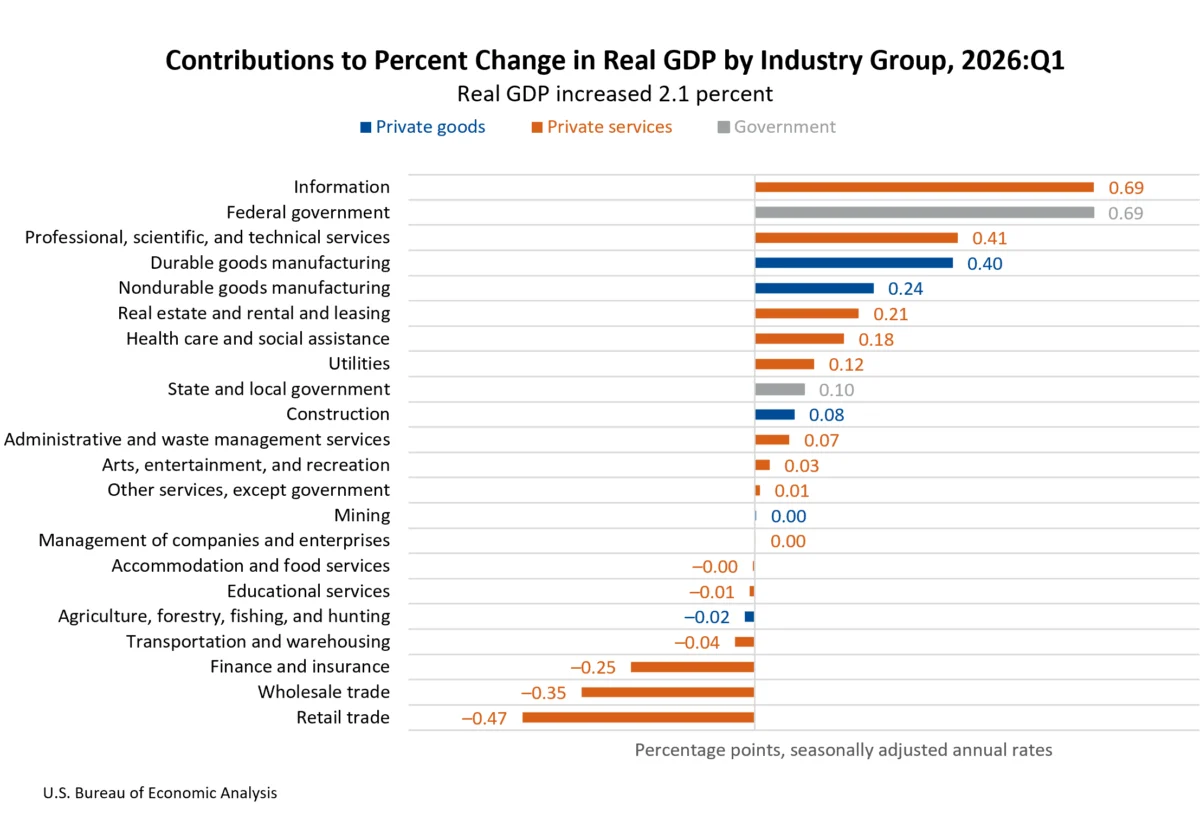
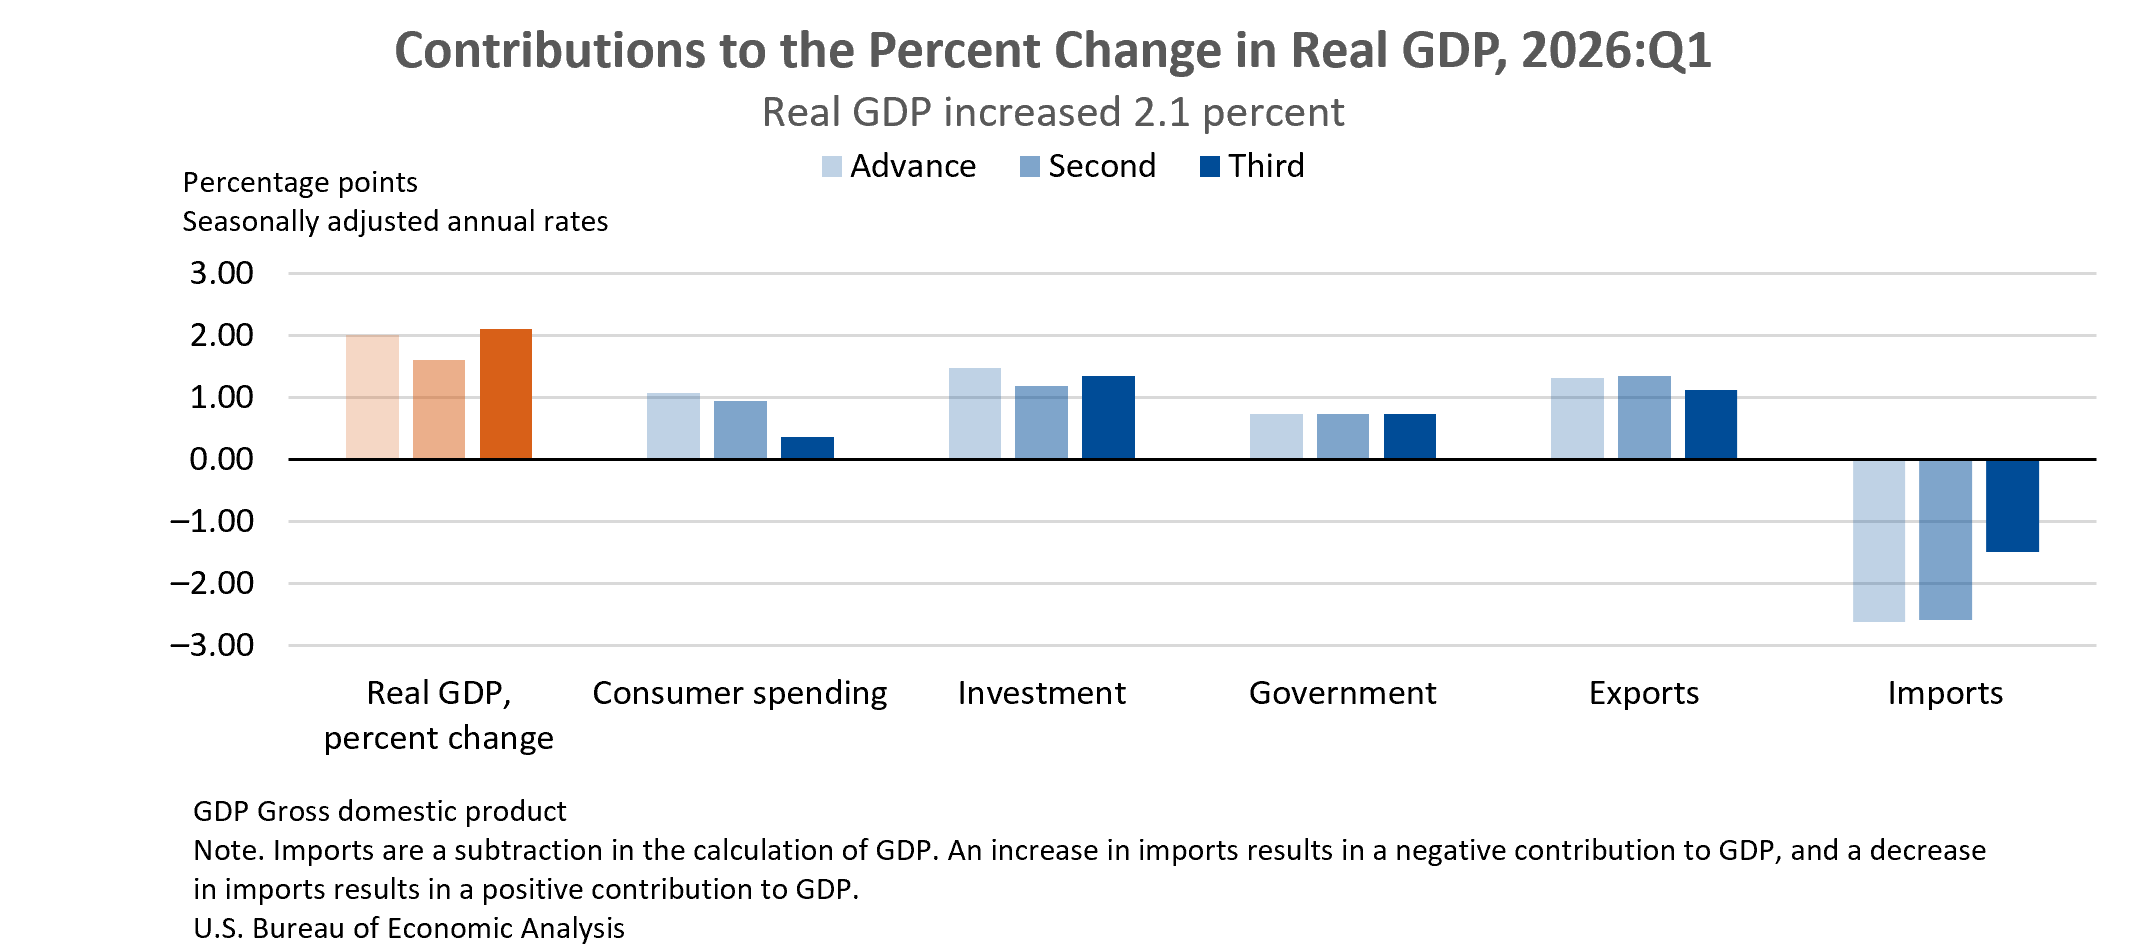
The U.S. economy demonstrated a notable acceleration in the first quarter of 2026, with real gross domestic product (GDP) increasing at an annual rate of 2.1 percent. This figure, representing the third estimate from the U.S. Bureau of Economic Analysis (BEA), marks a significant uptick from the 0.5 percent growth recorded in the final quarter of 2025. The upward revision of 0.5 percentage point from the BEA’s second estimate highlights a complex interplay of economic factors, primarily driven by a downward revision in imports, which are a subtraction in GDP calculations, partially counterbalanced by a decrease in consumer spending.
The expansion in the first quarter was propelled by several key components of the economy. Investment, exports, government spending, and consumer spending all contributed to the overall growth. While imports, which act as a drag on GDP, also increased, their impact was mitigated by the positive contributions from other sectors. This broad-based growth pattern suggests a healthy and dynamic economic environment at the outset of 2026.
GDP by Industry: A Sectoral Analysis
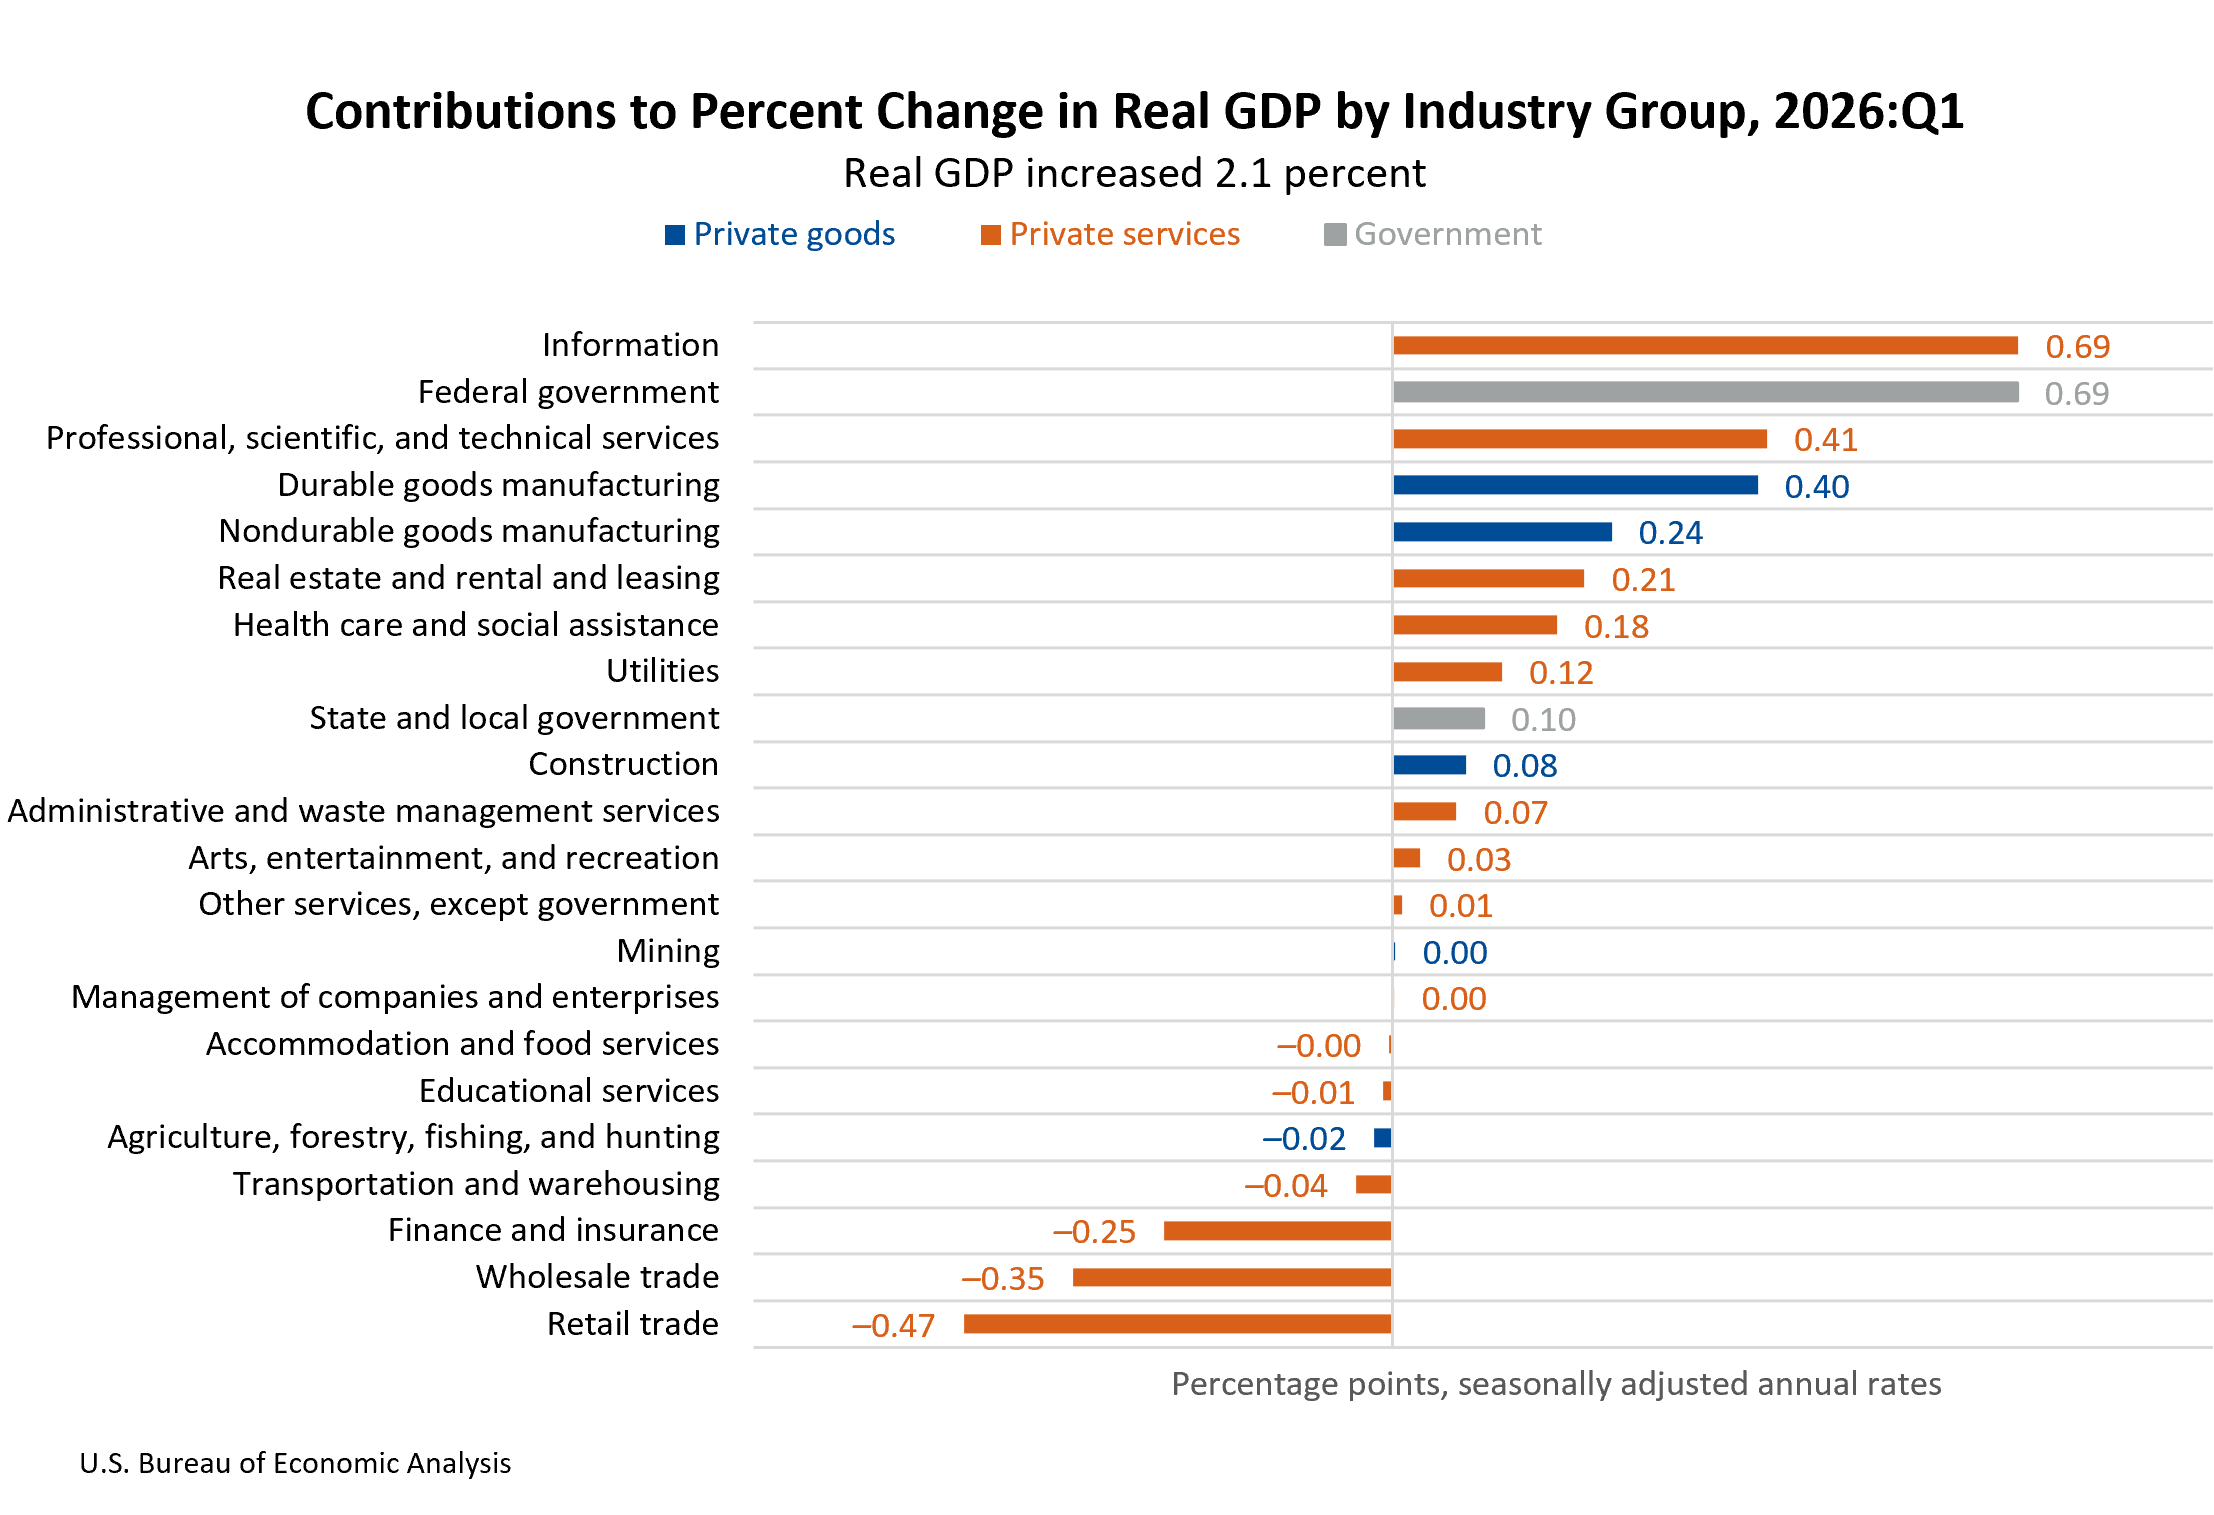
Examining the economic landscape from an industry perspective reveals a varied performance across different sectors. The overall increase in real GDP was underpinned by robust growth in the real value added of several key industries. Government sectors saw a substantial increase of 7.5 percent, indicating significant public sector activity. Private goods-producing industries experienced a healthy expansion of 4.5 percent, pointing to a strong performance in manufacturing and related sectors. Private services-producing industries also contributed positively, growing at a rate of 0.8 percent.
The leading industries that significantly bolstered the increase in real GDP during the first quarter included information technology, federal government services, professional, scientific, and technical services, and durable goods manufacturing. These sectors are often at the forefront of innovation and economic development, their strong performance signaling positive trends in their respective markets. Conversely, the retail trade, wholesale trade, and finance and insurance sectors acted as notable offsets, experiencing decreases that tempered the overall growth. These declines may suggest shifts in consumer purchasing habits, inventory management challenges, or adjustments within the financial services landscape.
Related Economic Measures and Their Implications
Beyond the headline GDP figures, several related economic indicators provide a more nuanced understanding of the economy’s health. Real final sales to private domestic purchasers, a measure that aggregates consumer spending and gross private fixed investment, increased by 1.7 percent in the first quarter. This figure was revised down by 0.7 percentage point from the previous estimate, suggesting that the underlying strength in domestic private demand may have been slightly less robust than initially anticipated.
Real gross output, a measure of the total value of goods and services produced by the economy, also saw a positive trajectory, increasing by 1.7 percent in the first quarter. This growth was largely driven by the government sector (4.9 percent) and private services-producing industries (1.7 percent), while private goods-producing industries saw a more modest increase of less than 0.1 percent.
The reconciliation of economic activity from both the production (GDP) and income (GDI) perspectives offers further insights. Real gross domestic income (GDI) increased by 1.2 percent in the first quarter, an upward revision of 0.3 percentage point from the prior estimate. The average of real GDP and real GDI, a metric often considered a more comprehensive measure of economic performance, increased by 1.7 percent, revised up by 0.4 percentage point. This convergence of GDP and GDI suggests a more balanced and stable economic picture.
Corporate profits, a key indicator of business health, also showed positive momentum. Profits from current production, which include adjustments for inventory valuation and capital consumption, increased by $74.4 billion in the first quarter, a substantial upward revision of $34.0 billion from the previous estimate. This surge in corporate profitability indicates a favorable environment for businesses, potentially leading to increased investment and hiring.
Inflationary pressures, as measured by the price index for gross domestic purchases, rose by 3.6 percent in the first quarter, a slight upward revision of 0.1 percentage point. The personal consumption expenditures (PCE) price index, a closely watched inflation gauge, increased by 4.6 percent, also revised up by 0.1 percentage point. The core PCE price index, which excludes volatile food and energy components, increased by 4.4 percent, remaining consistent with previous estimates. These figures suggest that while economic growth is robust, inflation remains a persistent concern, likely influencing monetary policy decisions.
Regional Economic Performance: A State-by-State Snapshot
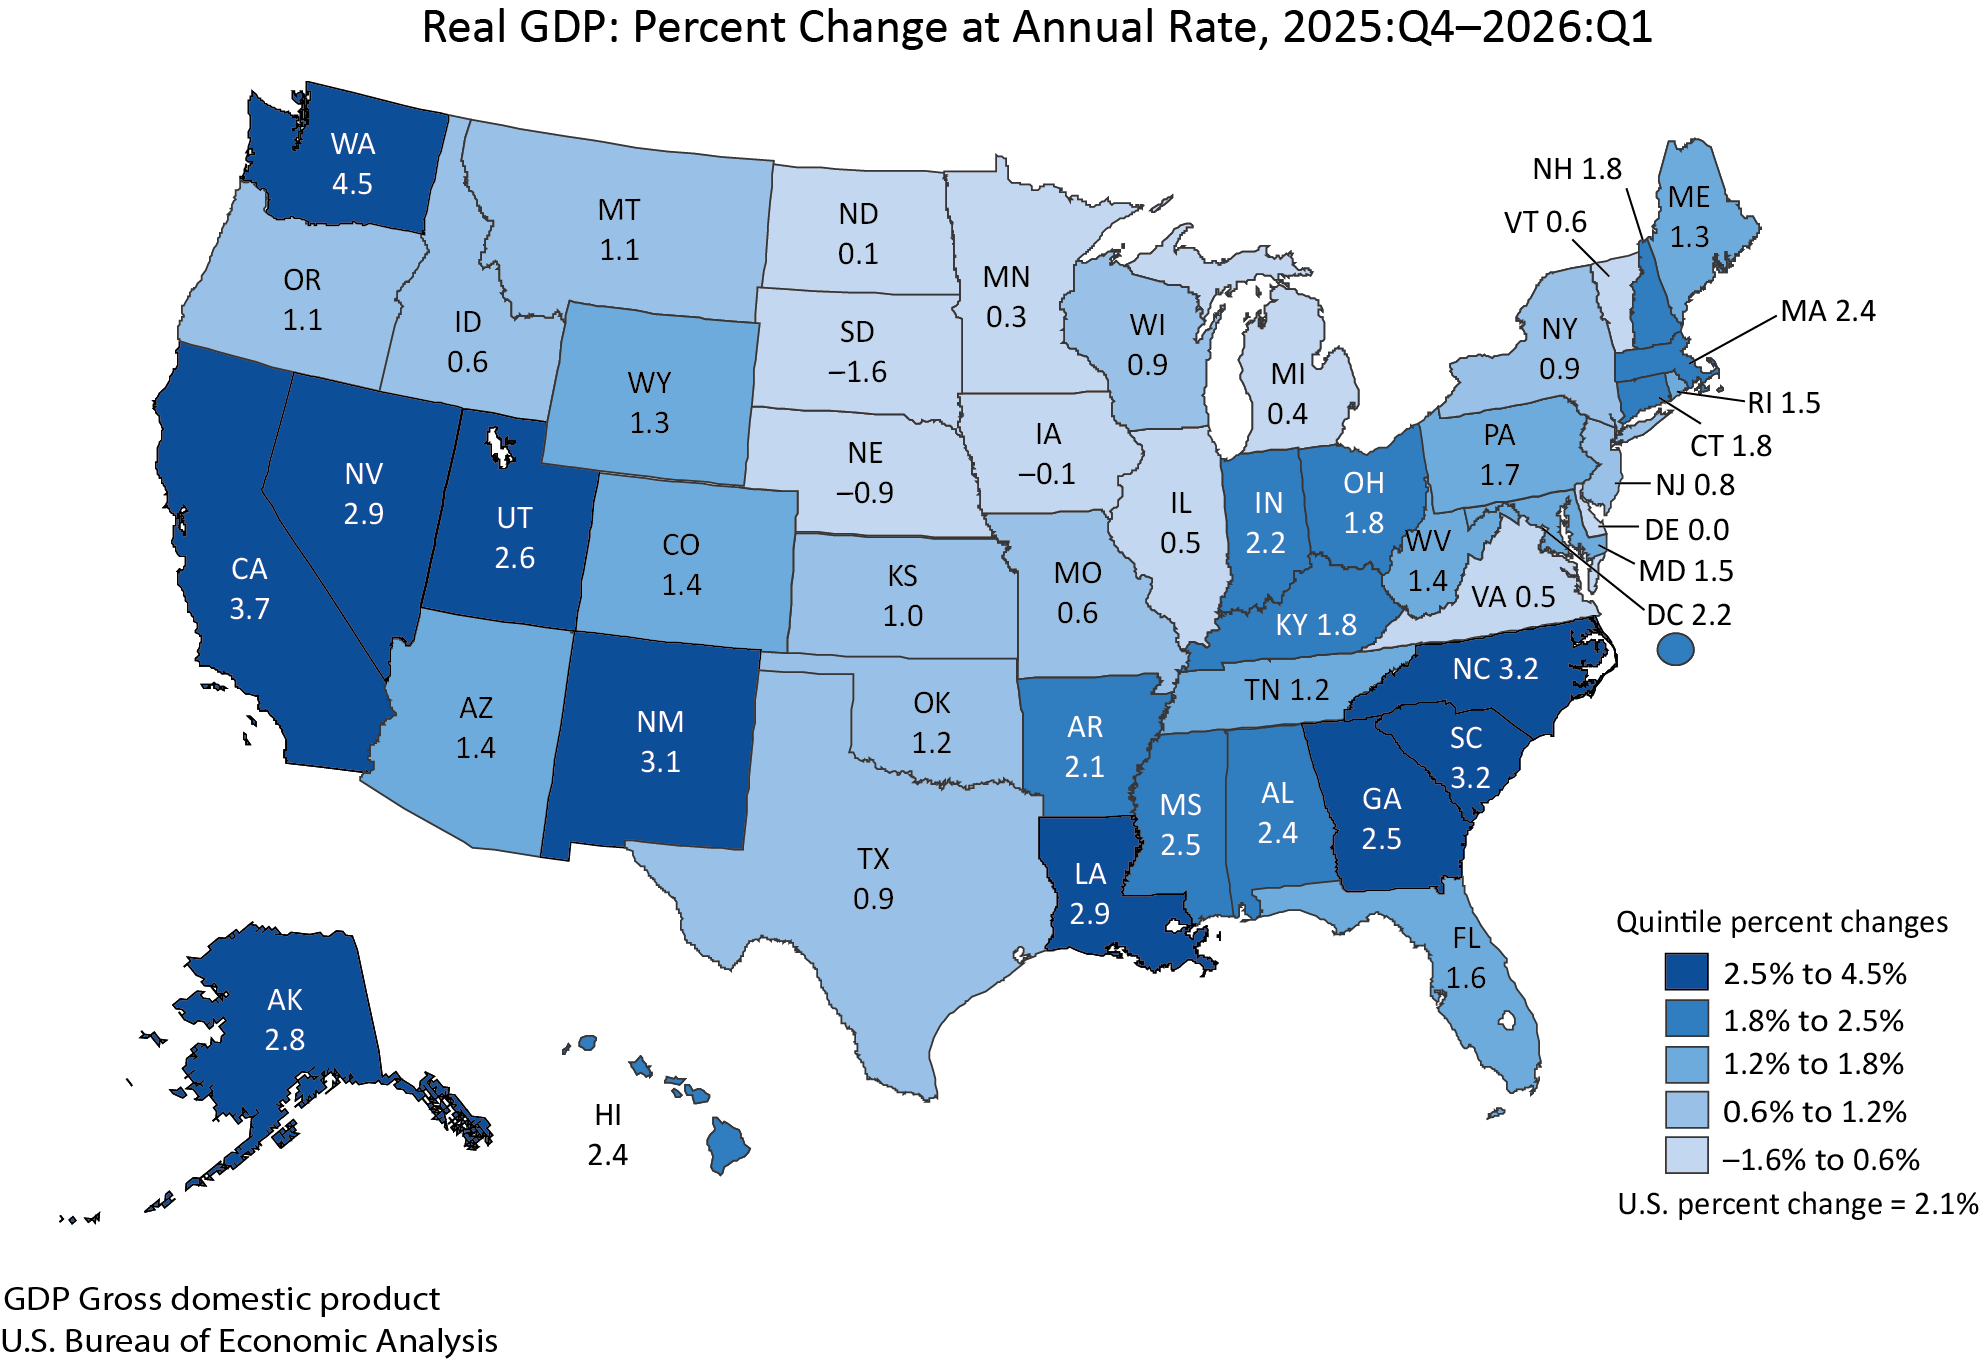
The economic expansion in the first quarter of 2026 was not uniformly distributed across the nation, with significant variations observed at the state level. Real GDP increased in 46 states and the District of Columbia, highlighting a widespread positive trend. The pace of growth varied considerably, with Washington state leading the nation with an impressive annual growth rate of 4.5 percent. This strong performance in Washington is attributed to the information technology sector, which served as the primary driver of its economic expansion.
Conversely, South Dakota experienced a contraction in real GDP, with a decrease of 1.6 percent. The decline in South Dakota was primarily linked to the agriculture, forestry, fishing, and hunting sector. Delaware reported no change in its real GDP. These regional disparities underscore the diverse economic conditions that can exist within a single national economy, influenced by industry concentrations, local policies, and global market dynamics.
Personal Income Trends Across States
In parallel with the GDP figures, current-dollar personal income saw a substantial increase of $222.6 billion, or 3.4 percent at an annual rate, in the first quarter of 2026. Personal income growth was broadly experienced, with 49 states and the District of Columbia reporting increases. North Dakota stood out with the highest growth rate in current-dollar personal income, reaching 22.4 percent. This surge in North Dakota’s income is likely tied to its strong performance in the energy sector, a significant contributor to its economy.
In stark contrast, Hawaii experienced a significant decrease of 23.9 percent in its personal income. This sharp decline in Hawaii is attributed to a settlement paid to households in the fourth quarter of 2025, related to the 2023 Maui wildfire. This event highlights how localized disasters and subsequent financial settlements can have a substantial impact on regional economic data.
Earnings, a key component of personal income comprising compensation and proprietors’ income, increased in 46 states, with North Dakota again showing a remarkable increase of 34.7 percent. The District of Columbia, however, saw a decrease in earnings of 1.5 percent. Personal current transfer receipts, which include payments like social security and unemployment benefits, increased in 45 states and the District of Columbia. Minnesota recorded the highest growth in transfer receipts at 15.5 percent.
Property income, encompassing dividends, interest, and rent, demonstrated broad-based growth, increasing in 50 states and the District of Columbia. Idaho reported the highest growth rate at 5.5 percent, while Alaska saw a more modest increase of 3.2 percent. These varied trends in personal income components reflect the diverse economic activities and income sources present across different states.
Annual Update and Future Outlook
The U.S. Bureau of Economic Analysis also announced significant improvements in the concurrent production of its statistics, leading to a synchronized annual update of national, industry, and regional data on September 30, 2026. This coordinated update will encompass gross domestic product (GDP), gross domestic income, GDP by industry, monthly personal income and outlays, and related statistics within the National Income and Product Accounts (NIPAs) and the Industry Economic Accounts. Regional economic accounts, including GDP by state and county, and personal income by state and county, will also be updated. These enhancements are designed to improve the accuracy and timeliness of economic reporting.
Looking ahead, the BEA will release its advance estimate for second-quarter 2026 GDP on July 30, 2026, at 8:30 a.m. Eastern Daylight Time. This upcoming release will provide further insights into the continuation of economic trends and any potential shifts in momentum.
Technical Notes and Data Revisions
The upward revision to the first-quarter 2026 real GDP growth from 1.6 percent to 2.1 percent was primarily attributed to a downward revision in imports, which reduced the subtraction from GDP. This was partially offset by a downward revision to consumer spending, indicating a nuanced adjustment in the calculation of economic activity. The BEA also noted adjustments to the PCE price index for legal services in January and March, with no adjustment made for February. These adjustments are made when source data requires specific modifications to ensure accuracy.
Furthermore, the BEA clarified the treatment of International Emergency Economic Powers Act (IEEPA) tariff refunds. In February 2026, a Supreme Court decision mandated the refund of certain unlawful tariffs. The BEA has classified these refunds as a capital transfer, meaning they do not impact first-quarter GDP calculations. This distinction is important for understanding the composition of economic flows.
The BEA also released revised quarterly estimates of personal income by state for the first through fourth quarters of 2025. These updates incorporate more comprehensive and detailed source data, aligning state-level estimates with the latest national accounts.
The U.S. economy’s performance in the first quarter of 2026, characterized by a significant acceleration in real GDP growth, paints a picture of robust economic activity. While sectors like information technology and government services showed strong gains, the mixed performance of retail and finance, alongside persistent inflationary pressures, warrants continued attention. The regional disparities and varied personal income trends underscore the complexity of the national economic landscape, highlighting the importance of comprehensive and detailed data analysis to understand the full scope of economic developments. The BEA’s commitment to improving data collection and reporting promises to provide even greater clarity on these evolving economic dynamics in the future.