Lana Rhoades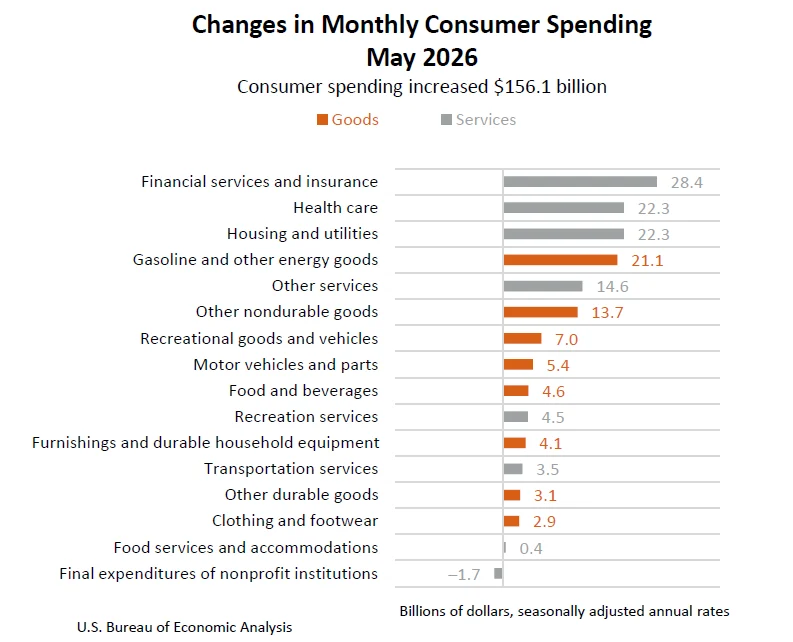
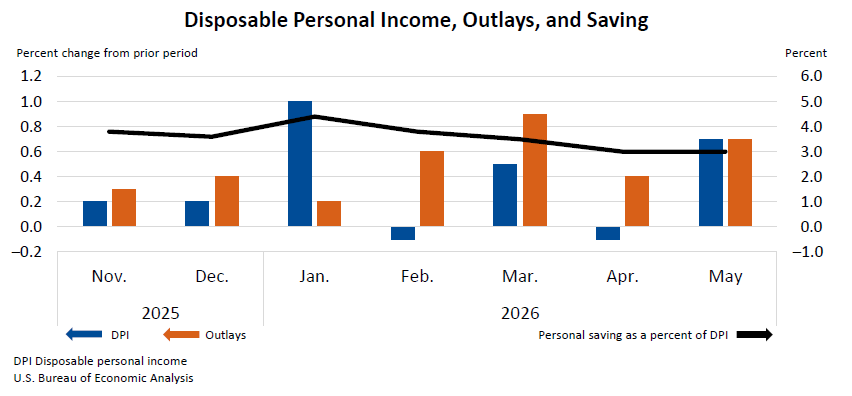
Washington D.C. – June 28, 2024 – The United States economy demonstrated a notable surge in personal income during May, with an increase of $181.6 billion, marking a 0.7 percent rise at a monthly rate. This robust expansion, as reported by the U.S. Bureau of Economic Analysis (BEA), signals a healthy financial landscape for American households. The growth in disposable personal income (DPI), which represents income after taxes, mirrored this trend, climbing by $164.9 billion, also a 0.7 percent increase. Concurrently, personal consumption expenditures (PCE), a key indicator of consumer spending, advanced by $156.1 billion, maintaining the 0.7 percent growth rate.
This synchronized uptick across income and spending metrics suggests a dynamic economic environment, where households are experiencing both increased earning potential and a willingness to deploy those gains into the marketplace. The BEA’s data provides a crucial snapshot of the financial health of the nation, influencing economic forecasting and policy decisions at the highest levels.
Key Drivers of Income Growth
The primary contributors to the substantial increase in current-dollar personal income for May were identified as significant gains in farm proprietors’ income and compensation. Farm proprietors’ income, often subject to fluctuations based on agricultural output and market conditions, saw a welcome upswing. This could be attributed to a variety of factors, including favorable weather patterns leading to higher yields, increased commodity prices, or government support programs. The strength in this sector, while specific, contributes to the overall national income picture.
Equally significant was the rise in compensation, which encompasses wages, salaries, and benefits. This component of personal income is a direct reflection of the labor market’s performance. An increase in compensation often indicates a tightening labor market, where employers are compelled to offer more attractive pay and benefits to attract and retain talent. This can also be a consequence of increased hours worked or a rise in the number of individuals employed. The BEA’s detailed breakdown within compensation will be crucial for understanding the specific industries or sectors that are experiencing the most pronounced wage growth.
Consumer Spending Shows Resilience
The parallel increase in disposable personal income and personal consumption expenditures highlights a consumer base that is not only earning more but also actively participating in economic activity through spending. Personal outlays, which encompass PCE, personal interest payments, and personal current transfer payments, collectively rose by $159.9 billion in May. This broad-based increase in spending underscores a consumer sentiment that is likely buoyed by the rising incomes and potentially a stable or improving economic outlook.
The breakdown of PCE reveals that spending on services saw a significant increase of $94.3 billion, while spending on goods rose by $61.8 billion. This divergence, with services leading the growth, suggests a continued shift in consumer priorities, possibly reflecting a post-pandemic normalization where experiences and services are regaining prominence. This trend could encompass a variety of categories, from healthcare and education to travel and entertainment, indicating a broad-based demand across the service sector.
Personal Saving Rate Holds Steady
Despite the robust growth in income and spending, the personal saving rate in May remained at 3.0 percent, with personal saving totaling $704.2 billion. This figure indicates that while households are earning more and spending more, they are largely allocating the additional income to consumption rather than significantly increasing their savings buffer. A saving rate of 3.0 percent is relatively modest, suggesting that a substantial portion of increased income is being channeled back into the economy through consumption, which is generally positive for economic growth in the short to medium term. However, a prolonged period of low saving rates could raise concerns about future financial resilience for households in the face of unexpected economic shocks or during retirement.
Inflationary Pressures and Real Consumption
While nominal income and spending have shown strong growth, it is essential to consider the impact of inflation. The BEA reported that the Personal Consumption Expenditures (PCE) price index increased by 0.4 percent in May. Excluding the volatile categories of food and energy, the core PCE price index also rose by 0.3 percent. On an annual basis, the PCE price index increased by 4.1 percent from the same month one year ago, with the core PCE price index up by 3.4 percent.
These figures indicate that while consumers are spending more, a portion of that increase is due to rising prices. To understand the true growth in purchasing power, economists look at real PCE, which adjusts for inflation. In May, real PCE increased by $43.8 billion, or 0.3 percent at a monthly rate. This suggests that while nominal spending saw a robust 0.7 percent increase, the actual volume of goods and services consumed grew at a more moderate pace due to inflationary pressures. The difference between nominal and real consumption growth provides a clear indication of how much of the spending increase is driven by price hikes versus genuine demand for more goods and services.
The persistence of core inflation at 0.3 percent for the month and 3.4 percent year-over-year, while showing some moderation from higher peaks, remains a key focus for policymakers, particularly the Federal Reserve, as they navigate monetary policy decisions.
Historical Context and Trends
The May data builds upon recent economic trends. Following a period of significant fiscal stimulus and subsequent economic recovery, the U.S. economy has demonstrated resilience. The BEA’s report on personal income and outlays is a critical component of the National Income and Product Accounts (NIPAs), providing a monthly pulse on consumer behavior, which is a major driver of U.S. economic activity, accounting for roughly two-thirds of GDP.
Looking back at preceding months, April saw a slight contraction in disposable personal income (-0.1 percent) and a more pronounced dip in real disposable personal income (-0.5 percent), suggesting that May’s rebound represents a positive shift. Current-dollar PCE in April had grown by 0.4 percent, and real PCE by 0.0 percent, indicating that May’s acceleration in both nominal and real spending marks a significant improvement in consumer demand.
The year-over-year inflation figures, while still elevated, show a cooling trend compared to the peak inflation rates seen in prior periods. This suggests that while price pressures remain a concern, they may be gradually abating, which could provide some relief to consumers and potentially influence future monetary policy stances.
Broader Economic Implications and Analysis
The strong performance of personal income and consumer spending in May carries significant implications for the broader U.S. economy. Robust consumer demand is a vital engine for economic growth, encouraging businesses to invest, expand, and hire. The increase in compensation, in particular, signals a potentially strengthening labor market, which can lead to further increases in consumer confidence and spending power.
However, the persistent inflation, even with signs of moderation, remains a critical factor. The BEA’s PCE price index is closely watched by the Federal Reserve as it considers its monetary policy. If inflation continues to run above the Fed’s target of 2 percent, it could prompt further interest rate hikes or a prolonged period of higher rates, which could eventually dampen economic growth by making borrowing more expensive for both consumers and businesses.
The relatively low personal saving rate could also present a double-edged sword. While it fuels current consumption and economic activity, it might leave households more vulnerable to economic downturns or unforeseen expenses. A sustained period of higher saving rates could indicate increased financial prudence and a stronger foundation for long-term economic stability, but it could also translate to slower near-term consumption growth.
Official Perspectives and Future Outlook
While the BEA releases the data, official commentary often comes from the Council of Economic Advisers, the Treasury Department, and the Federal Reserve. These entities will analyze the May data in the context of their ongoing assessment of the economy. A strong income and spending report generally aligns with a positive economic outlook, but policymakers will continue to monitor inflation, labor market conditions, and global economic developments.
The next release of Personal Income and Outlays data, scheduled for July 30, 2026, at 8:30 a.m. EDT, will provide crucial insights into June’s economic performance, offering a clearer picture of whether May’s trends represent a sustained upward trajectory or a temporary surge. Economic analysts will be keenly awaiting this report to gauge the ongoing momentum of consumer spending and income growth, as well as any further shifts in inflationary pressures.
Annual Updates and Data Revisions
It is important to note that the BEA also conducts annual updates to its national and regional economic accounts. These updates often involve incorporating more comprehensive source data and refining methodologies, which can lead to revisions of previously published figures. The BEA has announced that starting in 2026, annual updates for national, industry, and regional data will commence on the same day, September 30th. This harmonization aims to improve the coherence and comparability of these vital economic statistics. These updates ensure that the economic data remains as accurate and reflective of the nation’s economic activity as possible.
Technical Notes and Data Accessibility
The BEA’s report includes technical notes that provide further detail on data revisions and adjustments. For instance, the report mentions adjustments made to the PCE price index for legal services in January and March, highlighting the BEA’s commitment to data accuracy. Revisions to personal income estimates for January through April have also been incorporated, reflecting updated data from the Bureau of Labor Statistics (BLS) for compensation and revised payment data from the Social Security Administration and the Centers for Medicare & Medicaid Services for benefits.
For those seeking more detailed information, the BEA provides access to a wide array of related data tables through its Interactive Data Application. These tables allow users to explore historical time series for personal income, disposition, PCE, and price indexes, facilitating in-depth analysis of economic trends. The report also reminds users that with each subsequent release, the links to current data will be updated, and prior data can be accessed via the BEA’s Data Archive.
In conclusion, the May report from the U.S. Bureau of Economic Analysis paints a picture of an economy bolstered by solid gains in personal income, driven by farm income and compensation, and supported by resilient consumer spending. While inflationary pressures remain a consideration, the overall trend suggests a dynamic and growing economy, with consumers playing a central role in its continued expansion.