Lana Rhoades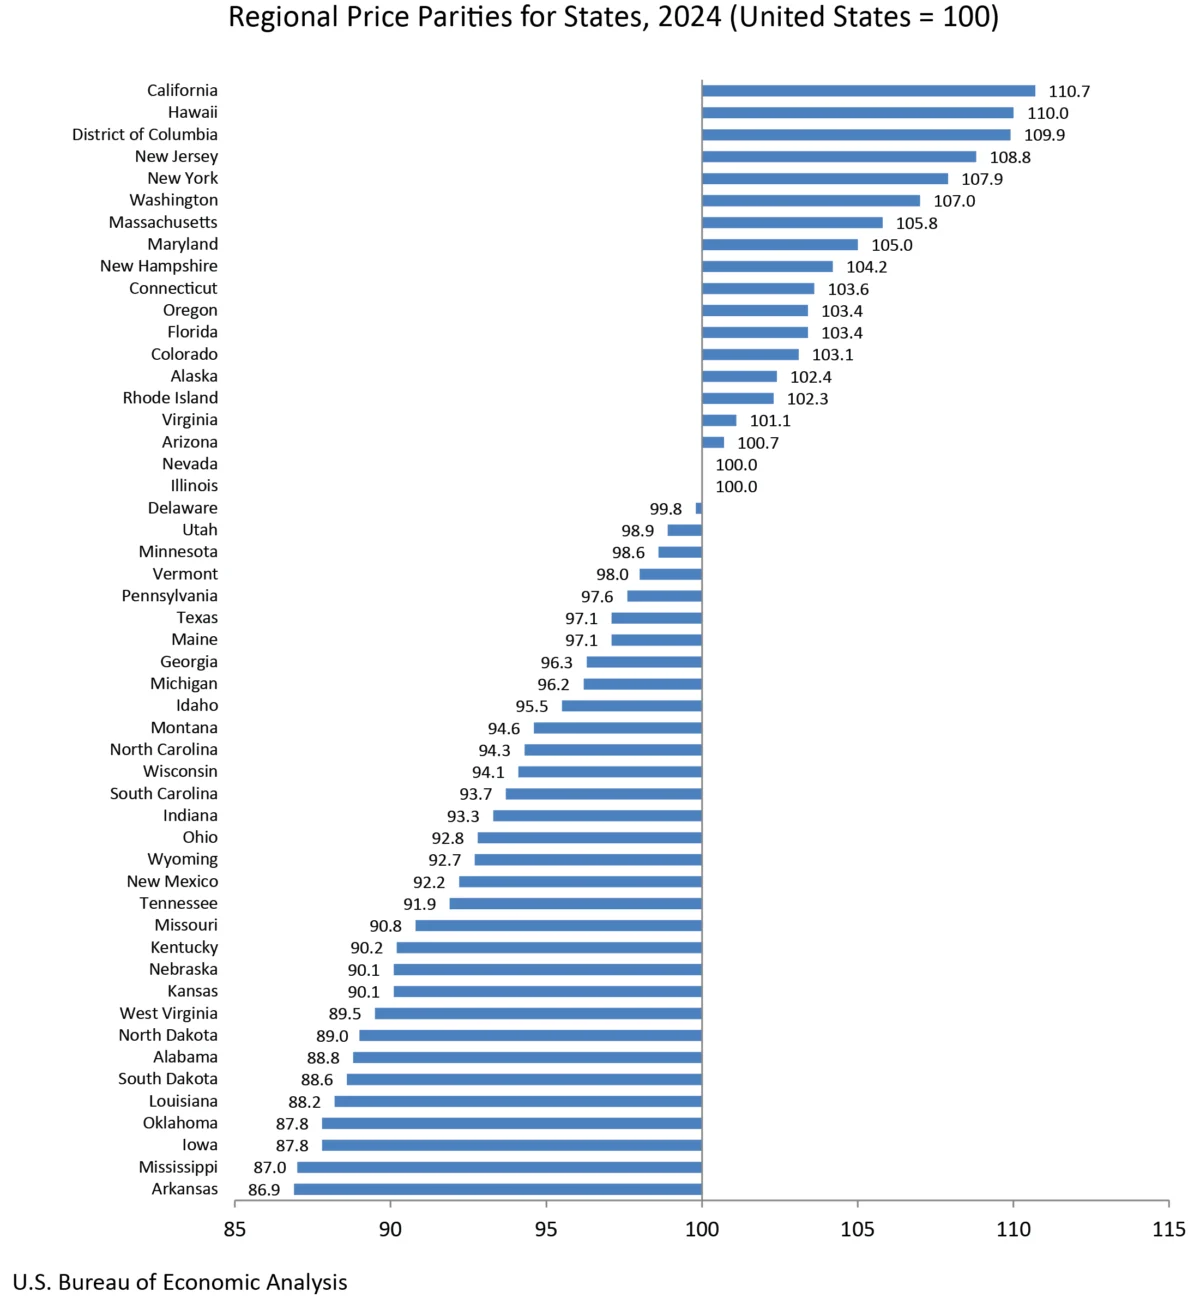
The U.S. Bureau of Economic Analysis (BEA) today unveiled its comprehensive annual statistics for 2024, offering a detailed snapshot of real personal consumption expenditures (PCE), real personal income, and regional price parities (RPPs) across all 50 states and the District of Columbia. This release provides crucial insights into the varying economic landscapes and consumer behaviors that defined the nation’s economic activity over the past year. The data reveals a broad-based expansion in consumer spending and personal income, though significant regional disparities persist, highlighting the uneven nature of economic growth.
National Economic Trends Reflected in State Data
Nationally, real personal consumption expenditures saw an increase of 2.9 percent in 2024. This figure is particularly noteworthy when compared to the 2.6 percent rise in the national PCE price index. The disparity indicates that, on average, Americans were able to purchase more goods and services than in the previous year, signifying a real increase in purchasing power. Current-dollar PCE, which accounts for inflation, grew by 5.6 percent nationally, outpacing inflation and underscoring the robust demand driving economic activity.
Similarly, real personal income across the nation experienced a growth of 2.9 percent in 2024. This aligns with the national real PCE growth, suggesting that individuals’ earnings, after adjusting for inflation, kept pace with their increased spending. Current-dollar personal income also rose by 5.6 percent nationwide, exceeding the PCE price index and mirroring the trend observed in consumer spending. This parallel growth in real income and real spending points to a healthy economic environment where increased productivity and economic output translated into tangible benefits for consumers.
The BEA’s meticulous methodology involves adjusting current-dollar estimates by regional price parities and the national PCE price index to derive real figures. This process is vital for understanding the true purchasing power of individuals and the volume of goods and services consumed, removing the distorting effects of inflation and regional price differences.
Real Personal Consumption Expenditures: A State-by-State Breakdown
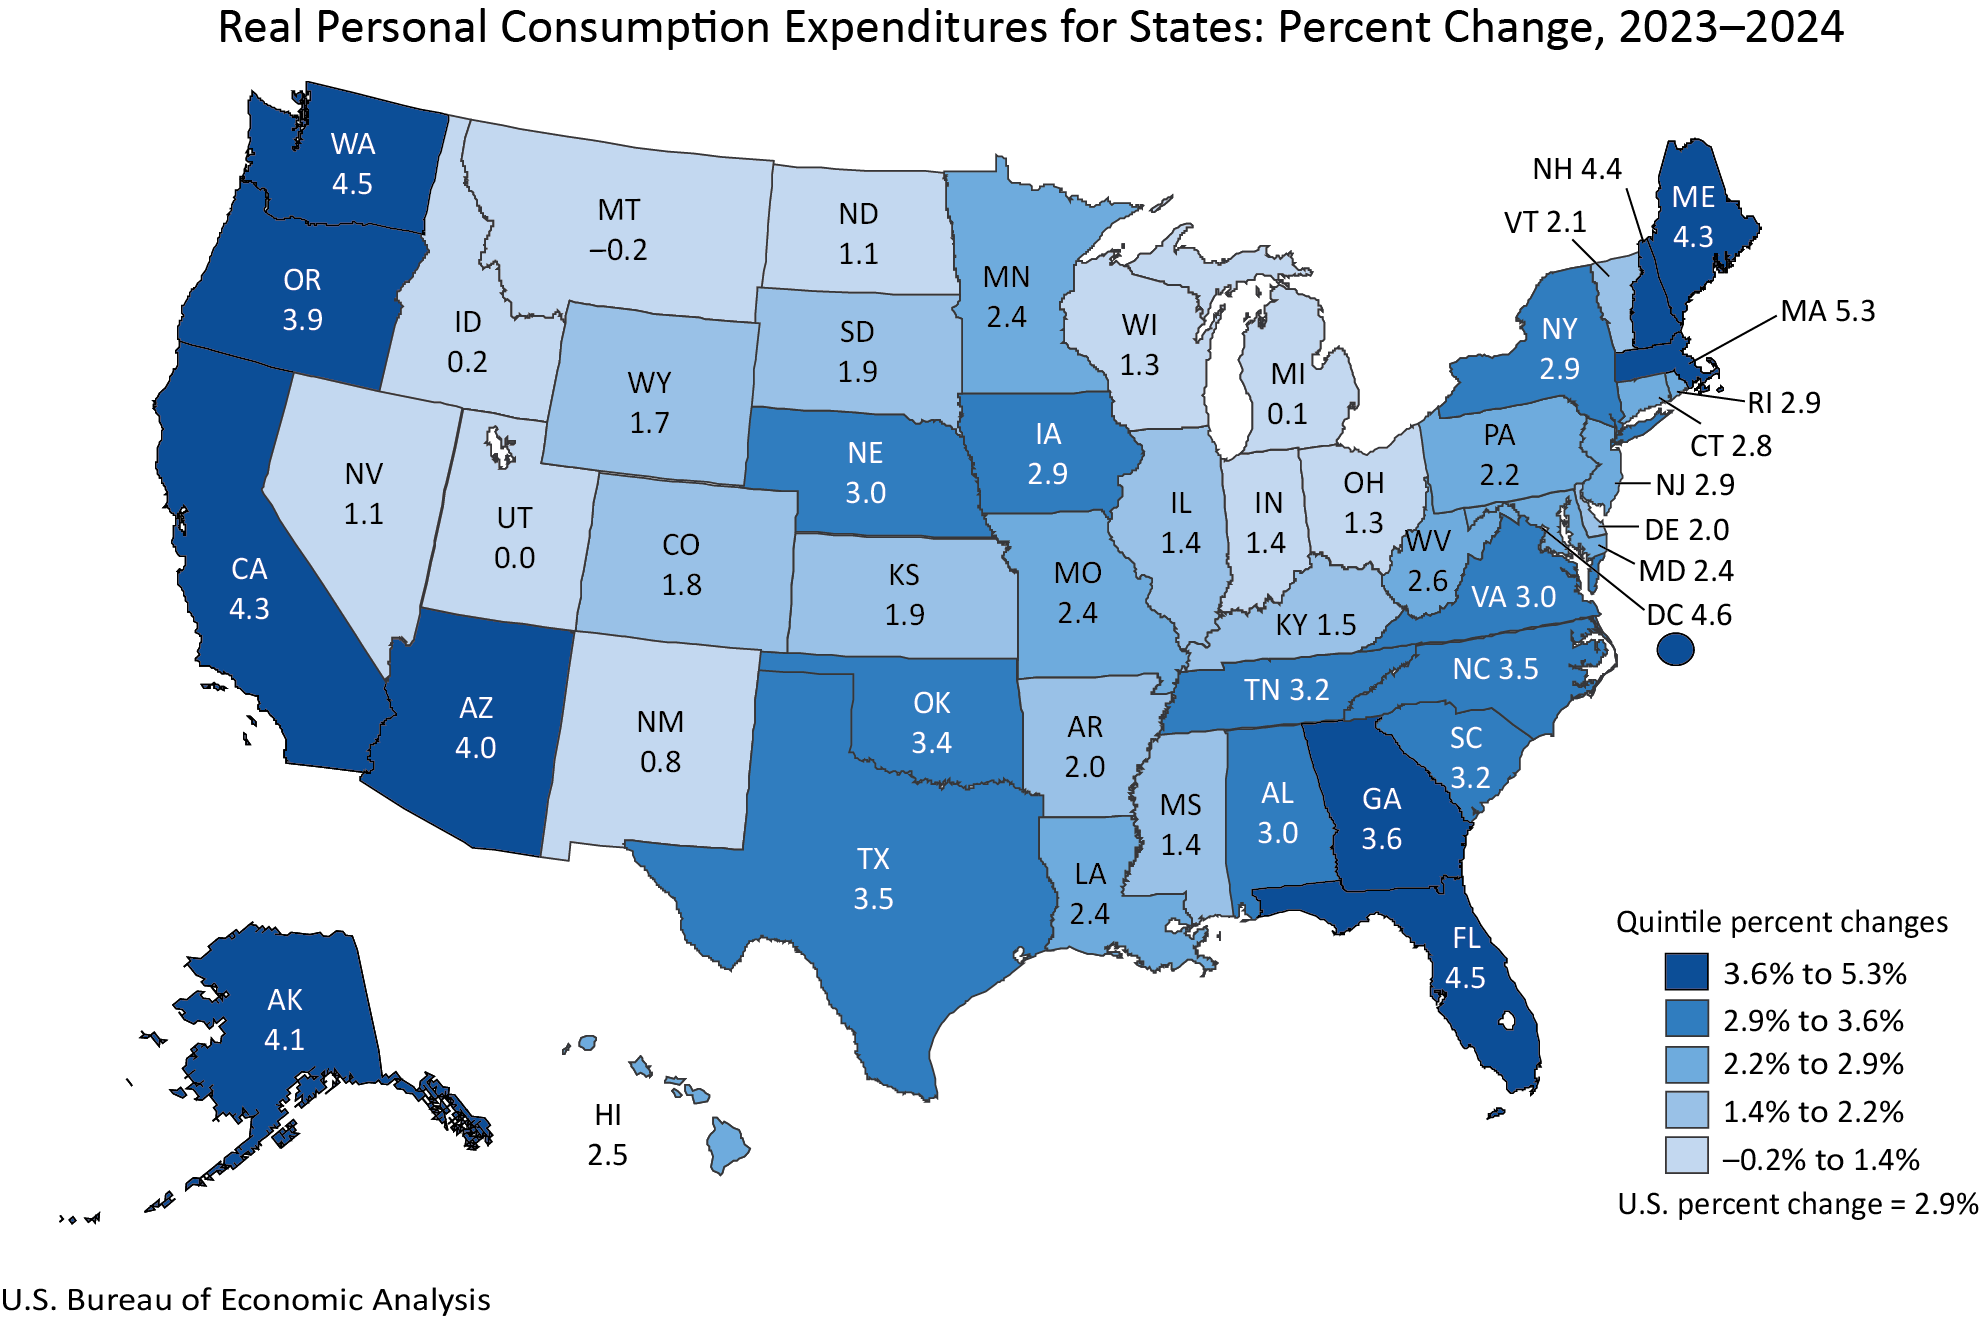
The data indicates a widespread increase in real personal consumption expenditures, with 48 states and the District of Columbia experiencing growth in 2024. This broad-based expansion suggests a nationwide recovery or continued growth in consumer confidence and economic activity. The range of growth, however, highlights significant regional economic dynamics. Massachusetts led the nation with a robust 5.3 percent increase in real PCE, signaling strong consumer demand and potentially a thriving job market or significant wealth effects within the state.
Conversely, Montana registered a slight decline of -0.2 percent in real PCE. While modest, this dip warrants attention as it stands in contrast to the general upward trend observed elsewhere. Factors contributing to such localized contractions can include specific industry downturns, demographic shifts, or localized inflationary pressures that outpaced income growth.
The BEA’s interactive data tables provide detailed percentage changes for real PCE by state, allowing for a granular analysis of individual state performance. These tables, accessible via the BEA’s website, enable users to explore historical trends and compare the performance of different states over time. The release includes specific links to Table SARPI (Real PCE by State—Percent Change From Preceding Period) and Table SAIRPD (Implicit Regional Price Deflator—Percent Change From Preceding Period), offering comprehensive data for researchers and policymakers.
Real Personal Income: Divergent Growth Patterns
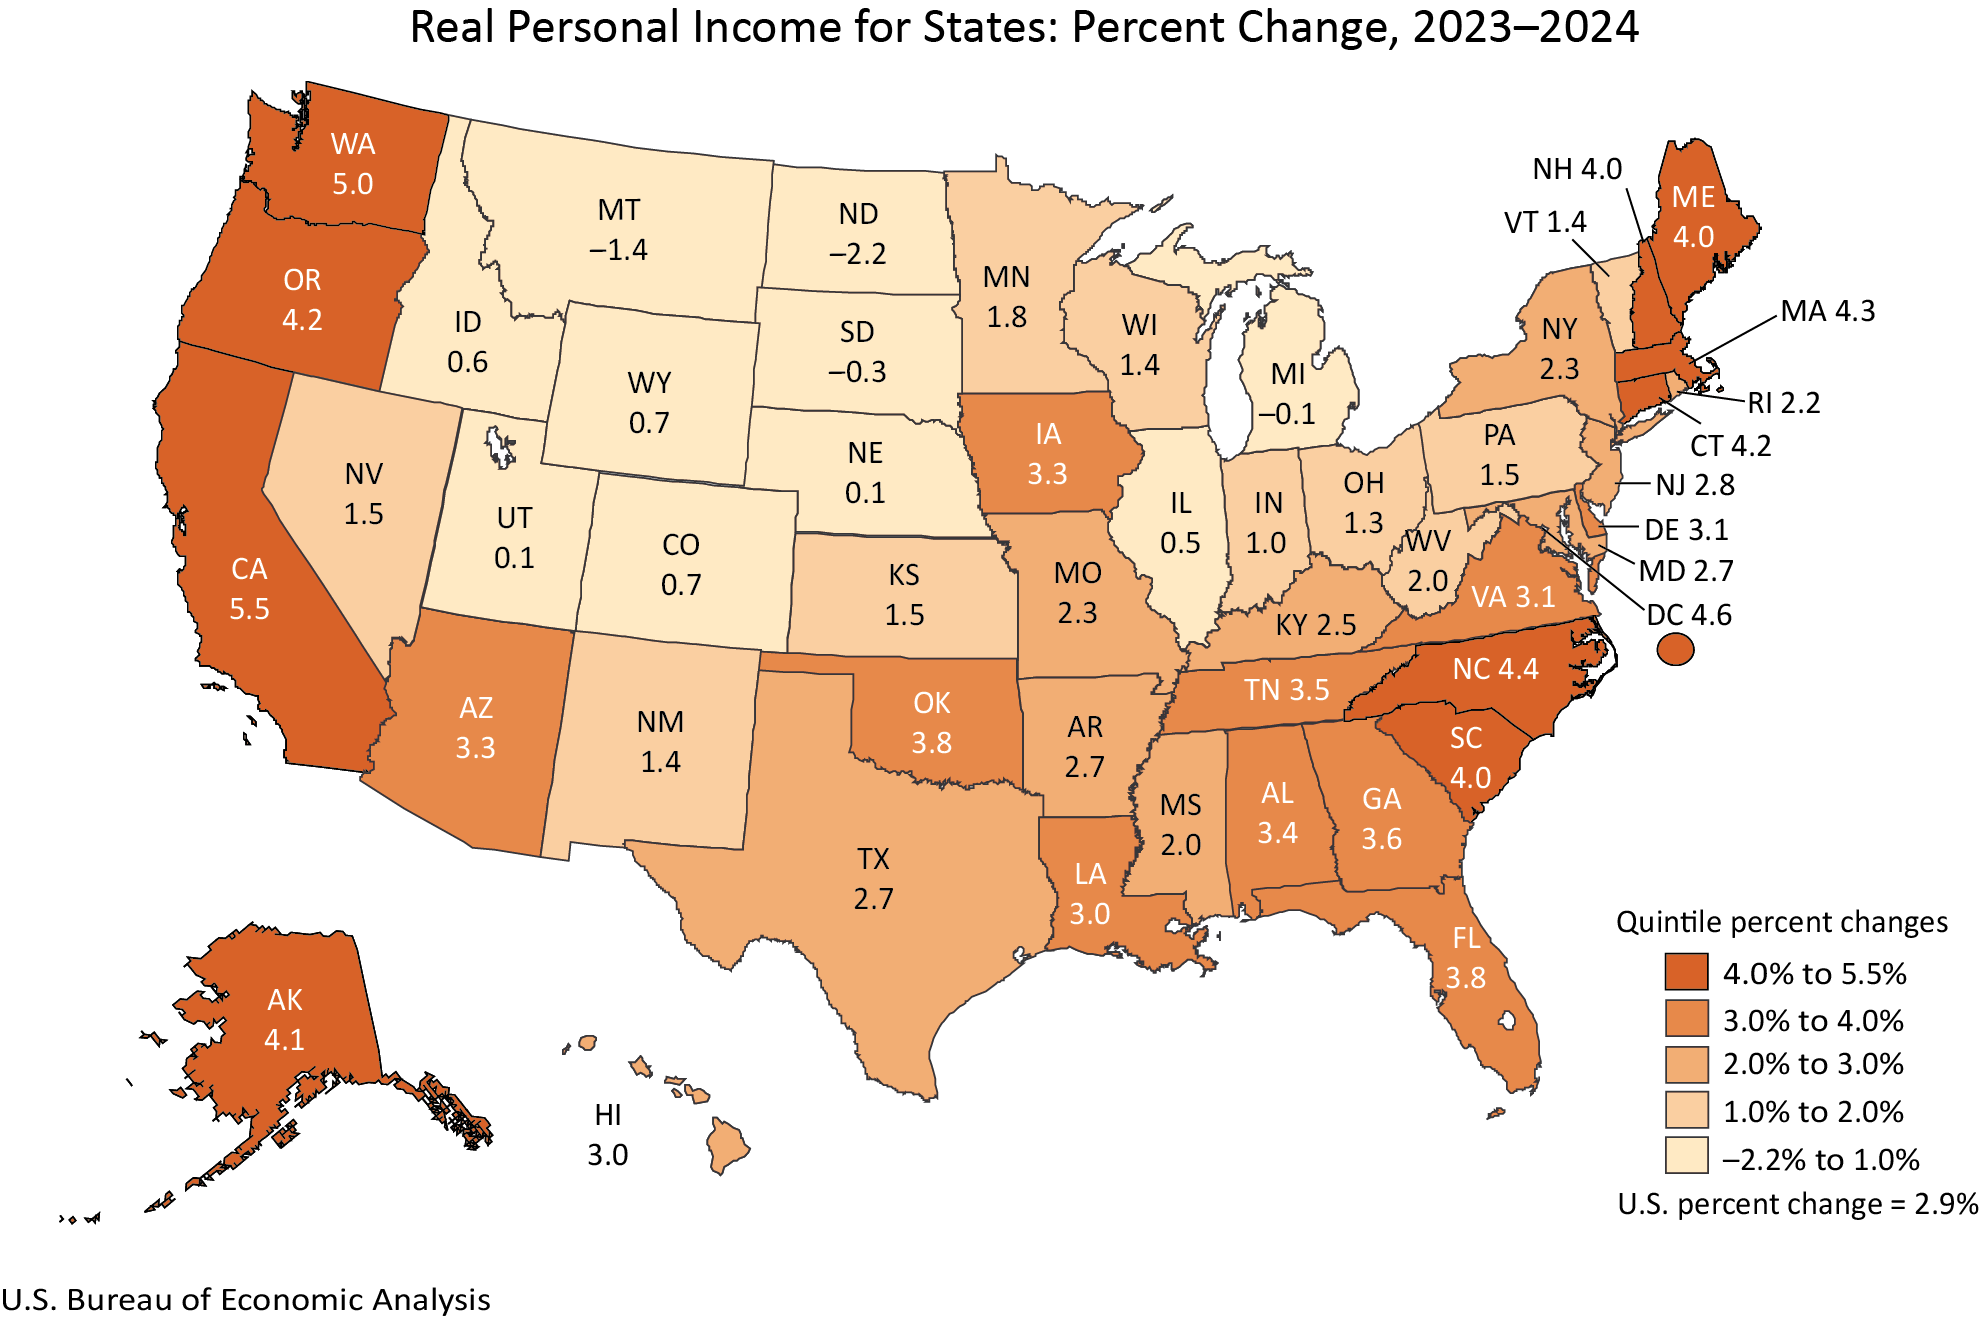
The landscape of real personal income growth in 2024 also demonstrated a broad upward trajectory, with 46 states and the District of Columbia reporting increases. California emerged as the top performer in this category, with real personal income growing by an impressive 5.5 percent. This strong showing in the nation’s most populous state has significant implications for national economic trends, reflecting potential gains in employment, wages, or investment income within the state.
In contrast, North Dakota experienced a decrease of -2.2 percent in real personal income. Such declines can be attributed to various factors, including fluctuations in key industries like agriculture or energy, or shifts in employment patterns. Understanding the specific economic drivers within these states is crucial for developing targeted economic policies.
As with PCE, national real personal income grew by 2.9 percent in 2024. The national current-dollar personal income saw a 5.6 percent increase, again outpacing the national PCE price index. This indicates that, on average, individuals’ earnings kept pace with or exceeded the rising cost of goods and services, allowing for an expansion of their real purchasing power. The BEA provides detailed data on current-dollar personal income by state, allowing for a deeper dive into the components of income growth.
Regional Price Parities: Understanding Cost of Living Differences
Regional Price Parities (RPPs) offer a critical lens through which to understand the variations in the cost of living across different states. These indices measure the differences in price levels for a given year, expressed as a percentage of the overall national price level. For instance, a state with an RPP of 110 would indicate that, on average, prices for a basket of goods and services are 10 percent higher than the national average.
The "all items RPP" includes all consumption goods and services, with housing rents often being a significant driver of differences in RPPs. High housing costs in metropolitan areas or states with limited housing supply can substantially inflate a state’s RPP, impacting the real value of income and the purchasing power of consumers. The BEA’s release includes detailed RPP data by state, with specific tables such as SARPP (RPPs by State—All Items (Index)) and SARPP (RPPs by State—Services: Rents (Index)) available for in-depth analysis.
The BEA’s interactive data application also provides access to metropolitan area RPP statistics, offering an even more localized view of price level variations. Understanding these regional price differences is paramount for policymakers, businesses, and individuals when making decisions related to wages, cost of living adjustments, and investment.
Revisions and Methodological Updates
A significant aspect of this annual release is the revision of historical data. The BEA has updated its annual estimates of real PCE by state and real personal income by state from 2008 to 2023. These revisions incorporate the latest available source data, which are often more complete and detailed than initially available. This practice ensures the accuracy and reliability of economic statistics, providing a more precise historical context for current trends.
These updates align with the BEA’s broader schedule of national economic account revisions. Specifically, the state-level data revisions are synchronized with the annual updates of the National Income and Product Accounts (NIPA) and GDP by industry statistics, which were released on September 25, 2025, and GDP, personal income, and PCE by state statistics released on September 26, 2025. This integrated approach to data revision strengthens the coherence of national and regional economic reporting.
Furthermore, the BEA has released new estimates of real per capita PCE and real per capita personal income for 2024. These per capita figures are calculated using U.S. Census Bureau population estimates for the years 2020 through 2024, providing a measure of economic output and income relative to the population size. Per capita measures are often used to gauge the average economic well-being of residents within a state.
Discontinuation of Metropolitan Area Statistics and Presentation Changes
In a notable shift, the BEA has discontinued the publication of statistics for metropolitan statistical areas and their constituent metropolitan and nonmetropolitan portions, coinciding with the release of 2024 data. While real PCE and real personal income estimates will continue to be provided at the state level, and RPPs will still be available for state and local areas, this change signifies a streamlining of data dissemination. The BEA cites efficiency and a focus on state-level aggregates as reasons for this adjustment, directing users to alternative sources or the continued availability of RPPs for more localized price analysis. A comprehensive FAQ is available on the BEA website for further clarification on this change.
Another significant update concerns the presentation of data. Tables that were previously embedded within the news release are now exclusively available through the BEA’s online Interactive Data Application. This move aims to reduce duplication, enhance efficiency, and provide users with more flexible and comprehensive data access. The interactive application allows for customization of data series, full time series retrieval, and diverse download options, including PDF, Excel, and CSV formats. This strategic shift encourages greater user engagement with the BEA’s robust data platform.
Implications and Future Outlook
The release of this detailed state-level economic data by the BEA offers invaluable insights for a wide range of stakeholders. For policymakers, it provides the granular information necessary to craft targeted economic development strategies, understand regional disparities, and assess the impact of fiscal and monetary policies. Businesses can leverage this data to inform decisions regarding market expansion, labor force planning, and pricing strategies. For individuals, understanding these economic indicators can offer a clearer picture of their state’s economic health and its potential impact on their personal finances and career opportunities.
The consistent growth in real PCE and real personal income across most states suggests a resilient national economy. However, the variations in growth rates and the existence of states with declining figures underscore the importance of continued monitoring and analysis of regional economic trends. Factors such as technological innovation, global trade dynamics, and demographic shifts will continue to shape these economic landscapes, making the BEA’s timely and accurate data essential for navigating the evolving economic environment.
The next release, scheduled for December 10, 2026, at 8:30 a.m. EST, will present the 2025 data for real personal consumption expenditures and real personal income by state. This upcoming release will supersede the 2024 data, and the links provided in this release will be updated to reflect the latest statistics. For those needing access to the data featured in this specific release after it is superseded, the BEA’s Data Archive will serve as a repository for historical information. The BEA’s commitment to providing detailed and timely economic statistics remains a cornerstone of informed economic policy and analysis in the United States.