Lana Rhoades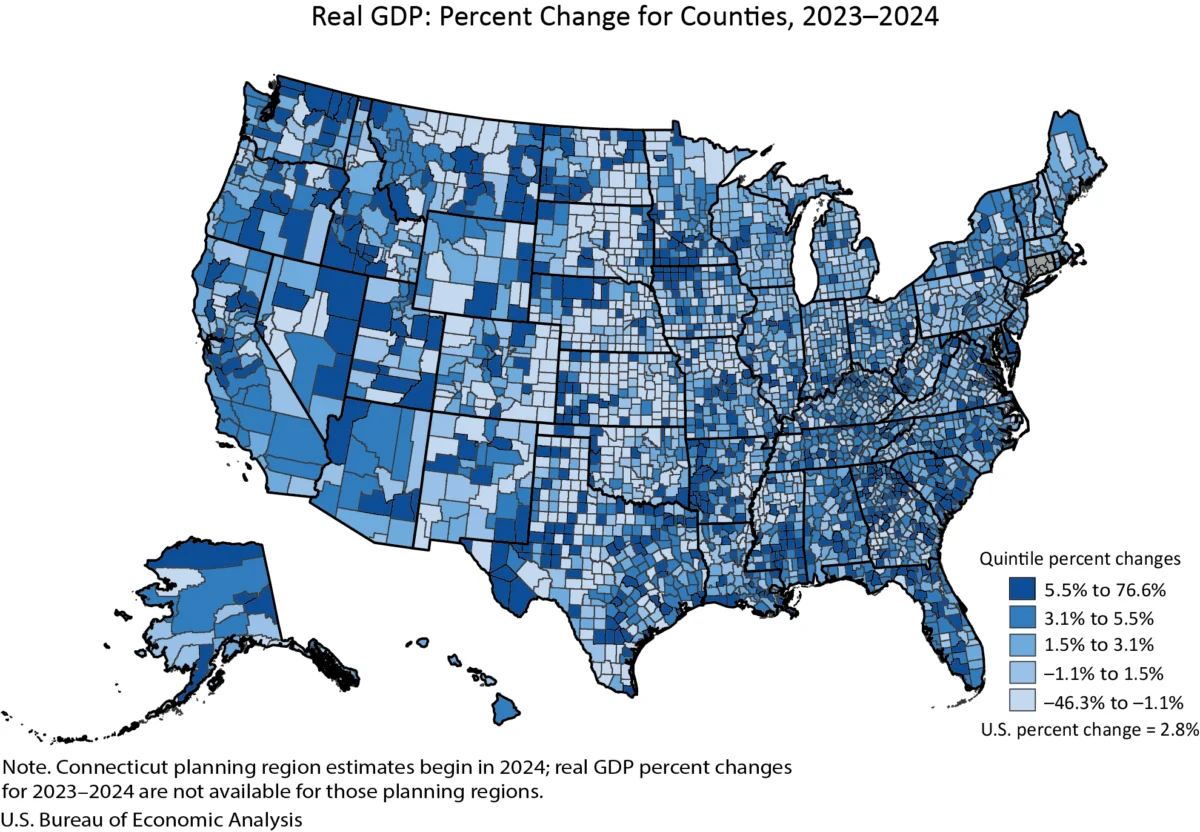
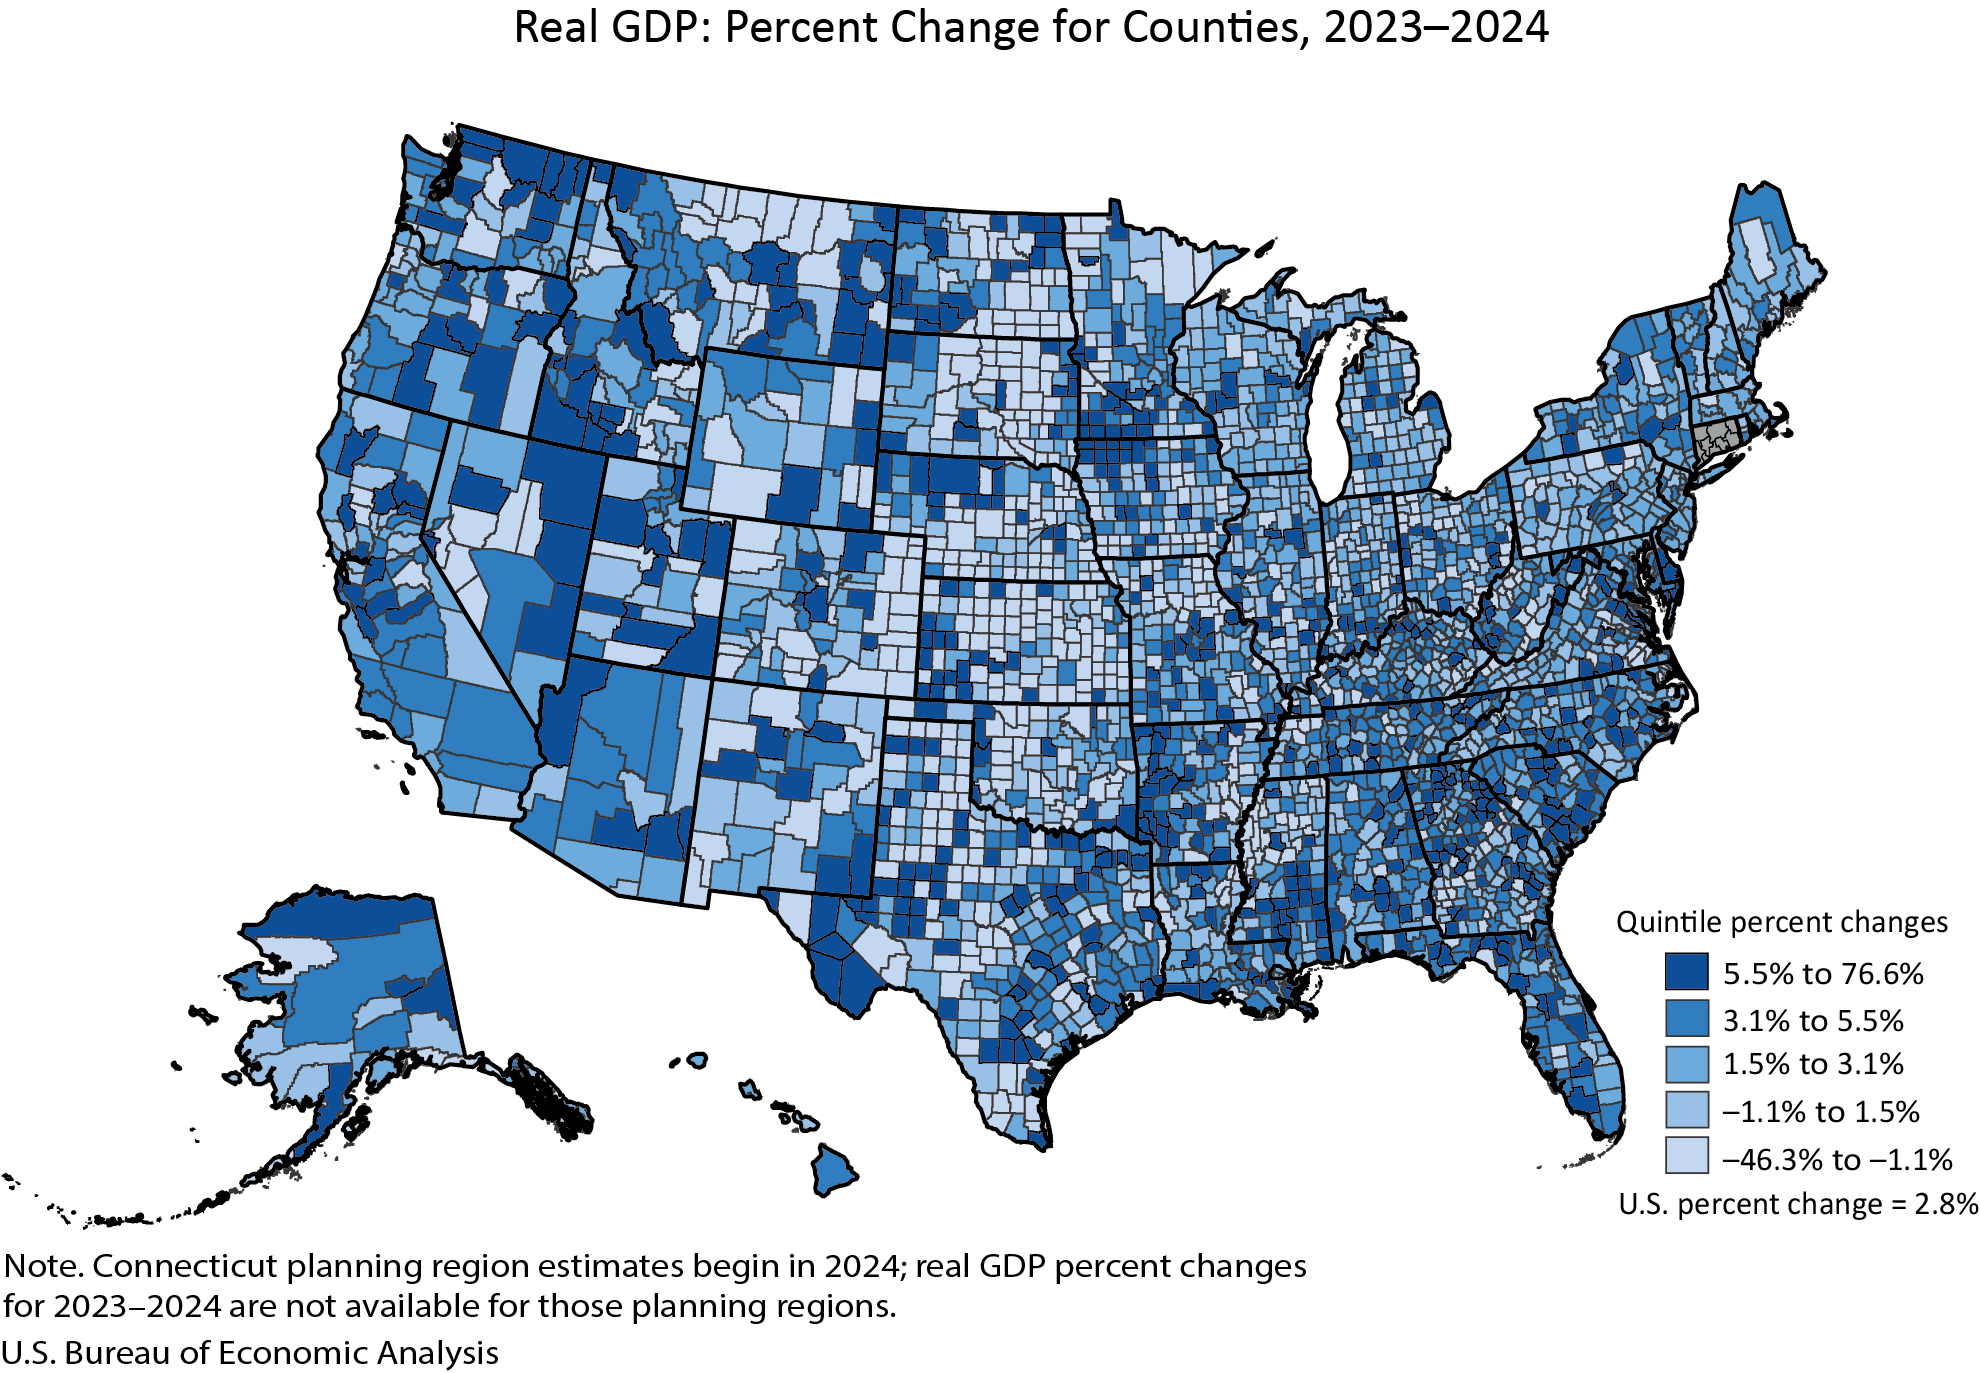
The U.S. Bureau of Economic Analysis (BEA) has released its comprehensive annual estimates for county-level Gross Domestic Product (GDP) and personal income for 2024, painting a detailed picture of economic activity and income distribution across the nation. The report indicates a widespread trend of economic expansion at the county level, though with significant variations in magnitude and impact. In total, real GDP experienced an increase in 2,273 counties, while 809 counties saw a decrease, and 24 remained unchanged. This broad-based growth underscores a generally positive economic environment, yet highlights the localized nature of economic performance.
The data, released today, reveals a dynamic economic landscape where individual counties are experiencing vastly different trajectories. Real GDP, a measure of the total value of goods and services produced in a specific area, adjusted for inflation, showed a remarkable range in its percentage change. The most striking growth was observed in Carter County, Montana, which recorded an exceptional 76.6 percent increase. Conversely, Baca County, Colorado, experienced the most significant contraction, with a 46.3 percent decline in real GDP. These extreme figures underscore the localized drivers of economic change, which can be influenced by a multitude of factors including industry shifts, resource extraction, and demographic trends.
The sheer scale of economic output also varies dramatically from county to county. In 2024, New York County, New York, stood as the economic powerhouse, boasting a staggering total real GDP of $813.7 billion. This figure is a testament to the concentration of financial services, commerce, and innovation within this urban hub. On the other end of the spectrum, Issaquena County, Mississippi, reported a real GDP of $15.7 million, illustrating the vast disparities in economic scale that exist within the United States. These differences in economic size reflect historical development, industry specialization, and population density, each playing a crucial role in shaping a county’s economic footprint.
County Economic Performance by Population Size
The BEA report further segmented its findings by county population size, offering deeper insights into how economic trends are distributed across different types of communities.
Large Counties (Population > 500,000):
These major economic centers, numbering 145 in 2024, largely contributed to the overall growth. Their real GDP experienced a trend range from a robust 10.7 percent increase in Pinal County, Arizona, to a stable 0.0 percent change in Johnson County, Kansas. The economic size of these counties is substantial, with New York County, NY, leading at $813.7 billion and Pinal County, AZ, at $12.7 billion. These large counties often benefit from diversified economies, robust infrastructure, and access to a large labor force, contributing to their resilience and growth potential.
Medium Counties (Population 100,000 to 500,000):
With 451 such counties, this group demonstrated a healthy economic expansion. The trend range for real GDP in these counties was from a notable 12.4 percent increase in Jefferson County, Texas, to a slight decline of 2.6 percent in Black Hawk County, Iowa. The economic scale here is significant, with Mercer County, New Jersey, reporting $46.6 billion and Liberty County, Texas, at $2.6 billion. These counties often serve as regional hubs, providing essential services and employment opportunities to surrounding areas.
Small Counties (Population < 100,000):
This largest category, comprising 1,677 counties, exhibited the widest range of economic performance. The trend for real GDP varied from an exceptional 76.6 percent surge in Carter County, Montana, to a substantial 46.3 percent contraction in Baca County, Colorado. The economic size within this group also spans a broad spectrum, from Martin County, Texas, at $15.1 billion to Issaquena County, Mississippi, at $15.7 million. The performance of smaller counties can be particularly sensitive to sector-specific changes, such as fluctuations in commodity prices or the success of niche industries.
Personal Income Trends Mirror Economic Activity
Beyond the aggregate measure of GDP, the BEA also released updated statistics on personal income, a key indicator of household well-being and consumer spending power. In 2024, personal income, measured in current dollars, saw an increase in 2,768 counties, a decrease in 331, and remained unchanged in 7 counties. This widespread growth in personal income suggests that the economic gains at the county level are translating into increased earnings for residents, a positive sign for household financial health and local consumption.
The percentage change in personal income across counties also displayed a significant range. Harding County, South Dakota, recorded the highest increase at 22.6 percent, indicating a substantial rise in earnings for its residents. Conversely, Issaquena County, Mississippi, experienced the steepest decline in personal income, falling by 23.3 percent. These figures highlight the direct impact of economic activity on individual financial circumstances, with fluctuations in employment, wages, and transfer payments playing a crucial role.
The total level of personal income also varies considerably across the nation. In 2024, Los Angeles County, California, reported the highest personal income at $818.5 billion, reflecting its status as a major economic and population center. In contrast, Loving County, Texas, recorded the lowest personal income at $10.6 million. These disparities in income levels are often influenced by factors such as the presence of high-paying industries, the cost of living, and the overall economic structure of a county.
Personal Income by Population Size
Similar to GDP, personal income trends were analyzed based on county population size, revealing distinct patterns:
Large Counties (Population > 500,000):
With 146 large counties, personal income saw a trend range from a 9.7 percent increase in San Joaquin County, California, to a 2.7 percent increase in Philadelphia County, Pennsylvania. The economic scale is immense, with Los Angeles County, CA, at $818.5 billion and Pinal County, AZ, at $26.1 billion. These areas often benefit from diverse employment opportunities and higher average wages.
Medium Counties (Population 100,000 to 500,000):
In these 474 counties, personal income growth was also robust, with Merced County, California, showing a 10.9 percent increase and Genesee County, Michigan, at 1.6 percent. The economic size here is substantial, exemplified by Collier County, Florida, with $62.5 billion, and Floyd County, Georgia, at $4.9 billion.
Small Counties (Population < 100,000):
This category, with 2,148 counties experiencing income growth, displayed the most varied outcomes. Harding County, South Dakota, saw a 22.6 percent increase, while Issaquena County, Mississippi, experienced a 23.3 percent decline. The economic scale varies widely, from Teton County, Wyoming, at $12.4 billion to Loving County, Texas, at $10.6 million. The performance in smaller counties can be more volatile, influenced by local industries and external economic shocks.
Updates and Methodological Changes
The BEA’s release of the 2024 county statistics incorporates significant updates and methodological refinements. The estimates for 2024 are based on annual updates to GDP and personal income by county, which also involved revisions to data from 2020 through 2023. These revisions are crucial for ensuring the accuracy and completeness of the economic data, incorporating new and improved source data. This alignment with national and state-level accounts, released on September 25 and 26, 2025, respectively, ensures consistency across different levels of economic reporting.
A notable change for Connecticut is the incorporation of its planning region geographic definitions into the 2024 estimates, replacing the traditional county-based definitions. This shift is aimed at better reflecting the economic integration and functional geographies within the state. As these planning region estimates are new for 2024, they have not been included in the percentage change calculations for growth ranges, a detail that users of the data should note.
Furthermore, the BEA has introduced new estimates for per capita personal income for 2024, calculated using U.S. Census Bureau population figures for the period 2020-2024. This metric provides an average measure of income per person, offering another lens through which to view economic well-being at the county level.
Consolidation and Discontinuation of Statistical Series
In a move to streamline its publications and provide a more holistic view of regional economies, the BEA has consolidated its county-level GDP and personal income data into a single, integrated news release for the first time. This combined approach aims to offer a more comprehensive understanding of economic conditions across all counties, replacing the previous practice of issuing separate reports on different days.
Concurrently, the BEA has announced the discontinuation of its publication of statistics for several metropolitan and micropolitan statistical areas. This includes data for metropolitan statistical areas, micropolitan statistical areas, metropolitan divisions, combined statistical areas, and metropolitan and nonmetropolitan portions. The focus will now be exclusively on county-level estimates for GDP and personal income. This strategic shift signals a greater emphasis on granular, county-level economic analysis. A detailed FAQ is available for those seeking more information on this change.
Enhanced Data Access and Presentation
The presentation of data tables has also undergone a significant transformation. Moving forward, tables previously embedded within the news releases will now be exclusively available through the BEA’s Interactive Data Application. This change is intended to reduce duplication, increase efficiency, and direct users to the most comprehensive and flexible data resources. The online application allows for customization, including full time series, and data can be downloaded in various formats such as PDF, Excel, and CSV. Links within the news release will now guide users directly to these interactive tables.
For users seeking specific data points, the BEA has provided direct links to relevant interactive tables for both GDP and personal income by county. These tables include summaries of percentage changes from preceding periods, as well as levels of GDP in chained 2017 dollars and personal income in current dollars.
Future Outlook and Data Archiving
The BEA has also outlined its release schedule and data archiving policy. The next release, scheduled for December 2, 2026, at 8:30 a.m. EST, will feature the 2025 GDP and personal income by county statistics. Upon this release, the 2024 data will be superseded in the interactive application. Historical data from the 2024 release will be accessible through BEA’s Data Archive, ensuring that historical economic trends remain available for research and analysis.
The BEA emphasizes that for definitions, statistical conventions, regional classifications, and the uses of these statistics, users should refer to the "Additional Information" section on their website. This comprehensive approach to data dissemination and methodological transparency aims to empower users with the tools and understanding necessary to interpret the complex economic landscape of the United States at the county level.