

 Lana Rhoades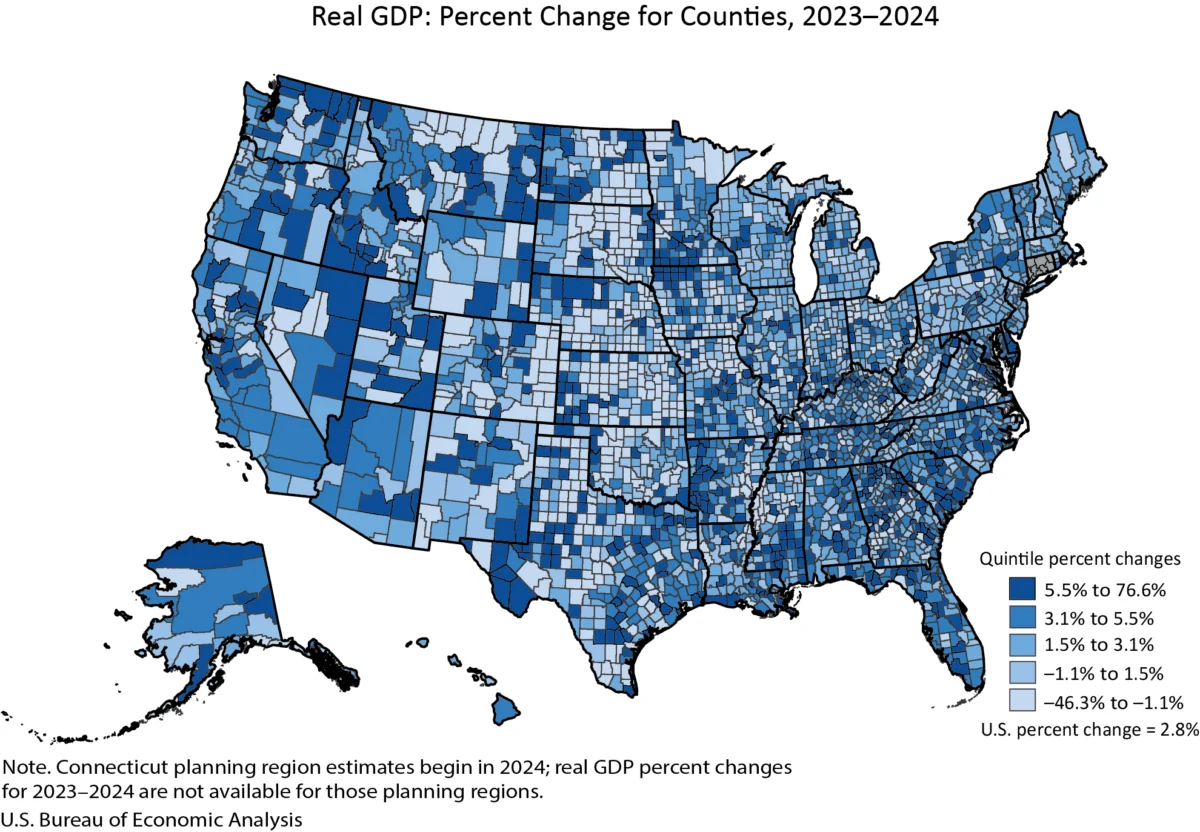
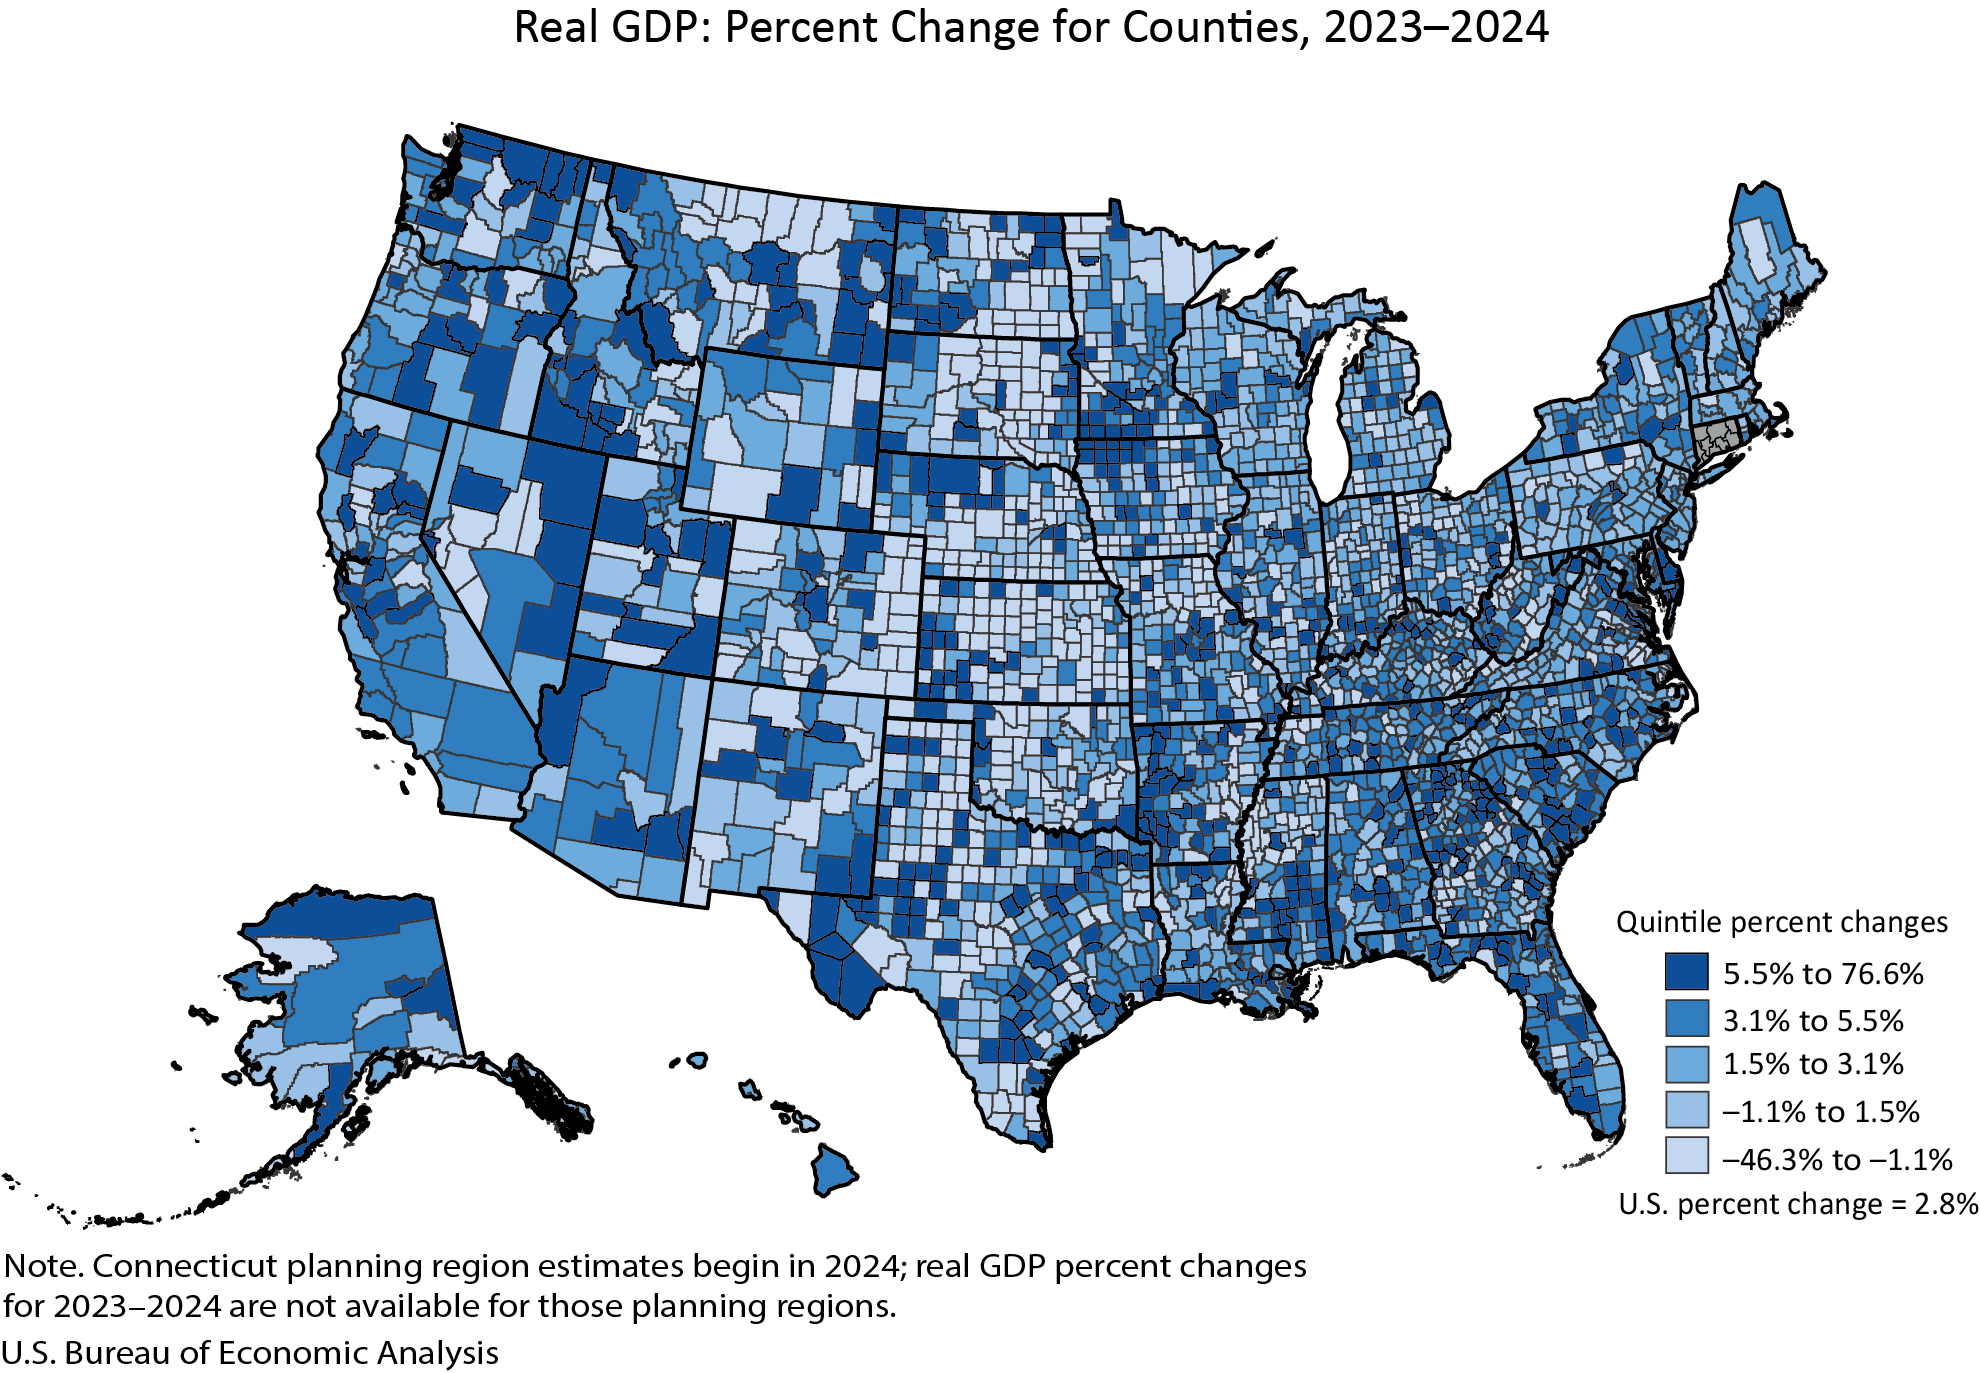
The U.S. economy demonstrated broad-based growth in 2024, with real gross domestic product (GDP) expanding in a significant majority of counties nationwide. According to the latest estimates released by the U.S. Bureau of Economic Analysis (BEA), 2,273 counties experienced an increase in their real GDP, signaling a widespread positive economic trend. This growth was contrasted by declines in 809 counties and stagnation in 24 counties. The data, compiled from the BEA’s annual updates to county-level economic indicators, provides a granular view of economic activity across the nation, highlighting both areas of robust expansion and those facing challenges.
The percent change in real GDP across these counties presented a wide spectrum. At the upper end, Carter County, Montana, recorded an impressive 76.6 percent surge, indicative of a highly localized economic boom. Conversely, Baca County, Colorado, experienced the most significant downturn, with its real GDP decreasing by 46.3 percent. These extreme figures underscore the considerable variations in economic performance at the county level, influenced by a multitude of factors including industry concentration, resource availability, and local policy initiatives.
H2: Understanding County-Level Economic Metrics
Real Gross Domestic Product (GDP) is a fundamental measure of economic output, representing the inflation-adjusted value of all final goods and services produced within a specific geographic area during a given period. For counties, this metric offers a crucial lens through which to understand their economic health and dynamism. The BEA’s annual estimates provide a consistent methodology for tracking these changes over time, allowing for comparisons and trend analysis.
The sheer scale of economic activity also varies dramatically among U.S. counties. In 2024, New York County, New York (Manhattan), stood as the largest economic engine, with a total real GDP of $813.7 billion. This figure reflects its status as a global financial hub and a center for a vast array of service industries. On the other end of the spectrum, Issaquena County, Mississippi, reported the smallest economic footprint, with a real GDP of just $15.7 million. This stark contrast illustrates the vast disparities in economic size and complexity that characterize the American landscape.
H2: GDP Performance by County Size
The BEA’s analysis further categorizes county economic performance by population size, offering insights into how different types of communities are faring.
-
Large Counties (Population > 500,000): These economic powerhouses saw 145 counties experience GDP growth, with zero reporting a decline, and one remaining unchanged. The range of growth in these counties was substantial, with Pinal County, Arizona, leading the pack with a 10.7 percent increase. Johnson County, Kansas, reported a stable economic performance with no appreciable change. The economic scale of these large counties is immense, exemplified by New York County, NY, with its $813.7 billion GDP, and Pinal County, AZ, with $12.7 billion, showcasing the deep economic reserves present in these metropolitan centers.
-
Medium Counties (Population 100,000 to 500,000): This segment of counties demonstrated widespread positive trends, with 451 reporting growth, 20 experiencing declines, and 3 remaining unchanged. Jefferson County, Texas, registered a notable 12.4 percent increase in its real GDP. In contrast, Black Hawk County, Iowa, saw a modest contraction of 2.6 percent. The economic scale here is significant, with Mercer County, New Jersey, boasting a $46.6 billion GDP, while Liberty County, Texas, measured at $2.6 billion, indicating a broad range of economic capacities within this group.
-
Small Counties (Population < 100,000): These counties, which form the largest group, also showed a mixed but generally positive trend. A substantial 1,677 small counties experienced GDP growth, while 789 recorded declines, and 20 remained unchanged. The extremes in performance were most pronounced here, with Carter County, Montana’s 76.6 percent surge and Baca County, Colorado’s 46.3 percent decline highlighting the volatility that can affect smaller, often more specialized economies. Despite the fluctuations, the economic scale can still be significant, with Martin County, Texas, at $15.1 billion, and Issaquena County, Mississippi, at $15.7 million, illustrating the diverse economic realities within this classification.
H2: Personal Income Trends Mirror Economic Activity
Complementing the GDP data, the BEA also released estimates for personal income, another critical indicator of economic well-being at the local level. In 2024, personal income, measured in current dollars, showed an even more widespread positive trend than GDP. A remarkable 2,768 counties saw an increase in personal income, with only 331 experiencing a decrease and 7 remaining unchanged.
The percent change in personal income ranged from a robust 22.6 percent increase in Harding County, South Dakota, to a significant 23.3 percent decline in Issaquena County, Mississippi. This parallel with GDP trends suggests that the economic expansions and contractions observed in GDP are generally translating into changes in the income available to residents.
H2: Personal Income Distribution Across Counties
Similar to GDP, personal income levels exhibit considerable variation across the United States. Los Angeles County, California, reported the highest total level of personal income at $818.5 billion, underscoring its position as a major economic and demographic center. At the other end of the spectrum, Loving County, Texas, recorded the lowest personal income at $10.6 million, reflecting its unique economic structure and small population.
H2: Personal Income Performance by County Size
The breakdown of personal income trends by population size also reveals distinct patterns:
-
Large Counties: With 146 large counties showing income growth, this sector demonstrated strong economic health. San Joaquin County, California, led with a 9.7 percent increase, while Philadelphia County, Pennsylvania, saw a 2.7 percent rise. The economic scale is substantial, with Los Angeles County, CA, at $818.5 billion and Pinal County, AZ, at $26.1 billion.
-
Medium Counties: This category also experienced widespread gains, with 474 counties reporting increased personal income. Merced County, California, saw a notable 10.9 percent increase, and Genesee County, Michigan, posted a 1.6 percent rise. Collier County, Florida, with $62.5 billion, and Floyd County, Georgia, with $4.9 billion, represent the economic breadth within this group.
-
Small Counties: While accounting for the largest number of counties, this group also saw the most significant fluctuations. 2,148 small counties experienced income growth, but 331 saw declines, and 7 remained stable. Harding County, South Dakota’s 22.6 percent increase and Issaquena County, Mississippi’s 23.3 percent decline represent the extreme ends of this trend. Teton County, Wyoming, at $12.4 billion, and Loving County, Texas, at $10.6 million, showcase the wide economic disparities within this segment.
H2: Methodological Updates and Data Revisions
The release of the 2024 county statistics is accompanied by significant methodological updates and data revisions. The BEA has incorporated the results of its annual updates to GDP and personal income by county, revising estimates from 2020 to 2023. These revisions are crucial as they integrate more complete and up-to-date source data, ensuring greater accuracy and consistency with national and state-level economic accounts. Specifically, the county data has been aligned with the National Income and Product Accounts (NIPA) update released on September 25, 2025, and the state-level GDP and personal income statistics released on September 26, 2025.
A notable change for Connecticut’s estimates is the adoption of its planning region geographic definitions, replacing traditional county boundaries for the 2024 data. As these regional estimates are only available for 2024, they are not included in the percent change calculations, which rely on year-over-year comparisons using consistent geographic units.
Furthermore, the BEA utilized U.S. Census Bureau population figures to calculate per capita personal income estimates for the period spanning 2020 through 2024, enhancing the precision of these key metrics.
H2: Streamlined Reporting and Discontinuation of Certain Statistics
In a move to enhance efficiency and provide a more integrated view of regional economies, the BEA has consolidated its county-level reporting. For the first time, annual GDP and personal income by county are being published in a single, combined news release. This aims to offer a more comprehensive picture of county economies and replaces the previous practice of issuing two separate releases on different dates.
Concurrently, the BEA has announced the discontinuation of publication for statistics related to metropolitan statistical areas, micropolitan statistical areas, metropolitan divisions, combined statistical areas, and their metropolitan and nonmetropolitan portions. This decision means that GDP and personal income estimates will now be exclusively published at the county level. The BEA has provided a dedicated FAQ for users seeking further information on this transition.
H2: Enhanced Data Access Through Interactive Application
Reflecting a broader trend towards digital data dissemination, the BEA has updated its presentation of tables. Data previously embedded within news releases are now exclusively available through the BEA’s online Interactive Data Application. This move is intended to reduce duplication, increase efficiency, and direct data users to the most comprehensive and flexible data tables. The interactive application allows for customization, access to full time series, and downloading data in various formats, including PDF, Excel, and CSV. Links within the news release provide direct access to these dynamic datasets.
H2: Looking Ahead: Future Releases and Data Archiving
The BEA has outlined its schedule for future releases, with the next update for GDP and personal income by county scheduled for December 2, 2026, at 8:30 a.m. EST, covering the 2025 data. Following this release, the 2024 data will be superseded in the interactive application. Historical data from the current release will be preserved and accessible through BEA’s Data Archive, ensuring continuity for researchers and analysts.
H2: Broader Economic Context and Implications
The widespread GDP growth across a majority of U.S. counties in 2024 is a positive indicator of national economic resilience. This broad-based expansion suggests that the economic recovery and growth observed at the national level are permeating down to the local economies. The strong performance in personal income further reinforces this narrative, indicating that residents in many areas are experiencing improved financial well-being.
However, the significant number of counties experiencing GDP declines and the wide range of performance figures highlight persistent regional disparities. Factors such as industry dependence (e.g., reliance on sectors heavily impacted by global commodity prices or technological shifts), demographic trends (aging populations, out-migration), and the availability of skilled labor likely contribute to these divergences.
The BEA’s decision to discontinue metropolitan area statistics and focus solely on counties reflects a strategic shift towards more granular, consistent geographic reporting. This may lead to a deeper understanding of economic dynamics within specific communities, but it also means that analysis previously conducted at the metropolitan level will need to be re-evaluated or adapted. The enhanced accessibility through the Interactive Data Application is a welcome development, offering users greater control and flexibility in exploring the rich dataset.
The interplay between GDP growth and personal income increases across most counties suggests a healthy economic environment in 2024. Yet, the existence of counties facing significant economic headwinds warrants continued attention from policymakers and economic development agencies. Understanding the specific drivers behind both the successes and the struggles at the county level will be crucial for formulating targeted strategies to foster inclusive and sustainable economic growth across the United States. The BEA’s comprehensive data releases provide the essential foundation for such analyses, empowering stakeholders with the insights needed to navigate the complex economic landscape.








