

 Lana Rhoades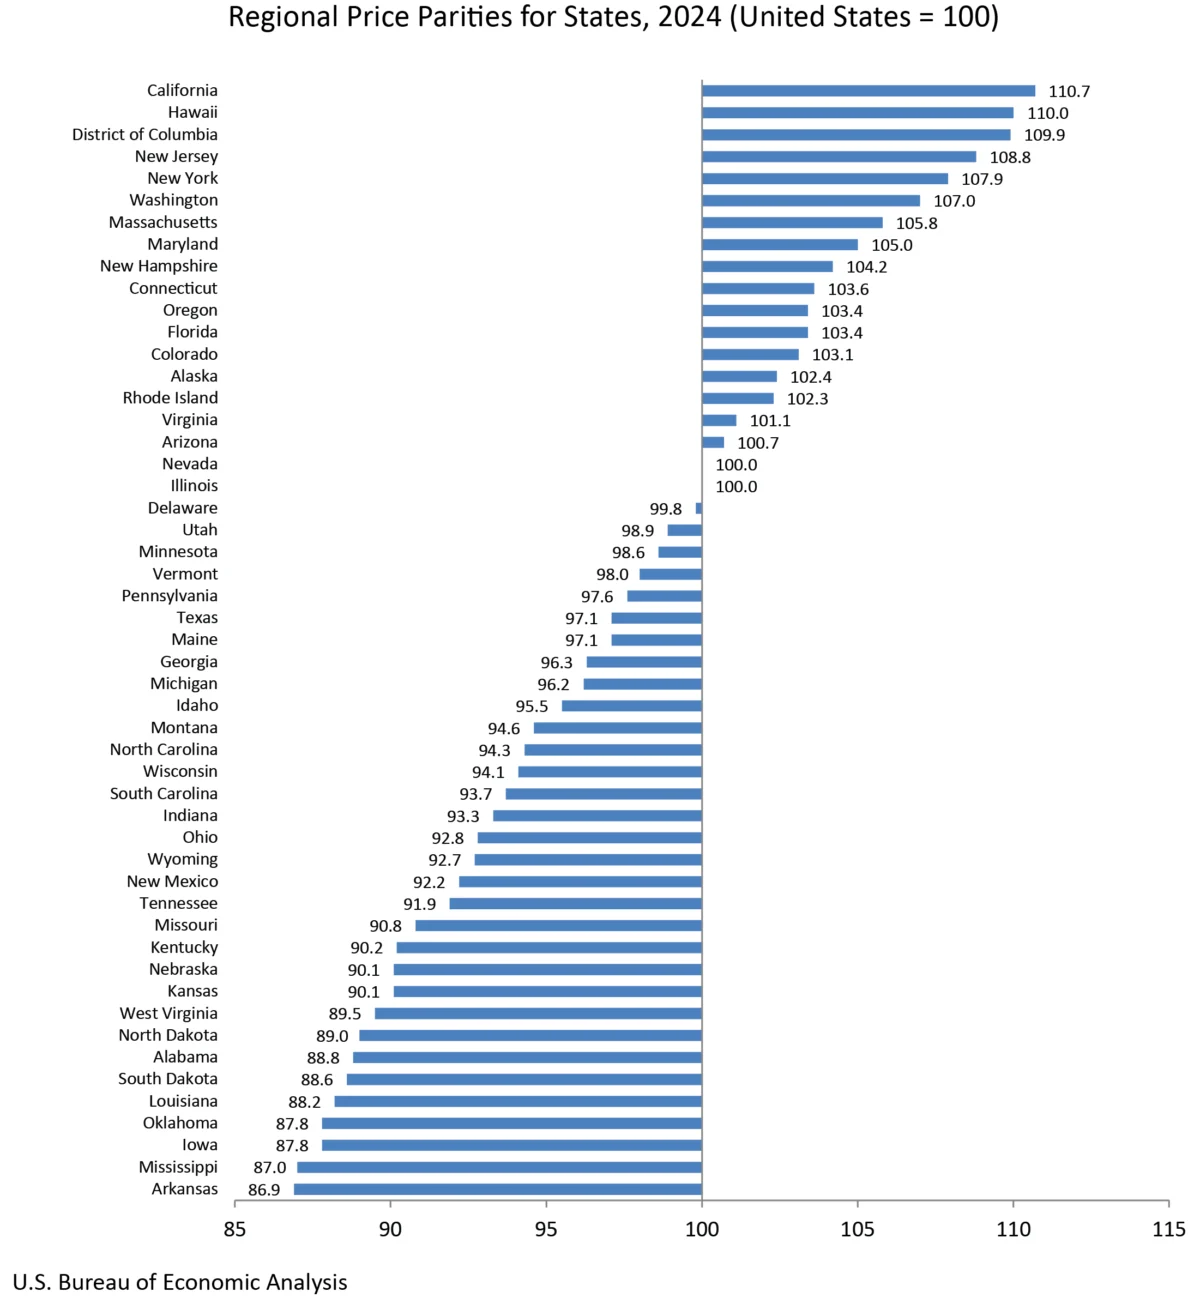
The U.S. Bureau of Economic Analysis (BEA) today unveiled its comprehensive annual statistics for 2024, offering a detailed look at real personal consumption expenditures (PCE), real personal income, and regional price parities (RPPs) across all 50 states and the District of Columbia. This release provides critical insights into the uneven economic recovery and varying cost of living experienced by Americans in the past year, with significant implications for consumers, businesses, and policymakers alike.
Key Findings: A Patchwork of Economic Performance
The data reveals a nation experiencing a complex economic tapestry, with most states showing growth in real personal consumption expenditures, a key indicator of consumer spending power. However, the pace of this growth and the underlying income trends paint a more nuanced picture, highlighting disparities in economic vitality and affordability.
Real Personal Consumption Expenditures (PCE): Broad-Based Growth with Notable Exceptions
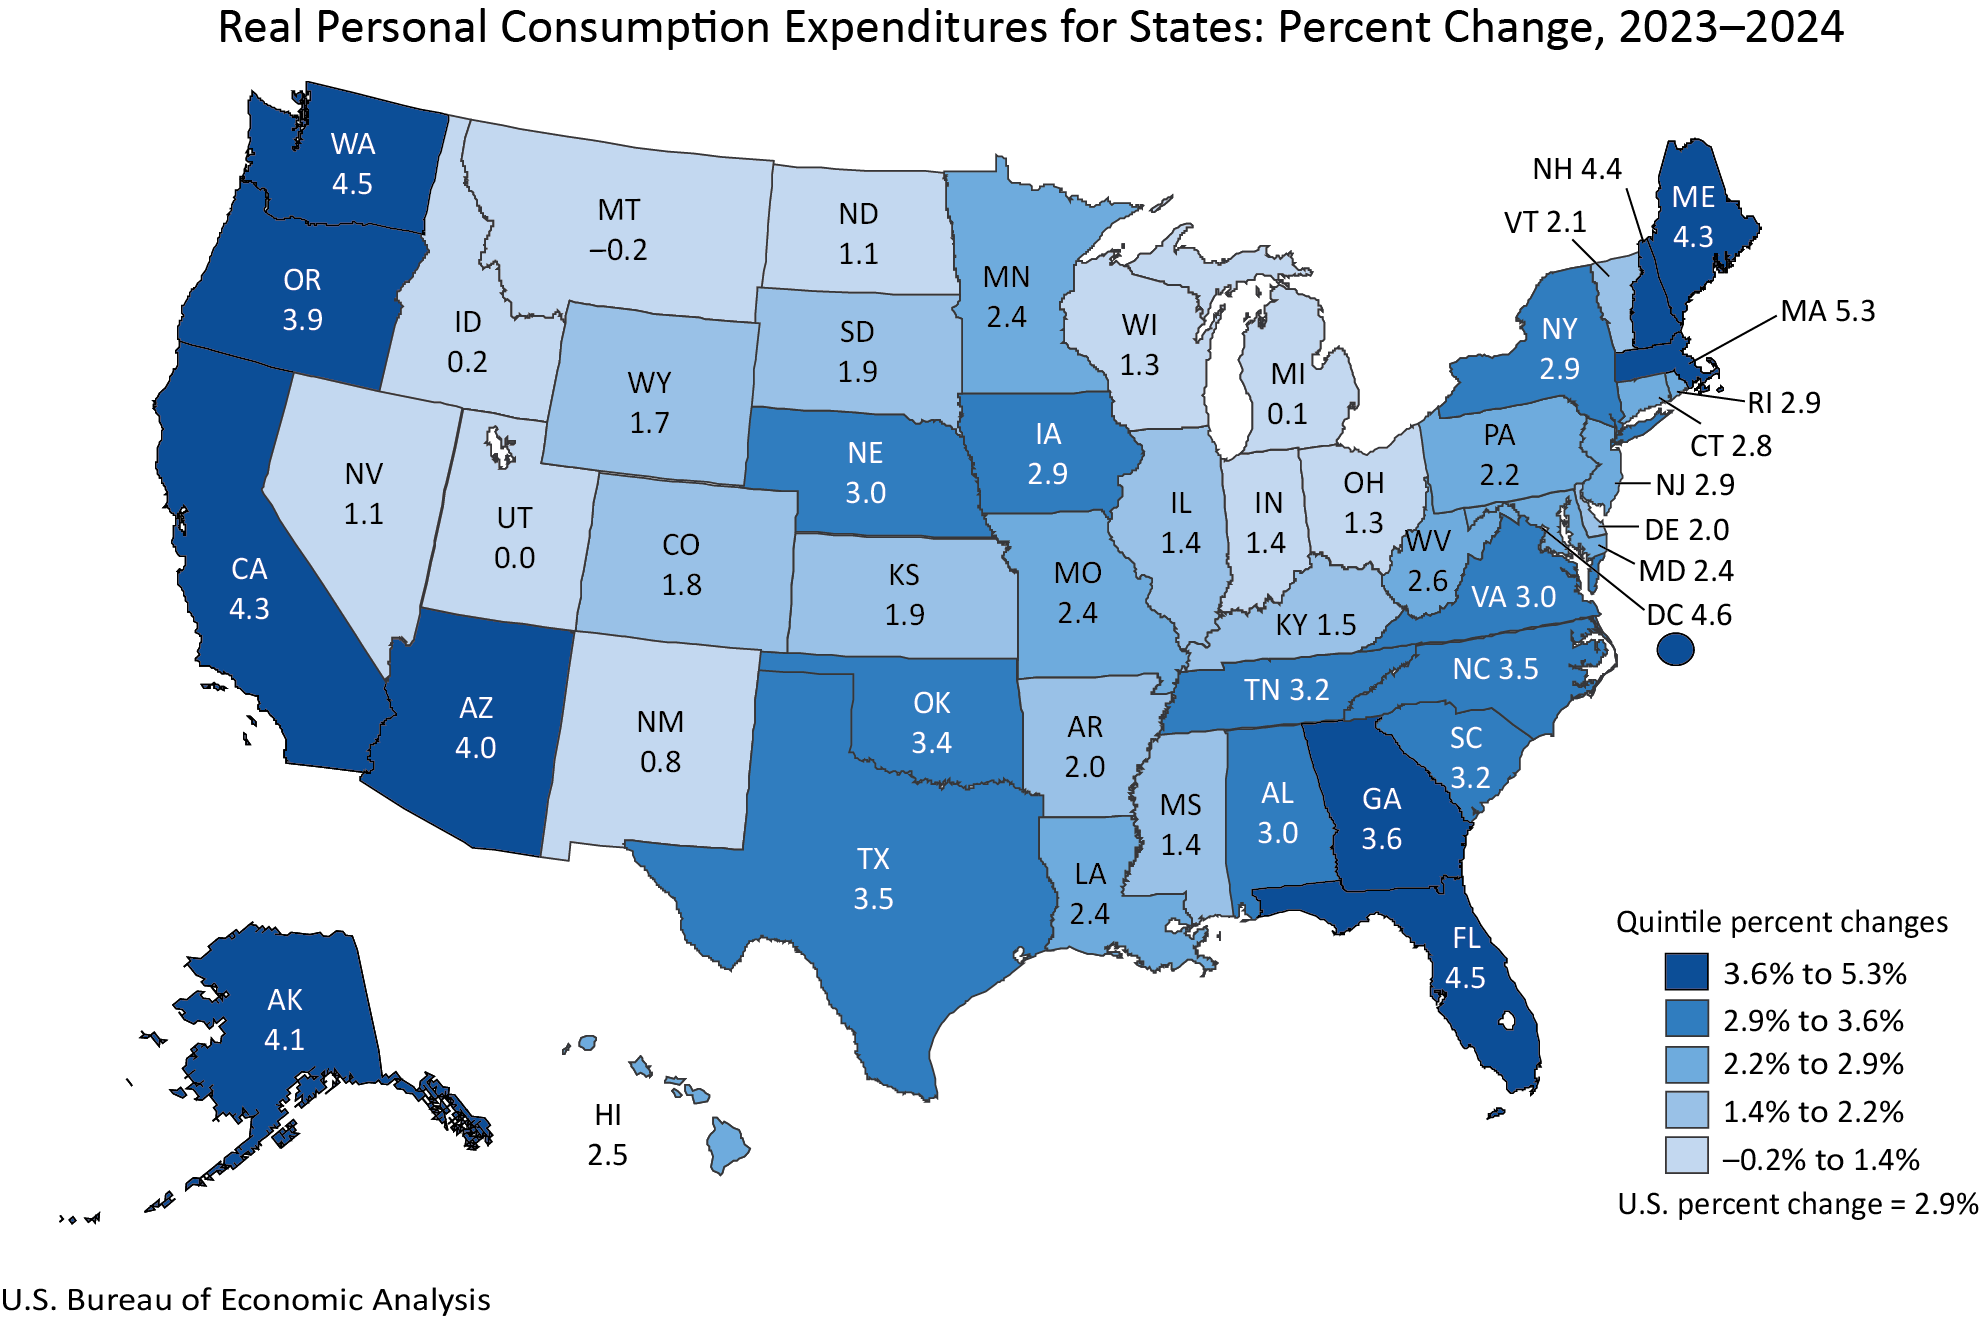
In 2024, a substantial majority of states demonstrated an increase in real PCE. Specifically, 48 states and the District of Columbia saw their residents spend more on goods and services after accounting for inflation. This broad-based trend suggests a general resilience in consumer demand across the country.
Massachusetts led the nation in real PCE growth, registering an impressive 5.3 percent increase. This surge in consumer spending indicates a robust economic environment in the Bay State, potentially driven by strong employment figures, high-wage industries, and increased disposable income. On the other end of the spectrum, Montana experienced a slight contraction in real PCE, declining by 0.2 percent. This minor decrease might signal localized economic challenges, such as a slowdown in key sectors or demographic shifts impacting consumer behavior.
Nationally, real PCE saw a growth of 2.9 percent in 2024. This figure is particularly significant when contrasted with the increase in current-dollar PCE, which rose by 5.6 percent. The gap between these two figures is largely explained by the national PCE price index, which grew by 2.6 percent. This indicates that while consumers were spending more in nominal terms, a portion of that increase was absorbed by rising prices. The BEA’s methodology for calculating real PCE involves adjusting current-dollar estimates by regional price parities and the national PCE price index, providing a clearer picture of the actual volume of goods and services purchased by households.
Real Personal Income: California Shines, North Dakota Faces Challenges
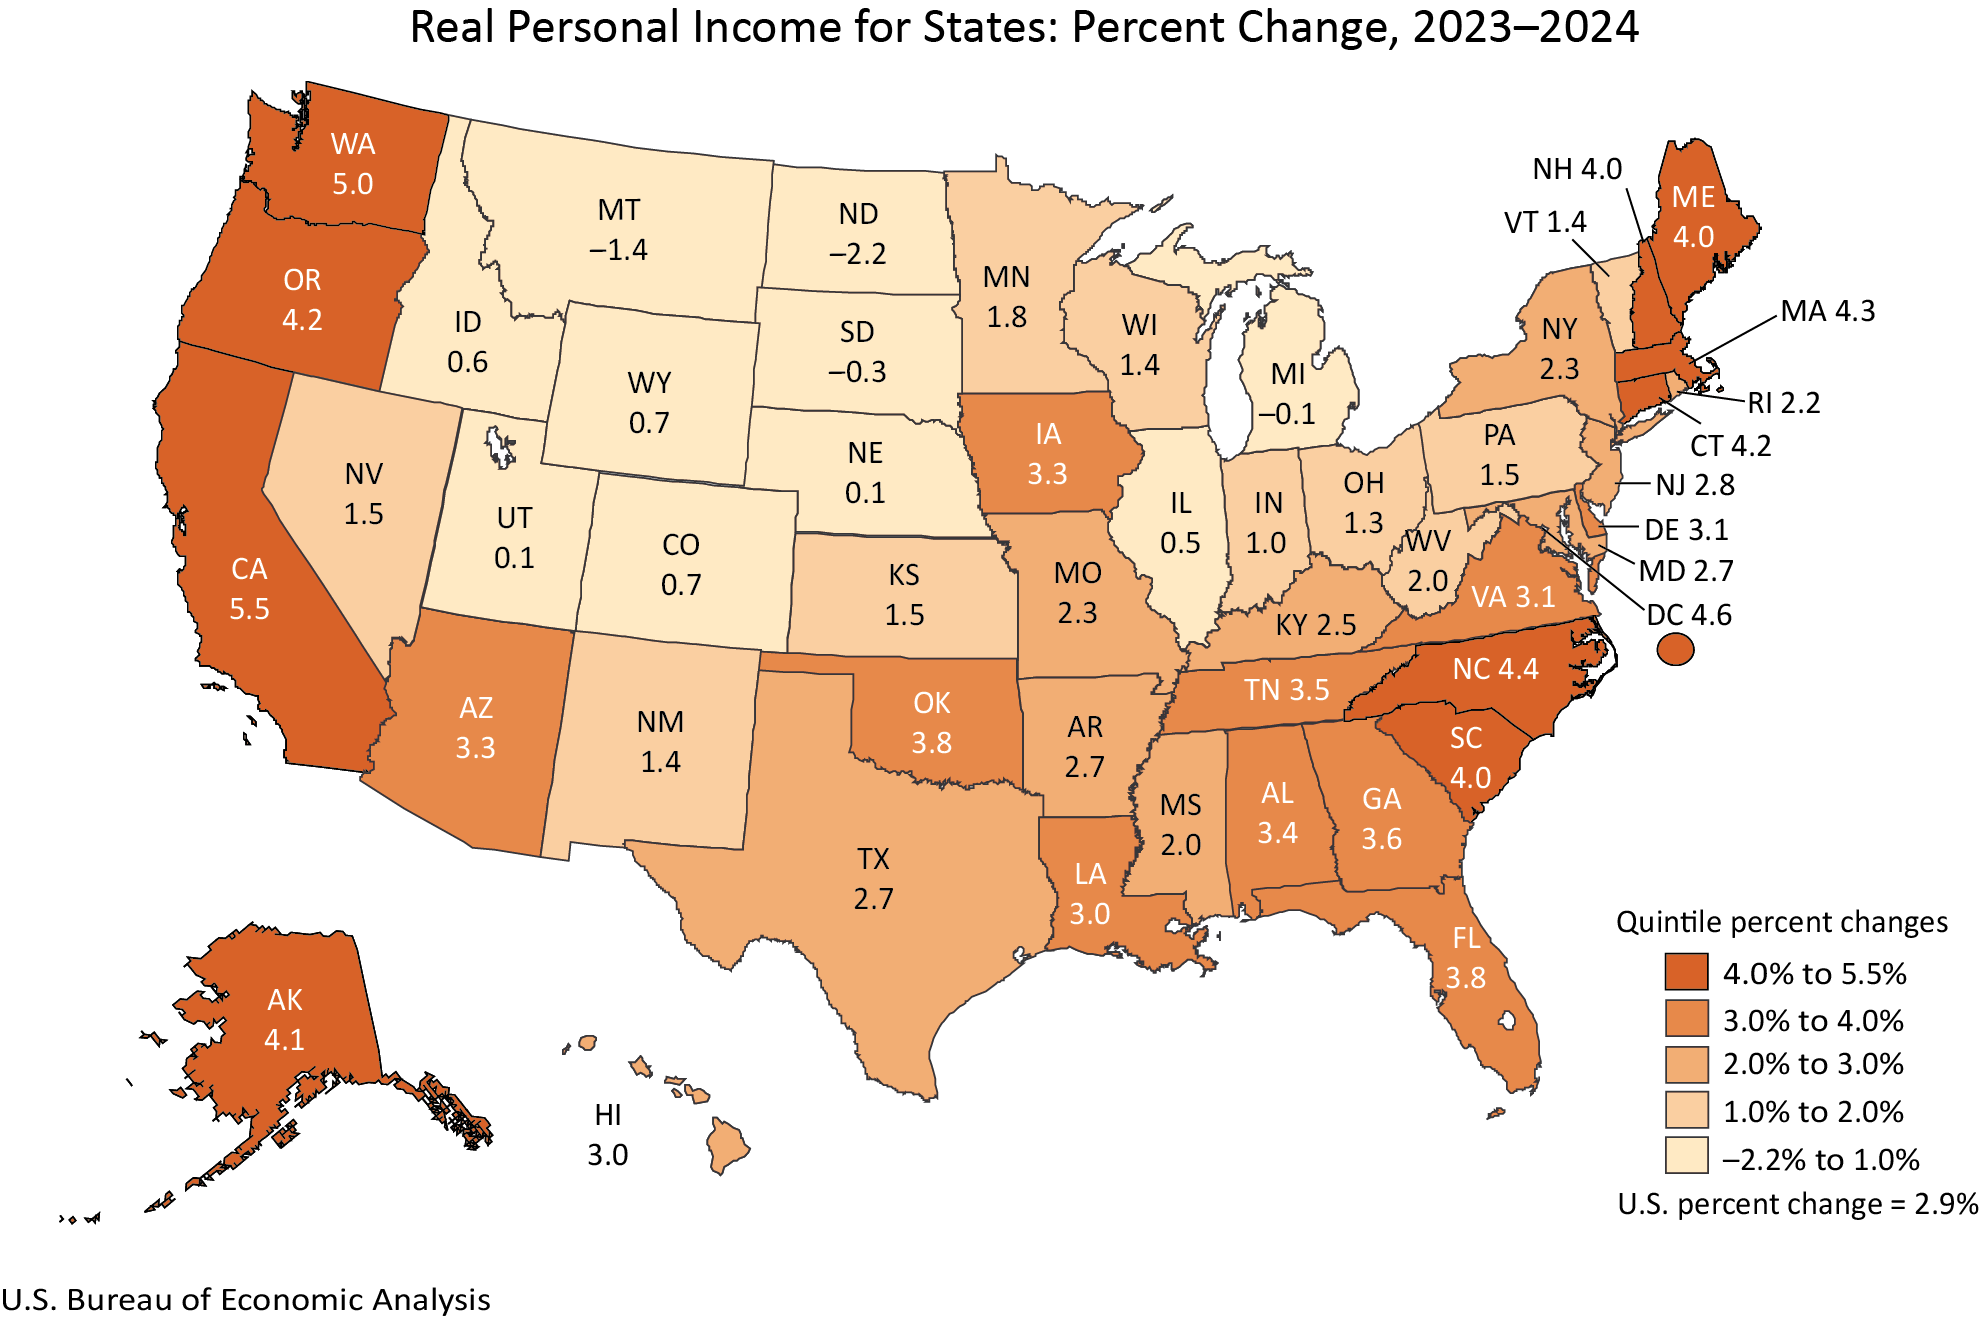
The trends in real personal income, which measures the purchasing power of individuals after accounting for inflation and taxes, show a slightly different pattern. In 2024, real personal income increased in 46 states and the District of Columbia. This indicates that for most Americans, their earnings kept pace with or outpaced inflation, allowing for sustained or increased purchasing power.
California emerged as a frontrunner in real personal income growth, with a remarkable 5.5 percent increase. This strong performance suggests a booming economy in the Golden State, likely fueled by its robust technology sector, entertainment industry, and other high-value economic activities. In contrast, North Dakota experienced a significant decline of 2.2 percent in real personal income. This contraction could be attributed to various factors, including fluctuations in the energy sector, which has historically been a major driver of North Dakota’s economy, or other localized economic headwinds.
Similar to PCE, national real personal income grew by 2.9 percent in 2024. The current-dollar personal income saw a more substantial increase of 5.6 percent, again outstripping the national PCE price index. This parity between the growth in real personal income and real PCE at the national level suggests a relatively balanced economic picture for the nation as a whole, where income gains are largely translating into actual consumption, albeit with price pressures.
Regional Price Parities (RPPs): The Persistent Influence of Housing Costs
Regional price parities are a crucial component of the BEA’s analysis, measuring the differences in price levels across states. Expressed as a percentage of the national average, RPPs help to understand the true cost of living in different parts of the country. The "all items RPP," which encompasses all consumption goods and services including housing rents, reveals significant variations.
While the specific RPP figures for 2024 are presented in detailed tables, the BEA consistently highlights that housing rents are a primary driver of differences in RPPs. States with high housing costs, particularly in major metropolitan areas, tend to have higher RPPs, meaning that the same basket of goods and services would cost more in those regions compared to areas with lower housing expenses. This has a direct impact on the real value of personal income and consumption. For instance, even if nominal income is high in an expensive state, the higher cost of living due to RPPs can diminish its real purchasing power.
A Deeper Dive into the Data and Its Implications
The BEA’s annual release is not merely a statistical update; it’s a vital report card on the nation’s economic health at the state level. Understanding the nuances of PCE, personal income, and price levels provides policymakers with the data needed to craft targeted economic strategies, assist businesses in making informed investment decisions, and empower consumers to better manage their finances.
Understanding Real vs. Nominal Growth: The distinction between current-dollar and real figures is paramount. While a state might report a healthy increase in nominal income, if inflation and price levels outpace that growth, the real purchasing power of its residents may actually decline. The BEA’s real measures correct for these price changes, offering a more accurate assessment of economic well-being.
The Role of Housing in RPPs: The persistent influence of housing costs on RPPs underscores a long-standing economic challenge in the U.S. High housing prices in desirable areas can create significant affordability issues, impacting consumer spending patterns, labor mobility, and overall economic equity. This data suggests that efforts to address housing affordability could have a substantial ripple effect on state economies.
Per Capita Insights: The BEA also released new estimates for real per capita PCE and real per capita personal income for 2024, utilizing U.S. Census Bureau population figures. These per capita measures provide a standardized way to compare economic well-being across states, factoring in population size and density. While specific figures are not detailed in the initial release summary, these statistics are crucial for understanding individual economic standing.
Revisions and Data Archiving: Enhancing Accuracy and Accessibility
A significant aspect of this annual release is the revision of historical data. The BEA has updated its annual estimates for real PCE and real personal income by state from 2008 to 2023. These revisions incorporate newly available and more comprehensive source data, ensuring greater accuracy and consistency with broader national economic accounts, such as the National Income and Product Accounts and Gross Domestic Product (GDP) by industry statistics. This meticulous process of data refinement is critical for maintaining the reliability of economic indicators.
Furthermore, the BEA has transitioned its presentation of data. Tables previously included within the news release are now exclusively available through the BEA’s online Interactive Data Application. This move aims to reduce redundancy, increase efficiency, and provide users with more dynamic and customizable data exploration tools. These interactive tables allow for the selection of full time series, various download formats (PDF, Excel, CSV), and greater flexibility in data analysis. While this shift may require users to adapt to a new access method, it ultimately points towards a more robust and user-friendly data dissemination strategy.
Discontinuation of Metropolitan Area Statistics
In a notable change, the BEA has discontinued the publication of statistics for metropolitan statistical areas and their metropolitan and nonmetropolitan portions, effective with the 2024 data release. Real PCE and real personal income will continue to be reported at the state level, and RPPs will still be available for states and local areas. This decision, detailed in an accompanying FAQ, reflects a strategic refocusing of BEA’s data collection and reporting efforts. While this may limit granular analysis at the sub-state level, the continued availability of state-level data and local RPPs aims to mitigate the impact on most data users.
Broader Economic Context and Future Outlook
The release of these 2024 statistics comes at a time of ongoing economic debate and adaptation. Following a period of significant disruption, including the COVID-19 pandemic and subsequent inflationary pressures, understanding the localized impacts of economic policy and global trends is more important than ever.
The divergence in state-level performance suggests that national economic trends do not uniformly affect all regions. Factors such as industry concentration, labor market dynamics, state fiscal policies, and demographic shifts all play a crucial role in shaping individual state economies. For instance, states heavily reliant on sectors that experienced significant growth in 2024, such as technology or renewable energy, likely saw stronger income and consumption figures. Conversely, states with economies more exposed to sectors facing headwinds might exhibit slower growth or even contraction.
The data on regional price parities also reinforces the ongoing conversation about cost of living and its impact on economic mobility. As housing prices and other essential goods and services continue to fluctuate, the real economic well-being of residents in different states can diverge significantly, even with similar nominal income levels. This has implications for migration patterns, labor force participation, and the overall economic competitiveness of various regions.
Looking Ahead: The BEA has also provided a preview of its next release, scheduled for December 10, 2026, which will cover real personal consumption expenditures and real personal income by state for 2025. This forward-looking information signals the BEA’s commitment to providing timely and relevant economic data that aids in understanding the evolving economic landscape of the United States. The 2024 data, as released today, serves as a crucial benchmark, offering a detailed snapshot of the nation’s economic condition as it navigates the complexities of the post-pandemic era. The ongoing revisions and enhancements to data presentation underscore the BEA’s dedication to providing high-quality, accessible economic intelligence to inform decision-making at all levels.








