

 Lana Rhoades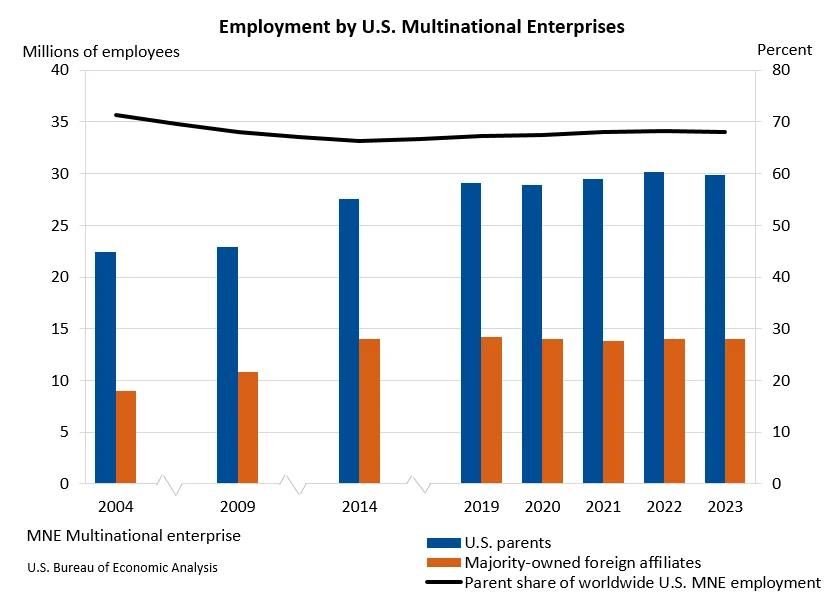
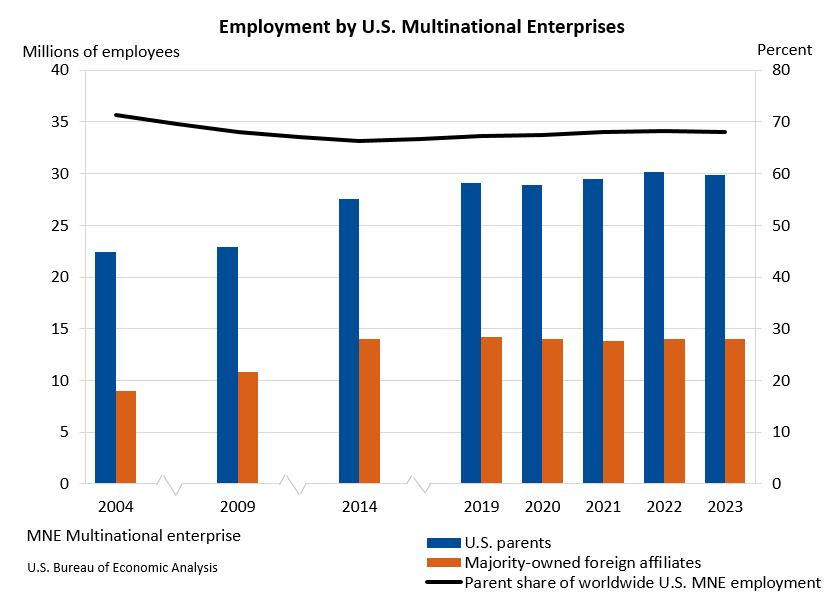
Worldwide employment by U.S. multinational enterprises (MNEs) experienced a marginal decrease of 0.4 percent in 2023, falling to 43.9 million workers from a revised 44.1 million in 2022. This slight contraction, detailed in preliminary statistics released by the U.S. Bureau of Economic Analysis (BEA), offers a snapshot of the complex operational and financial dynamics of American parent companies and their vast global networks of foreign affiliates. The figures underscore a period of nuanced adjustments within the international business landscape, with shifts observed in both domestic and overseas employment figures.
The BEA’s report, drawing from comprehensive data on the operations and finances of U.S. parent companies and their foreign affiliates, indicates that while the overall global workforce tied to U.S. MNEs saw a minor dip, the distribution of employment between the United States and foreign countries exhibited distinct trends. This divergence suggests a recalibration of operational strategies by these influential global players.
Domestic Employment Declines, Foreign Affiliate Workforce Edges Upward
A key observation from the BEA data is the decline in employment within the United States by U.S. parent companies. This figure saw a more pronounced decrease of 0.8 percent, bringing the total to 29.9 million workers in 2023. Despite this contraction, U.S. parents still constituted a significant majority of worldwide employment by U.S. MNEs, accounting for 68.1 percent of the total workforce. This represents a slight reduction from 68.3 percent in 2022, signaling a marginal shift in the balance of employment towards international operations.
Conversely, employment abroad by foreign affiliates of U.S. MNEs demonstrated a modest increase. These operations saw a 0.2 percent rise, reaching 14.0 million workers. This growth means that foreign affiliates now account for 31.9 percent of the total global employment generated by U.S. MNEs, an uptick from the previous year. This trend suggests a strategic international expansion or a consolidation of operations in foreign markets by U.S. corporations.
Sectoral Distribution and Key Geographic Hubs
The impact of these employment shifts is also visible in their proportion of the broader U.S. private industry. U.S. parents accounted for 21.9 percent of total private industry employment in the United States in 2023, a slight decrease from 22.5 percent in 2022. This indicates that while still a substantial employer, the relative contribution of U.S. MNEs to domestic private sector jobs has seen a minor erosion.
The primary sectors where U.S. parent companies maintain their largest employment footprints within the U.S. are manufacturing, "other industries" (significantly bolstered by transportation and warehousing), and retail trade. These sectors continue to be the bedrock of domestic job creation for these enterprises.
On the international front, the BEA data highlights the principal destinations for employment by U.S. MNEs’ majority-owned foreign affiliates. India, Mexico, and the United Kingdom emerged as the top countries for overseas employment. This concentration points to the strategic importance of these regions for U.S. multinational operations, likely driven by factors such as market access, labor costs, and established supply chains.
Economic Output and Investment Trends
Beyond employment figures, the BEA report also sheds light on the economic contributions and investment activities of U.S. MNEs. The worldwide current-dollar value added by these enterprises, a key measure of their economic contribution, saw a decrease of 0.6 percent, totaling $6.9 trillion.
Within this global figure, the value added by U.S. parents, representing their direct contribution to the U.S. gross domestic product (GDP), declined by 1.0 percent to $5.3 trillion. This contributed to a reduction in their share of total U.S. private-industry value added, falling from 23.1 percent in 2022 to 21.4 percent in 2023. This indicates a relative slowdown in the domestic economic output generated by these parent companies.
In contrast, the value added by majority-owned foreign affiliates experienced an increase of 0.8 percent, reaching $1.6 trillion. This growth in foreign affiliate value added signifies a strengthening economic contribution from their international operations. The leading countries for value added by these foreign affiliates were the United Kingdom, Canada, and Ireland, underscoring their significance as economic powerhouses within the global network of U.S. MNEs.
Capital Expenditures and Research & Development Investment
The data also reveals significant investment trends. Worldwide expenditures for property, plant, and equipment (capital expenditures) by U.S. MNEs saw a notable increase of 7.5 percent, reaching $1.1 trillion. This substantial investment indicates a commitment to expanding operational capacity and infrastructure. U.S. parents accounted for the lion’s share of these expenditures, with $886.1 billion, while majority-owned foreign affiliates contributed $216.2 billion. This suggests that while global expansion is occurring, a significant portion of capital investment remains rooted in domestic operations.
Furthermore, worldwide research and development (R&D) expenditures by U.S. MNEs also experienced a robust increase of 7.5 percent, amounting to $558.3 billion. This surge in R&D investment underscores a strong focus on innovation and future growth strategies. U.S. parents were the primary drivers of this R&D spending, accounting for $476.6 billion, while foreign affiliates contributed $81.7 billion. This substantial domestic R&D investment highlights the continued emphasis on technological advancement and product development within the United States by these multinational giants.
Context and Historical Perspective
The release of these 2023 preliminary statistics follows a pattern of comprehensive data collection and revision by the BEA. The Bureau of Economic Analysis has been meticulously tracking the activities of U.S. MNEs for decades, providing crucial insights into the global reach and economic impact of American businesses. This latest report builds upon previous releases, including the revised statistics for 2022, which were published in September 2024 in the Survey of Current Business. These revisions incorporate newly available and updated source data, ensuring the accuracy and reliability of the economic picture painted.

The trend of slight employment contraction globally, coupled with a decline in domestic employment and an increase in foreign affiliate employment, can be viewed against a backdrop of evolving global economic conditions. Factors such as geopolitical shifts, fluctuating currency exchange rates, global supply chain realignments, and varying levels of economic growth across different regions likely contribute to these adjustments. The period leading up to and including 2023 has been marked by significant economic uncertainties, including persistent inflation, rising interest rates, and ongoing international trade tensions, all of which can influence corporate decision-making regarding workforce allocation and investment.
Analysis of Implications and Future Outlook
The slight decrease in worldwide employment by U.S. MNEs, while marginal, warrants attention. It could signify a period of optimization and efficiency drives within these global organizations, potentially driven by a desire to control costs or adapt to changing market demands. The differential performance between domestic and foreign employment—a decline at home and a slight rise abroad—suggests a strategic reallocation of resources. Companies may be responding to opportunities for growth in emerging markets or seeking to leverage comparative advantages in specific foreign locations.
The sustained high levels of capital expenditure and R&D investment by U.S. parents, however, signal a strong underlying confidence in future growth and innovation within the United States. This indicates that despite shifts in employment distribution, the core of these enterprises’ strategic development and long-term investment remains firmly anchored in their home country. The robust R&D spending, in particular, is a predictor of future technological advancements and competitive advantages for U.S. industries.
The data also underscores the interconnectedness of the global economy. The leading countries for foreign affiliate employment and value added—India, Mexico, the UK, Canada, and Ireland—are significant trading partners and investment destinations for the United States. Their economic health and regulatory environments directly impact the performance and strategies of U.S. MNEs.
The BEA’s commitment to providing detailed data, including industry-specific and country-specific breakdowns, is invaluable for policymakers, economists, and business leaders. This granular information allows for a more nuanced understanding of global business trends and their potential impact on domestic economic policy, international trade relations, and global labor markets.
Looking ahead, the next release of U.S. MNE statistics, covering activities in 2024, is anticipated in November 2026. This future data will provide a crucial update on whether the trends observed in 2023 represent a temporary adjustment or the beginning of a more sustained shift in the global operational landscape of U.S. multinational enterprises. The ongoing analysis of these comprehensive statistics will remain critical for navigating the complexities of the modern globalized economy.
The BEA also noted that certain data tables previously released with the news bulletin have been discontinued as of August 22, 2025. This includes statistics on foreign affiliates with 50 percent or less U.S. ownership and supplemental industry statistics. While these specific tables are no longer part of the immediate news release, the underlying data can still be accessed through BEA’s Data Archive and Interactive Data Application, ensuring continuity of historical data for researchers and the public. This archiving process reflects the evolving nature of data dissemination and the BEA’s efforts to streamline its reporting while maintaining accessibility to historical information.








