

 Lana Rhoades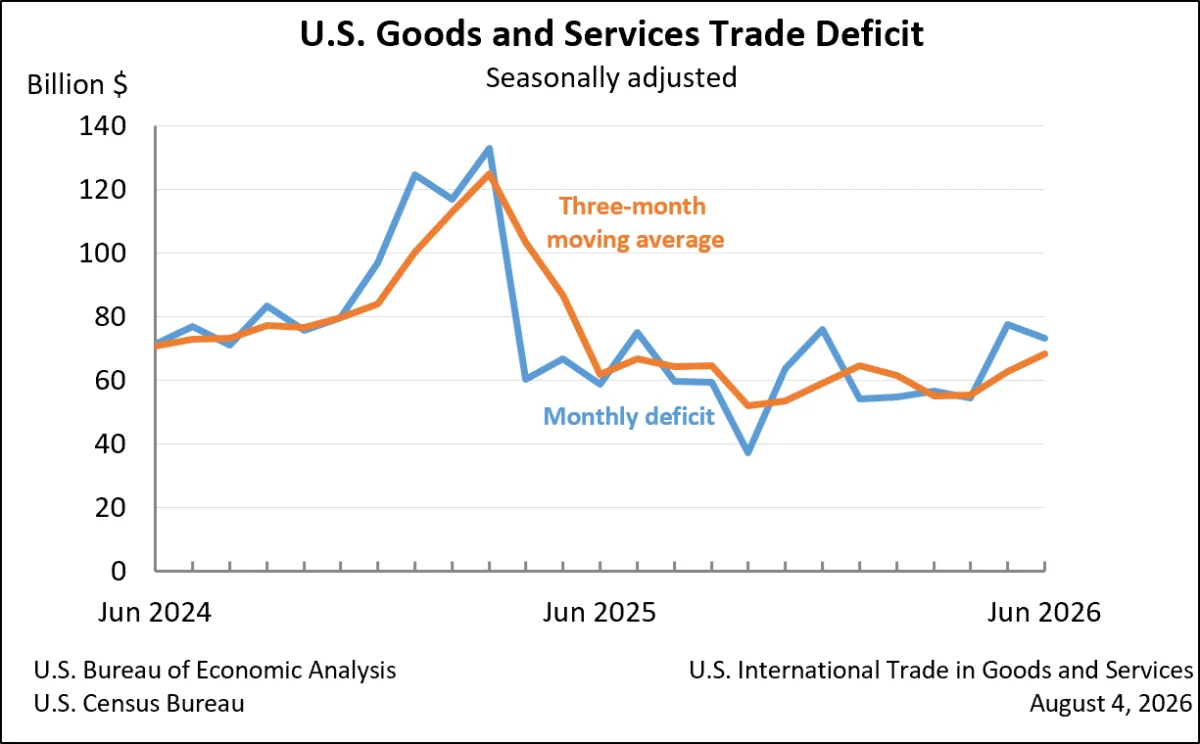
The United States recorded a goods and services deficit of $73.3 billion in June, a decrease of $4.4 billion from the revised $77.6 billion deficit in May, according to joint data released today by the U.S. Census Bureau and the U.S. Bureau of Economic Analysis. This reduction in the trade imbalance was primarily driven by a significant contraction in both export and import values for the month.
Key Figures and Trends
In June, U.S. exports of goods and services totaled $314.7 billion, marking a decline of $2.9 billion from the previous month. Simultaneously, imports of goods and services also decreased, falling by $7.3 billion to $388.0 billion. This simultaneous contraction in both trade flows resulted in the narrowing of the overall deficit.
The decrease in the goods and services deficit was a result of two offsetting movements: a reduction in the goods deficit and an increase in the services surplus. The deficit in goods narrowed by $3.9 billion to $102.1 billion, while the surplus in services grew by $0.5 billion to $28.8 billion.
Looking at the year-to-date figures, the cumulative goods and services deficit has seen a substantial reduction. For the first six months of the year, the deficit decreased by $189.3 billion, or 33.8 percent, compared to the same period in 2025. This significant improvement is attributed to a robust increase in exports, which rose by $198.3 billion, or 11.7 percent. In contrast, imports saw a more modest increase of $9.0 billion, or 0.4 percent, over the same period.
Snapshot of June Trade Data:
- Goods and Services Deficit: $73.3 billion (down 5.6% from May)
- Exports: $314.7 billion (down 0.9% from May)
- Imports: $388.0 billion (down 1.8% from May)
Deeper Dive into Trade Components
Goods Trade Performance
The decrease in the overall goods and services deficit was significantly influenced by the performance of goods trade. In June, exports of goods declined by $4.0 billion to $206.9 billion. This figure comprises a $3.8 billion decrease in exports of goods on a Census basis and a $0.2 billion decrease in net balance of payments adjustments.
Imports of goods also experienced a notable contraction, falling by $7.9 billion to $309.0 billion. Similar to exports, this includes a $7.7 billion decrease in imports of goods on a Census basis and a $0.2 billion reduction in net balance of payments adjustments.
The real goods deficit, adjusted for inflation and measured in 2017 dollars on a Census basis, saw a more pronounced decrease of $5.3 billion, or 5.3 percent, in June. This indicates that the volume of goods imported declined more significantly than the nominal value, outpacing the decrease in the nominal deficit by 3.7 percent.
Services Trade Resilience
In contrast to the goods sector, the services sector continued to demonstrate strength, contributing to the overall narrowing of the deficit. Exports of services increased by $1.1 billion to $107.8 billion in June. Imports of services also saw a modest rise, increasing by $0.6 billion to $79.0 billion. This growth in services trade, particularly on the export side, helped to partially offset the widening deficit in goods.
Trends and Context
Monthly Fluctuations vs. Broader Trends
While the June figures indicate a narrowing of the deficit, it is crucial to consider them within a broader economic context. The month-to-month fluctuations in trade data can be influenced by various factors, including seasonal adjustments, inventory cycles, and temporary supply chain disruptions or resolutions.
The data released today is seasonally adjusted, meaning it attempts to account for predictable patterns throughout the year. However, the accompanying note on statistical significance highlights that "statistical significance is not applicable or not measurable," suggesting that these monthly movements may not always represent sustained shifts in underlying trade dynamics.
Three-Month Moving Averages
To gain a clearer perspective on underlying trends, analysts often examine three-month moving averages. For the three months ending in June, the average goods and services deficit increased by $5.6 billion to $68.5 billion. This suggests that, despite the improvement in June, the average deficit over the recent quarter was higher than in preceding periods.
Furthermore, when comparing year-over-year data for three-month periods, the average goods and services deficit increased by $6.6 billion for the three months ending in June 2026 compared to the same period in 2025. This indicates a potential upward trend in the trade deficit when viewed over a slightly longer horizon, even with the positive June number.
Year-to-Date Performance: A Tale of Two Halves
The year-to-date data provides a more optimistic outlook. The substantial decrease in the deficit and the significant growth in exports suggest that U.S. businesses have been increasingly competitive in global markets. The disparity between export growth and import growth year-to-date points to a potential shift in the balance of trade, with exports playing a more dominant role in driving economic activity. This could be attributed to factors such as strong global demand for U.S. products and services, or perhaps a moderation in U.S. consumer demand for imported goods.
Country-Specific Trade Balances
The report also provides a breakdown of goods trade balances with specific countries and areas on a Census basis for June. This data offers insights into the bilateral trade relationships that contribute to the overall U.S. trade picture.
Key Surplus Trading Partners:
The U.S. recorded notable trade surpluses in goods with:
- Netherlands ($7.2 billion)
- South and Central America ($5.6 billion)
- Hong Kong ($3.2 billion)
- Switzerland ($2.9 billion)
- United Kingdom ($2.2 billion)
- Singapore ($1.8 billion)
- Saudi Arabia ($1.8 billion)
- Brazil ($1.7 billion)
- Australia ($1.3 billion)
- Belgium ($0.9 billion)
These surpluses indicate that the value of U.S. goods exported to these regions exceeded the value of goods imported from them.
Key Deficit Trading Partners:
Conversely, significant deficits in goods trade were recorded with:
- Vietnam ($21.6 billion)
- Mexico ($20.3 billion)
- China ($15.3 billion)
- Taiwan ($14.9 billion)
- European Union ($10.9 billion)
- South Korea ($7.4 billion)
- Canada ($7.2 billion)
- Germany ($7.1 billion)
- India ($4.5 billion)
- Malaysia ($4.4 billion)
- Japan ($3.3 billion)
- Ireland ($2.7 billion)
- Italy ($2.5 billion)
- France ($1.5 billion)
- Israel ($1.2 billion)
The persistent deficit with China, though narrower in June than in some previous periods, remains a significant component of the overall U.S. trade imbalance. Similarly, deficits with Mexico and Canada, major trading partners under the USMCA agreement, warrant continued attention.
Potential Economic Implications
The narrowing of the U.S. trade deficit in June, driven by both reduced exports and imports, presents a mixed economic signal. On one hand, a smaller deficit can be seen as positive, potentially contributing to a stronger balance of payments and reducing the reliance on foreign capital to finance the trade gap. The year-to-date figures, with robust export growth, could indicate increasing U.S. competitiveness and a potential boost to domestic industries.
However, the decline in both exports and imports in June raises questions about global economic demand and the health of U.S. domestic consumption. A reduction in imports could signal softening consumer spending or a decrease in business investment in imported capital goods. Simultaneously, a decrease in exports, even if it contributes to a smaller deficit, could indicate challenges faced by U.S. exporters in accessing global markets or a slowdown in the economies of key trading partners.
The increase in the three-month moving average deficit suggests that the June improvement might be a temporary anomaly rather than a sustained trend. Economic analysts will be closely watching the July data, due to be released on September 3, 2026, to determine if the narrowing of the deficit in June was a short-term adjustment or the beginning of a more significant shift.
The continued strength in services exports is a positive indicator, highlighting the growing importance of this sector to the U.S. economy. However, the persistent deficit in goods trade, particularly with major manufacturing economies, remains a structural challenge that policymakers and businesses continue to address.
Data Sources and Future Releases
The data presented in this report is based on the U.S. International Trade in Goods and Services, June 2026, released by the U.S. Census Bureau and the U.S. Bureau of Economic Analysis. All statistics are seasonally adjusted unless otherwise specified. Additional detailed data, including not seasonally adjusted statistics and specifics on goods on a Census basis, are available in exhibits 1-20b of the full release.
For more comprehensive information, definitions, and revision procedures, readers are directed to the explanatory notes within the full release, which can be accessed on the Census Bureau’s website at www.census.gov/foreign-trade/Press-Release/current_press_release/index.html or the Bureau of Economic Analysis website at www.bea.gov/data/intl-trade-investment/international-trade-goods-and-services.
The next release, covering U.S. International Trade in Goods and Services for July 2026, is scheduled for Thursday, September 3, 2026. This upcoming report will provide crucial insights into whether the trends observed in June continue or if the trade balance begins to shift in a different direction.








