

 Lana Rhoades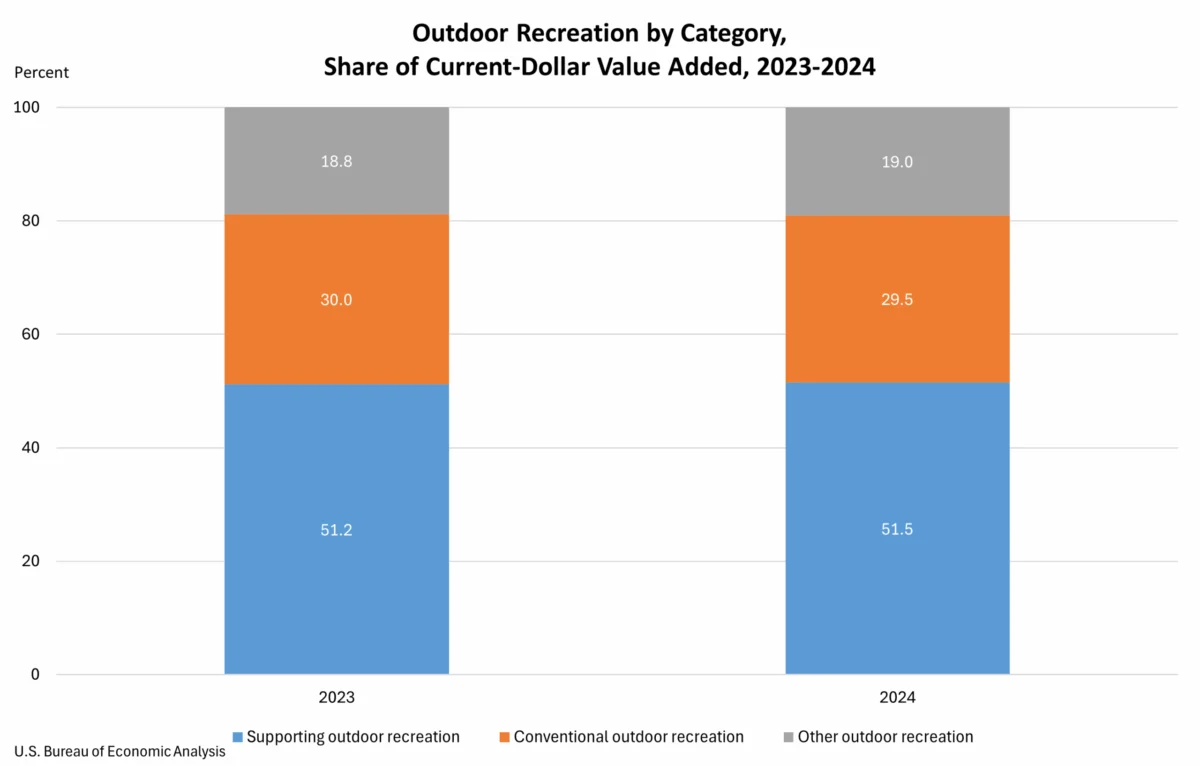
The U.S. Bureau of Economic Analysis (BEA) has released its latest comprehensive report detailing the economic impact of outdoor recreation across the nation, including state-by-state breakdowns and the District of Columbia. The findings for 2024 reveal that the outdoor recreation economy is a substantial and growing sector, accounting for a significant portion of the nation’s economic output and employment.
Key Findings: A Robust Economic Contributor
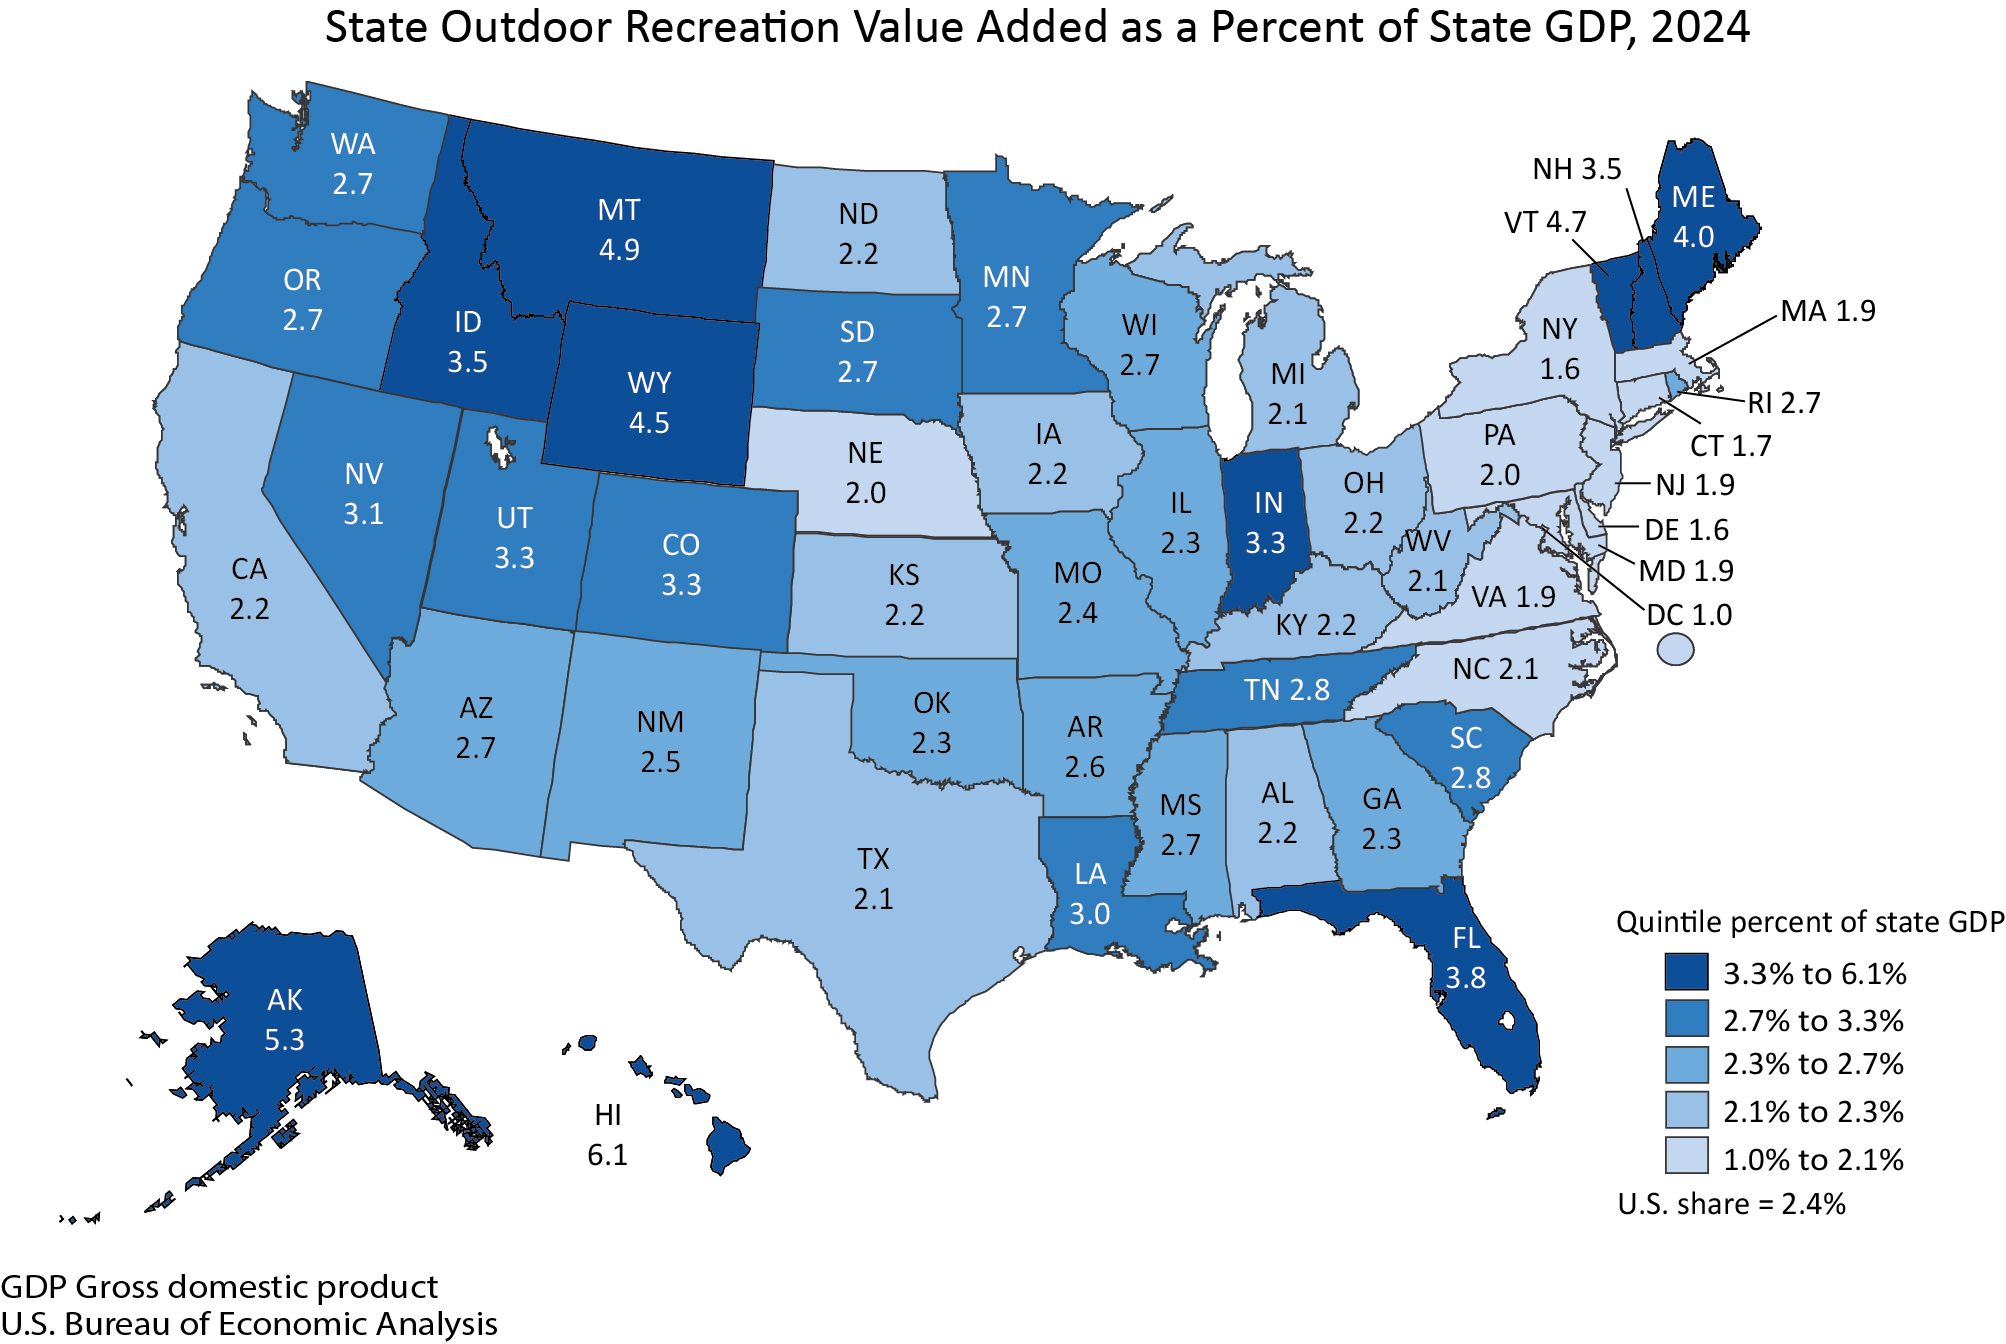
In 2024, the value added by the outdoor recreation economy represented a robust 2.4 percent of the current-dollar Gross Domestic Product (GDP) for the United States, translating to an impressive $696.7 billion. This figure underscores the sector’s considerable influence on the overall U.S. economy. When examining individual states and the District of Columbia, the proportion of state GDP attributed to outdoor recreation varied considerably. Hawaii emerged as the leader, with outdoor recreation contributing 6.1 percent to its state GDP, highlighting the islands’ deep connection to and reliance on outdoor activities. In contrast, the District of Columbia recorded the lowest share at 1.0 percent, reflecting its unique economic structure, which is less reliant on traditional outdoor pursuits.
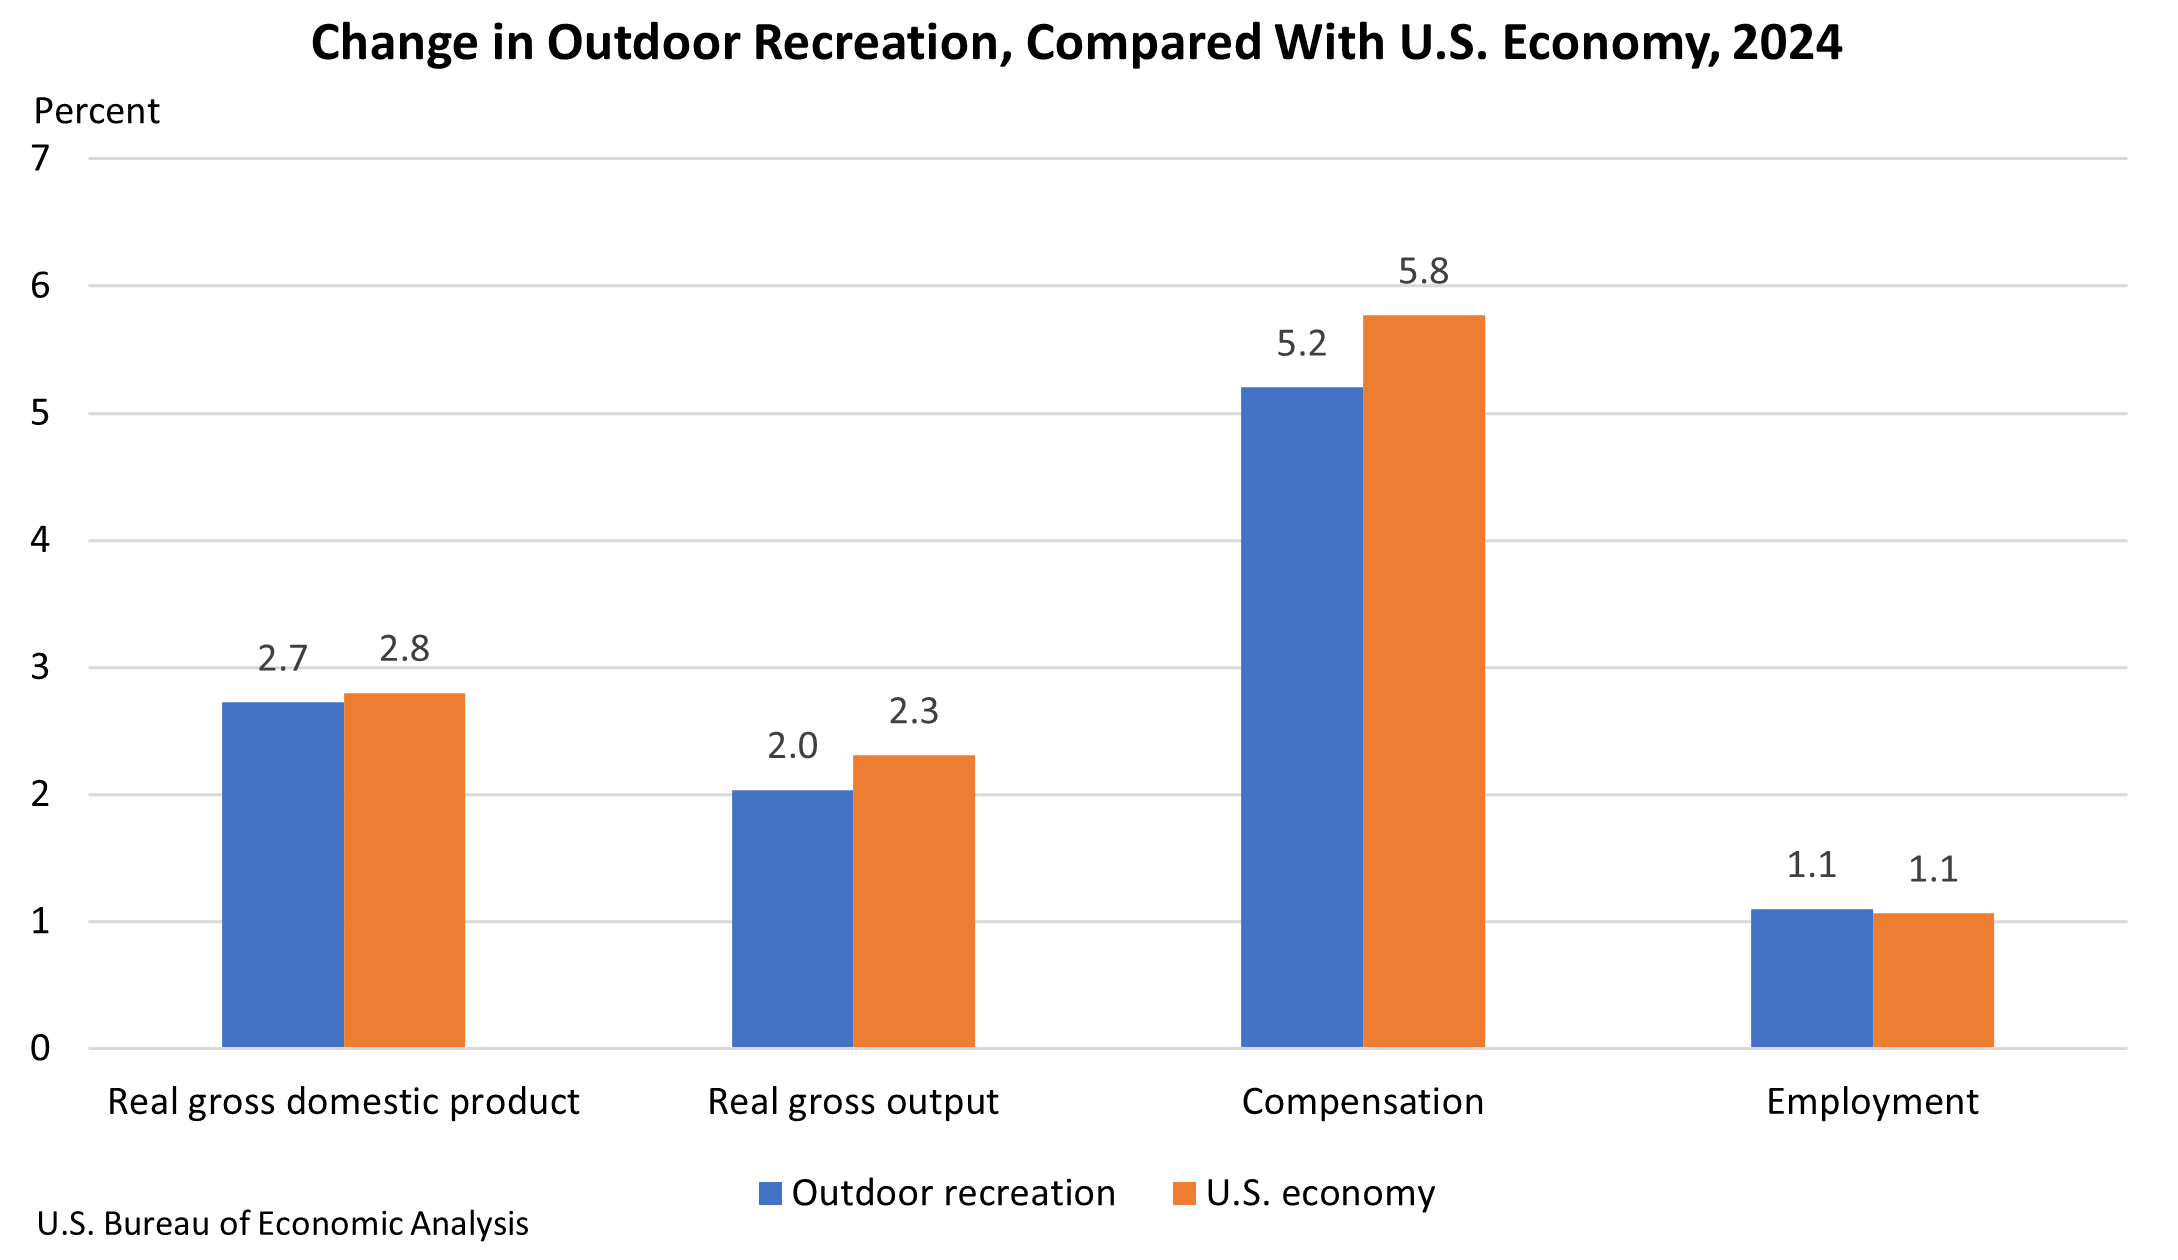
The report also sheds light on the growth trajectory of the outdoor recreation sector. Inflation-adjusted (real) GDP for outdoor recreation saw an increase of 2.7 percent in 2024. While this represents a slight deceleration from the remarkable 5.3 percent growth recorded in 2023, it still outpaced the overall U.S. economy’s growth of 2.8 percent for the same year. This sustained growth, even with a moderation, signals the resilience and continued expansion of outdoor recreation as a vital economic engine.
Further bolstering the economic narrative, real gross output for the outdoor recreation economy increased by 2.0 percent. Compensation within the sector experienced a healthy rise of 5.2 percent, and employment saw a positive uptick of 1.1 percent. These figures collectively paint a picture of a dynamic industry that not only generates substantial economic value but also provides livelihoods and opportunities for a growing workforce.
Employment Trends: A Mixed Landscape
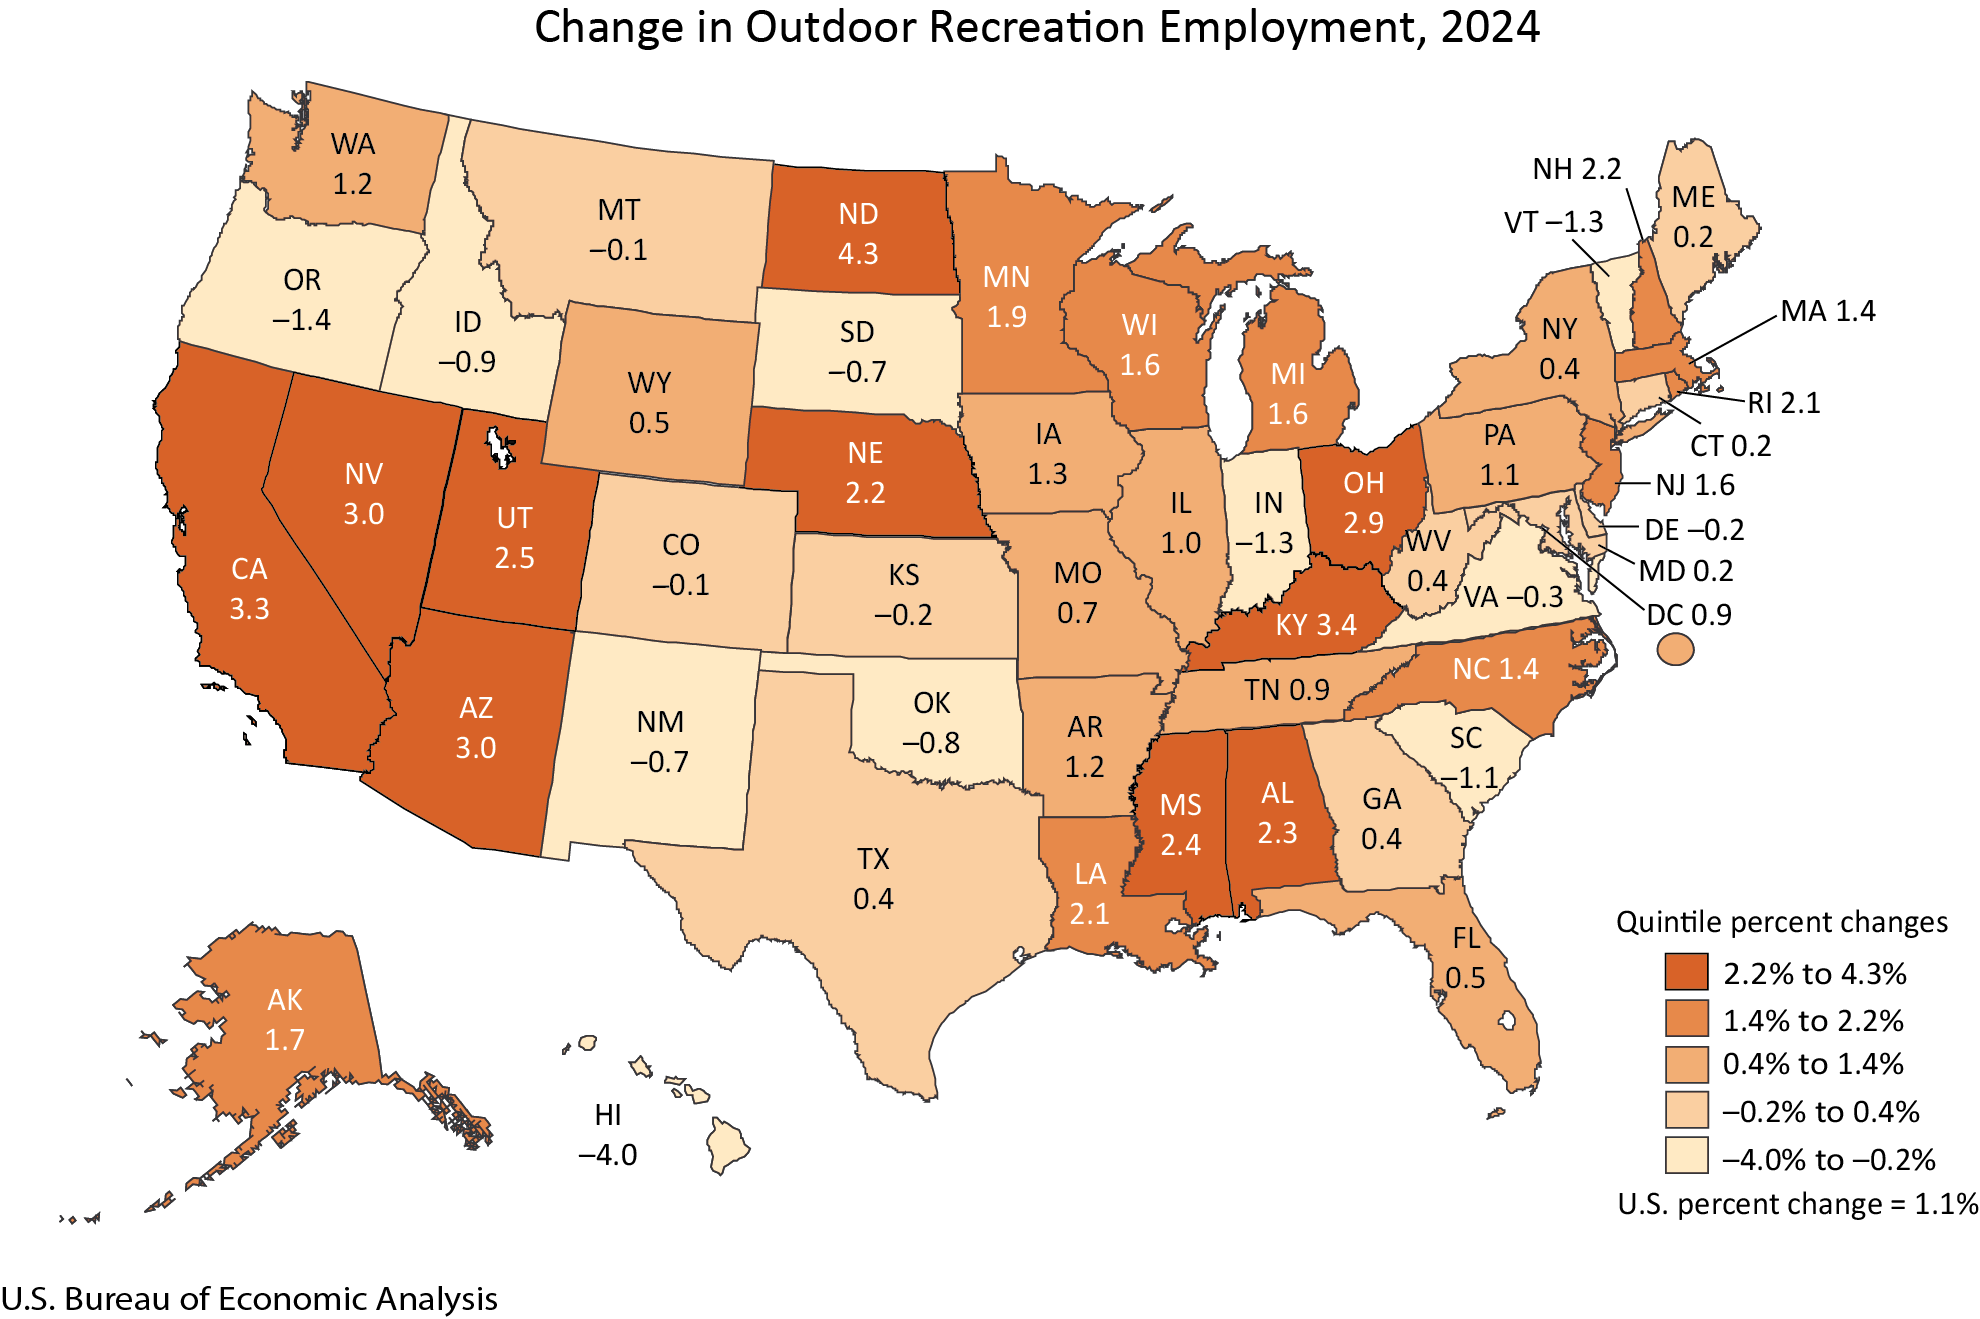
Examining employment trends reveals a more nuanced picture. Outdoor recreation employment saw an increase in 36 states and the District of Columbia in 2024, demonstrating widespread job creation across the country. The percentage change in outdoor recreation employment exhibited a broad range, with North Dakota leading the pack with a substantial 4.3 percent increase. This suggests a burgeoning demand for outdoor recreation services and related employment in certain regions.
Conversely, Hawaii experienced a decline of 4.0 percent in outdoor recreation employment. This figure, juxtaposed with Hawaii’s high contribution of outdoor recreation to its state GDP, warrants further investigation. It could indicate shifts in the types of jobs available, increased automation, or changes in the composition of outdoor recreation activities that are less labor-intensive. The BEA interactive tables provide a valuable resource for delving into these granular state-level employment dynamics.
Categorizing Outdoor Recreation: A Multifaceted Sector
The BEA categorizes outdoor recreation activities into three broad segments, providing a clearer understanding of the sector’s diverse components:
- Conventional Activities: This encompasses traditional outdoor pursuits such as bicycling, boating, hiking, hunting, fishing, camping, and other nature-based activities.
- Other Activities: This category includes a broader range of outdoor pursuits, such as gardening, outdoor concerts, festivals, and other recreational events that take place outdoors.
- Supporting Activities: This crucial segment includes industries that enable and facilitate outdoor recreation, such as construction of outdoor facilities, travel and tourism services (including transportation and accommodation), local trips, and government expenditures on public lands and infrastructure.
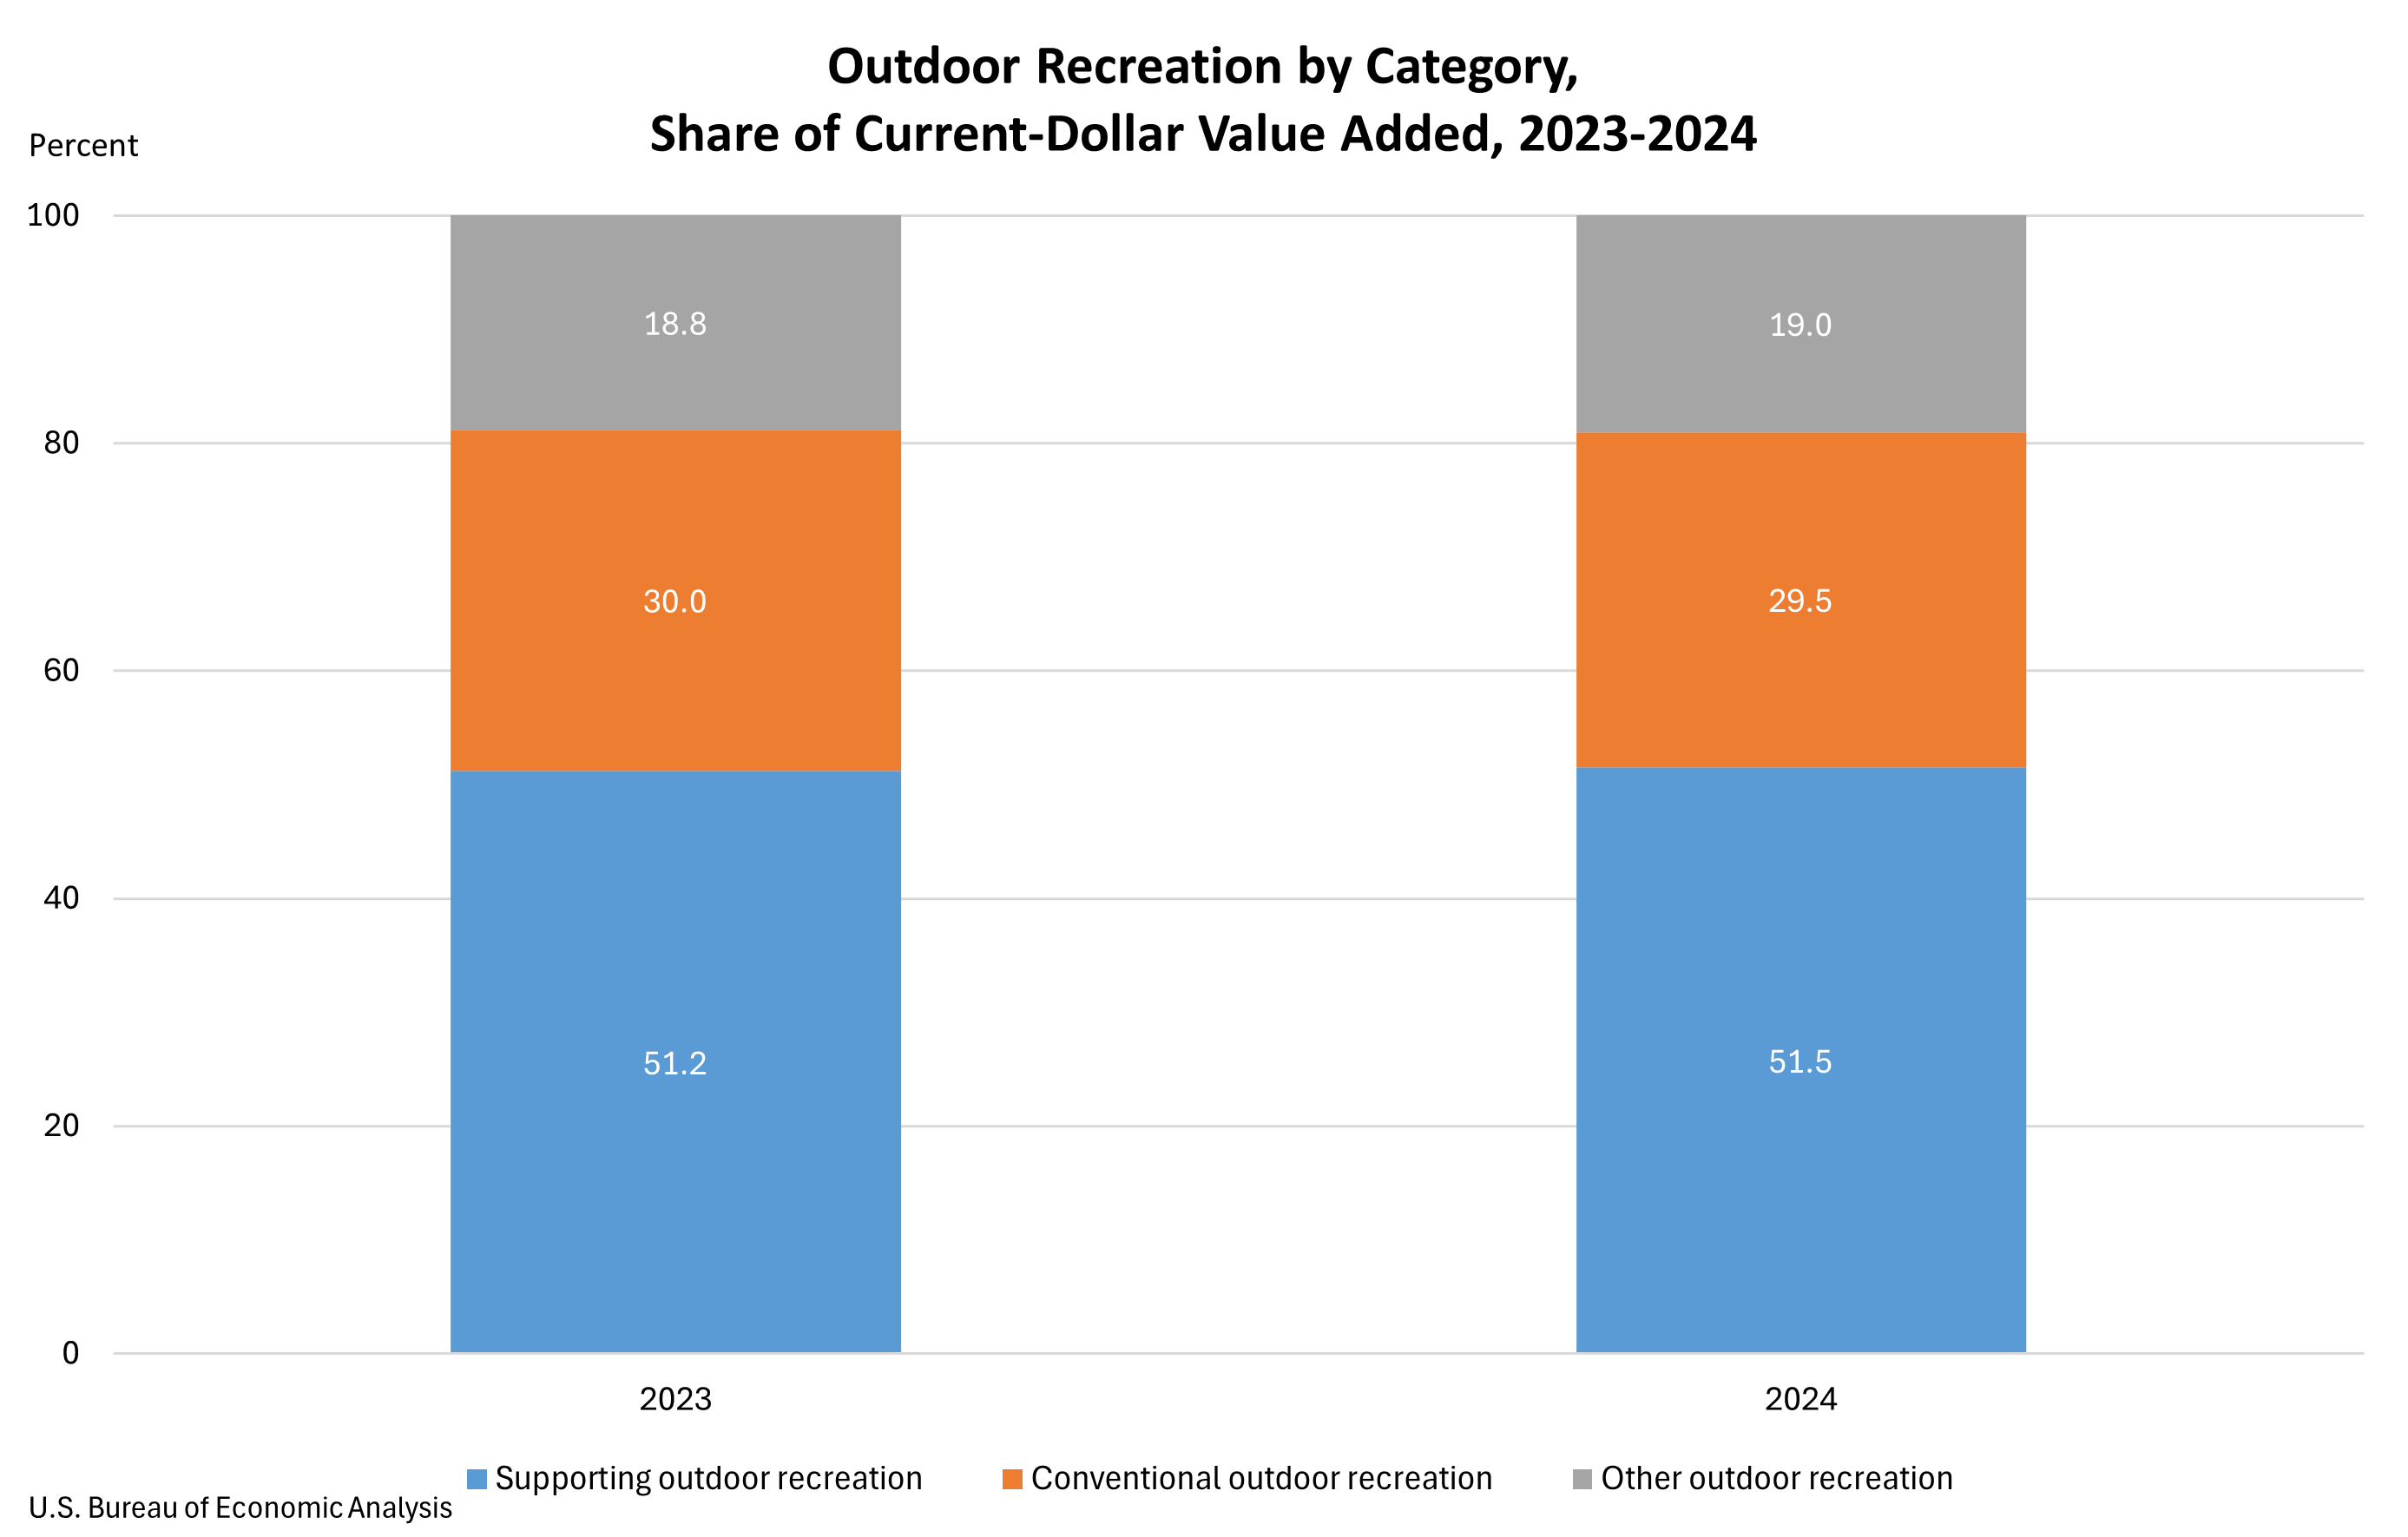
In 2024, conventional outdoor recreation accounted for 29.5 percent of the U.S. outdoor recreation value added, a slight decrease from 30.0 percent in 2023. "Other outdoor recreation" saw a marginal increase, representing 19.0 percent of value added in 2024, up from 18.8 percent in 2023. The largest share, however, continues to be held by supporting activities, which accounted for 51.5 percent of value added in 2024, a slight increase from 51.2 percent in the previous year.
The growth in supporting activities was primarily driven by travel and tourism. This surge reflects increased consumer spending on transportation, hotels, and restaurants, indicating that a significant portion of the economic impact of outdoor recreation is derived from the infrastructure and services that enable people to access and enjoy these activities. This interdependency highlights the broader economic ripple effects of the outdoor recreation sector.
Industry Contributions: The Backbone of Outdoor Recreation
The BEA’s industry-level data reveals which sectors are most heavily invested in and contribute most significantly to the outdoor recreation economy.
Arts, Entertainment, Recreation, Accommodation, and Food Services: This industry group emerged as the largest contributor to U.S. outdoor recreation value added in 2024, accounting for a substantial $174.4 billion, or 25.0 percent of the total. This sector encompasses a wide array of businesses directly linked to leisure and hospitality, from amusement parks and recreational facilities to hotels, restaurants, and bars. At the state level, this industry group was the dominant force in 23 states and the District of Columbia. California ($24.1 billion), Florida ($22.7 billion), and New York ($11.8 billion) reported the largest contributions from this sector, underscoring their status as major tourist and recreational destinations.
Retail Trade: The second-largest industry group contributing to outdoor recreation value added nationally was retail trade, totaling $169.1 billion, or 24.3 percent of the total. This includes businesses selling outdoor equipment, apparel, sporting goods, and related merchandise. Retail trade proved to be the leading industry group in 24 states, demonstrating its widespread importance in supporting outdoor enthusiasts. California ($19.3 billion), Texas ($14.4 billion), and Florida ($13.4 billion) again showed significant contributions from this sector, reflecting large consumer markets and diverse outdoor opportunities.
Manufacturing: The manufacturing sector played a crucial role as the third-largest contributor, generating $91.3 billion, or 13.1 percent of outdoor recreation value added. This category includes the production of vehicles, boats, recreational equipment, and other goods used for outdoor activities. Manufacturing was the leading industry group in two states: Indiana and Louisiana. Texas ($13.1 billion), California ($11.6 billion), and Indiana ($9.1 billion) reported the largest dollar contributions from manufacturing, highlighting the importance of these states in the production of outdoor recreation goods.
Methodology and Data Updates: Ensuring Accuracy and Relevance
The BEA’s release of these statistics is part of an annual update process, incorporating the latest available data and refining previous estimates. The 2024 data now reflects the results of the 2025 annual update of the National Economic Accounts, which includes comprehensive revisions to the National Income and Product Accounts (NIPA) and the Industry Economic Accounts. This update integrates newly available and revised source data, ensuring the highest level of accuracy and consistency.
Similarly, the state-level statistics have been updated to reflect these national revisions, along with the 2025 annual update of the Regional Economic Accounts and newly available and revised regional source data. This meticulous approach to data collection and revision is critical for providing policymakers, businesses, and the public with reliable insights into the economic dynamics of the outdoor recreation sector. Previously published estimates are accessible through BEA’s Data Archive, allowing for historical trend analysis.
Implications and Future Outlook
The consistent growth and substantial economic contribution of the outdoor recreation sector, as detailed in the BEA’s latest report, carry significant implications.
- Economic Diversification and Resilience: For many states, outdoor recreation offers a pathway to economic diversification, reducing reliance on traditional industries and creating new avenues for growth. Its resilience, as demonstrated by continued expansion even amidst broader economic fluctuations, makes it a valuable sector for long-term economic stability.
- Policy and Investment Opportunities: The data provides a clear mandate for policymakers to recognize and support the outdoor recreation economy. Investments in public lands, infrastructure, and recreational facilities can yield significant economic returns, job creation, and improved quality of life for residents and visitors alike. Understanding which activities and industries are driving growth can help target investments effectively.
- Understanding Consumer Trends: The slight shift in the composition of outdoor recreation activities, with supporting activities like travel and tourism showing robust growth, indicates evolving consumer behaviors and preferences. This understanding is crucial for businesses operating within the sector to adapt their offerings and marketing strategies.
- Employment and Workforce Development: The growth in compensation and employment signals the increasing importance of the outdoor recreation workforce. This highlights the need for targeted workforce development programs to ensure a skilled labor pool to meet the sector’s demands.
The BEA’s commitment to providing annual updates ensures that these critical economic insights remain current and relevant. The next release of Outdoor Recreation Economic Statistics, covering 2025 data for the U.S. and states, is anticipated in the Fall of 2026, promising further illumination of this dynamic and increasingly vital sector of the American economy. The ongoing analysis of this sector is essential for understanding its evolving landscape and its enduring contribution to national prosperity and well-being.








