

 Lana Rhoades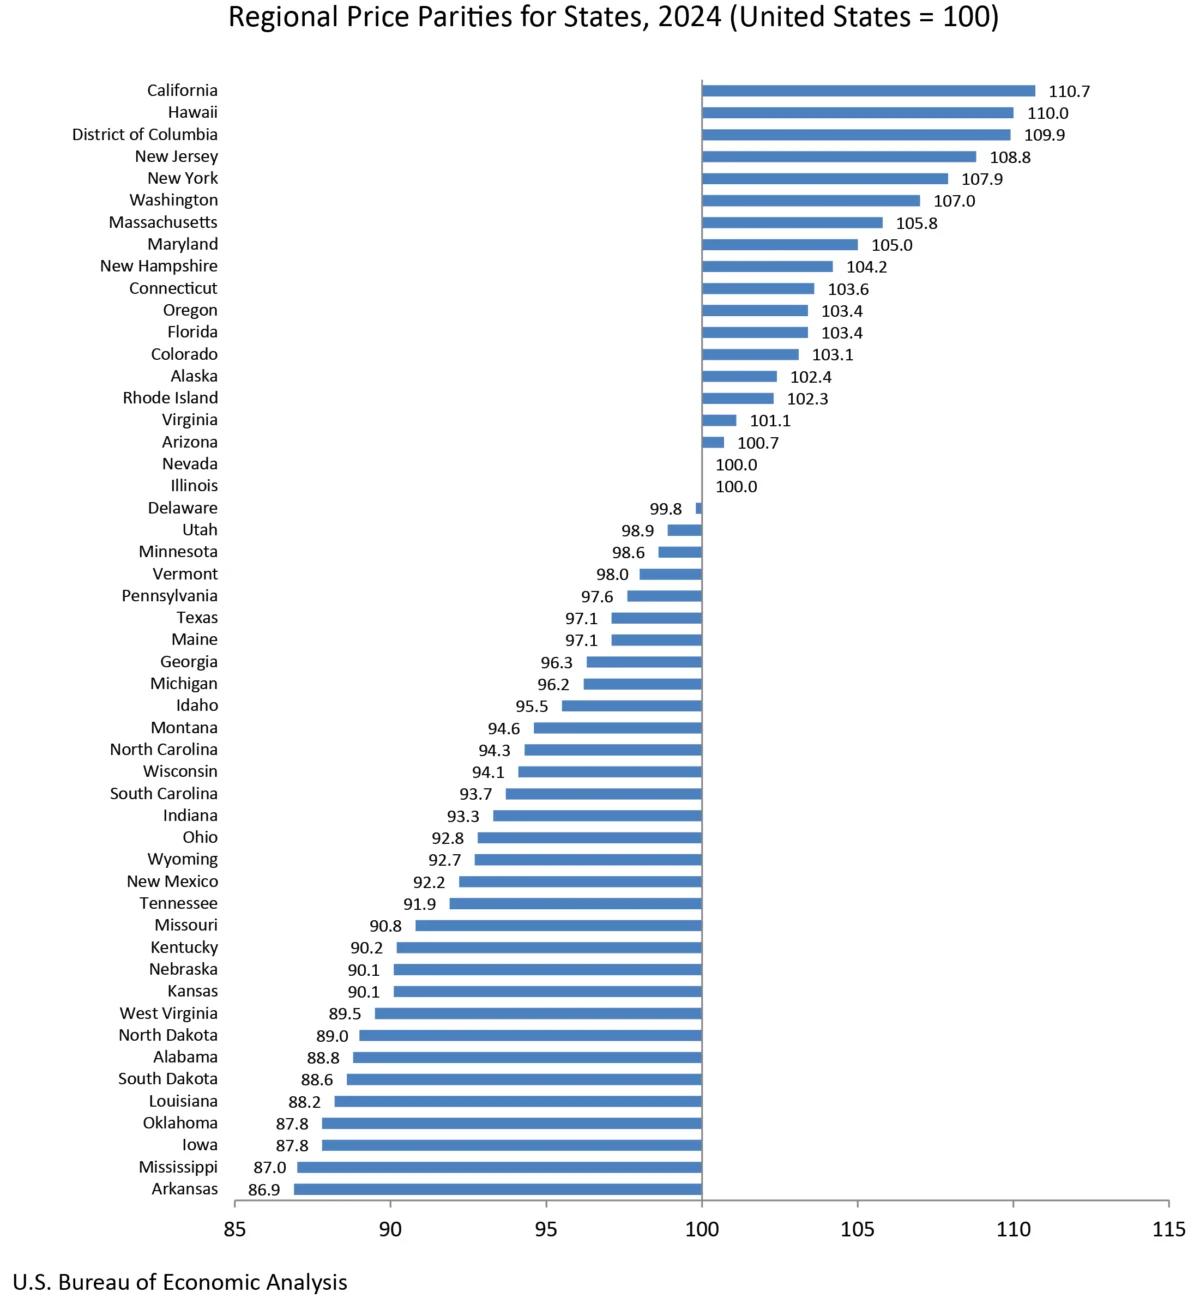
WASHINGTON D.C. – The U.S. Bureau of Economic Analysis (BEA) today unveiled its latest annual statistics, offering a granular view of economic activity across all 50 states and the District of Columbia for the year 2024. The comprehensive data release includes detailed figures on real personal consumption expenditures (PCE), real personal income, and regional price parities (RPPs), providing crucial insights into the diverse economic landscapes and consumer behaviors shaping the nation. This release also incorporates significant revisions to historical data from 2008 to 2023, reflecting a commitment to accuracy and the integration of the most up-to-date source information.
Real Personal Consumption Expenditures Show Broad Growth
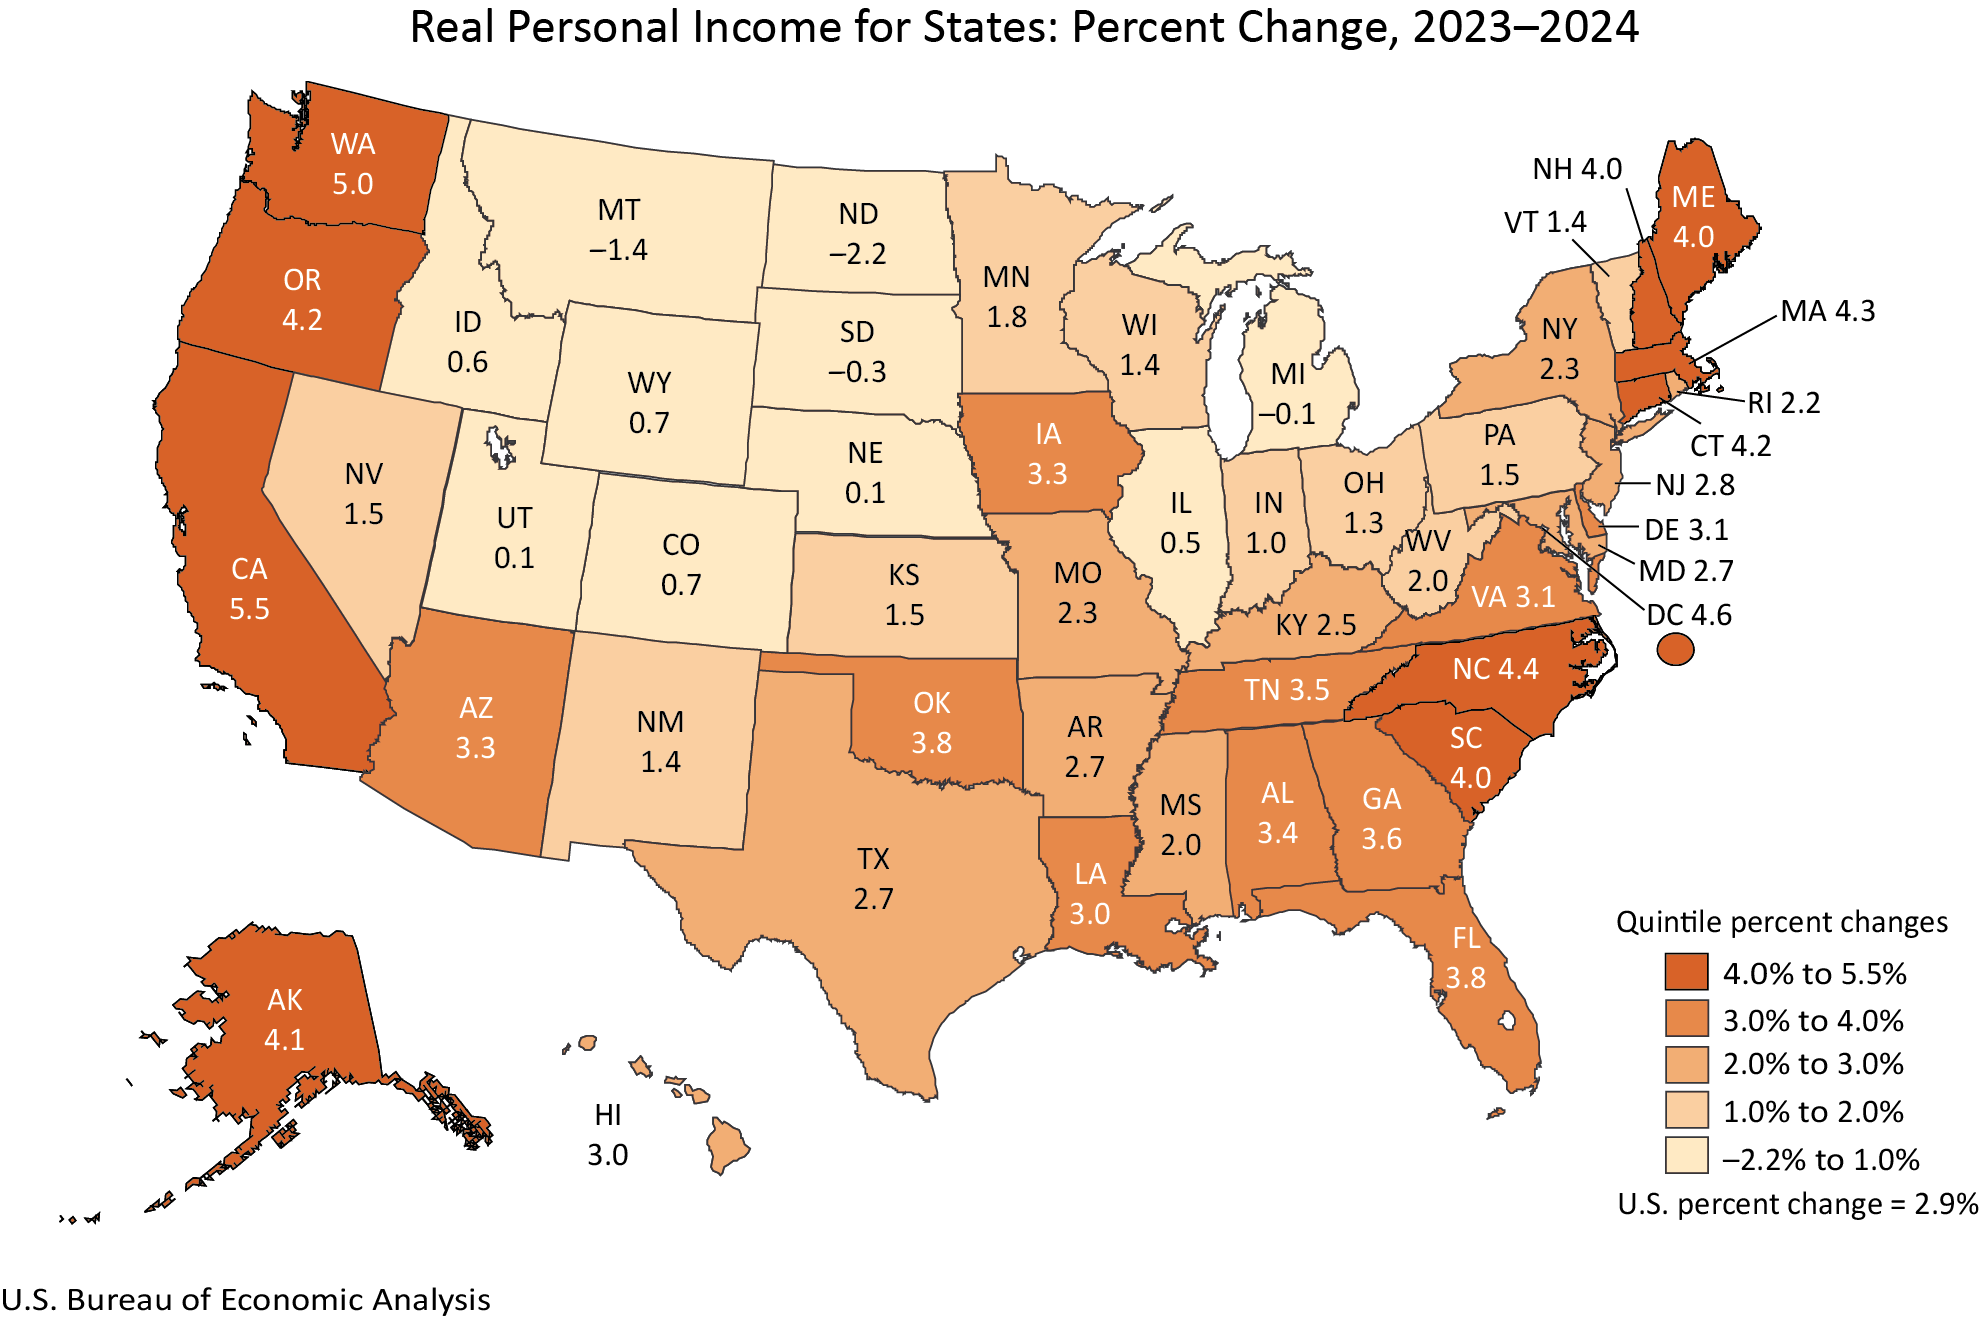
The newly released data indicates a robust trend in real personal consumption expenditures (PCE) across the nation, with 48 states and the District of Columbia experiencing an increase in 2024. This widespread growth in consumer spending, adjusted for inflation, suggests a generally positive economic environment for households.
The magnitude of this growth varied significantly, with Massachusetts leading the nation at a remarkable 5.3 percent increase in real PCE. This surge in consumer spending in Massachusetts can be attributed to several factors, including a strong performance in its key industries such as technology, biotechnology, and higher education, which often translate into higher disposable incomes and increased consumer confidence. Conversely, Montana experienced a slight contraction of -0.2 percent in real PCE, a figure that warrants further examination within the context of its specific economic drivers, which may include seasonal industries or localized economic challenges.
Nationally, real PCE saw a healthy increase of 2.9 percent in 2024. This figure is a vital indicator of consumer demand, a primary engine of economic growth. The BEA further elaborated that current-dollar PCE—reflecting nominal spending without inflation adjustment—rose by a more substantial 5.6 percent. This divergence between real and current-dollar PCE underscores the impact of inflation on the purchasing power of consumers. The national PCE price index, a key measure of inflation for consumer spending, stood at 2.6 percent for the year. The fact that current-dollar PCE outpaced the PCE price index indicates that, in aggregate, consumers were spending more in nominal terms than the rate at which prices were increasing, suggesting a net gain in real spending capacity for many.
The BEA’s methodology for calculating real PCE by state involves adjusting current-dollar estimates by the corresponding regional price parity (RPP) and the national PCE price index. RPPs are critical for understanding the true purchasing power of income and expenditures in different geographic areas, acknowledging that the cost of living varies considerably from one state to another.
Real Personal Income Experiences Widespread Gains
Complementing the robust consumer spending figures, real personal income also demonstrated broad-based growth in 2024. A significant majority of states, 46 in total, along with the District of Columbia, saw their real personal income increase. This indicates that, on average, individuals and households across the United States experienced an improvement in their inflation-adjusted earnings.
California stood out with the highest percentage increase in real personal income, a remarkable 5.5 percent. This strong performance can be linked to the state’s dynamic technology sector, robust venture capital activity, and a generally strong job market. In contrast, North Dakota recorded a decrease of -2.2 percent in real personal income. This decline may be influenced by factors specific to the state’s economy, such as fluctuations in commodity prices, particularly in the energy sector, or shifts in employment within its primary industries.
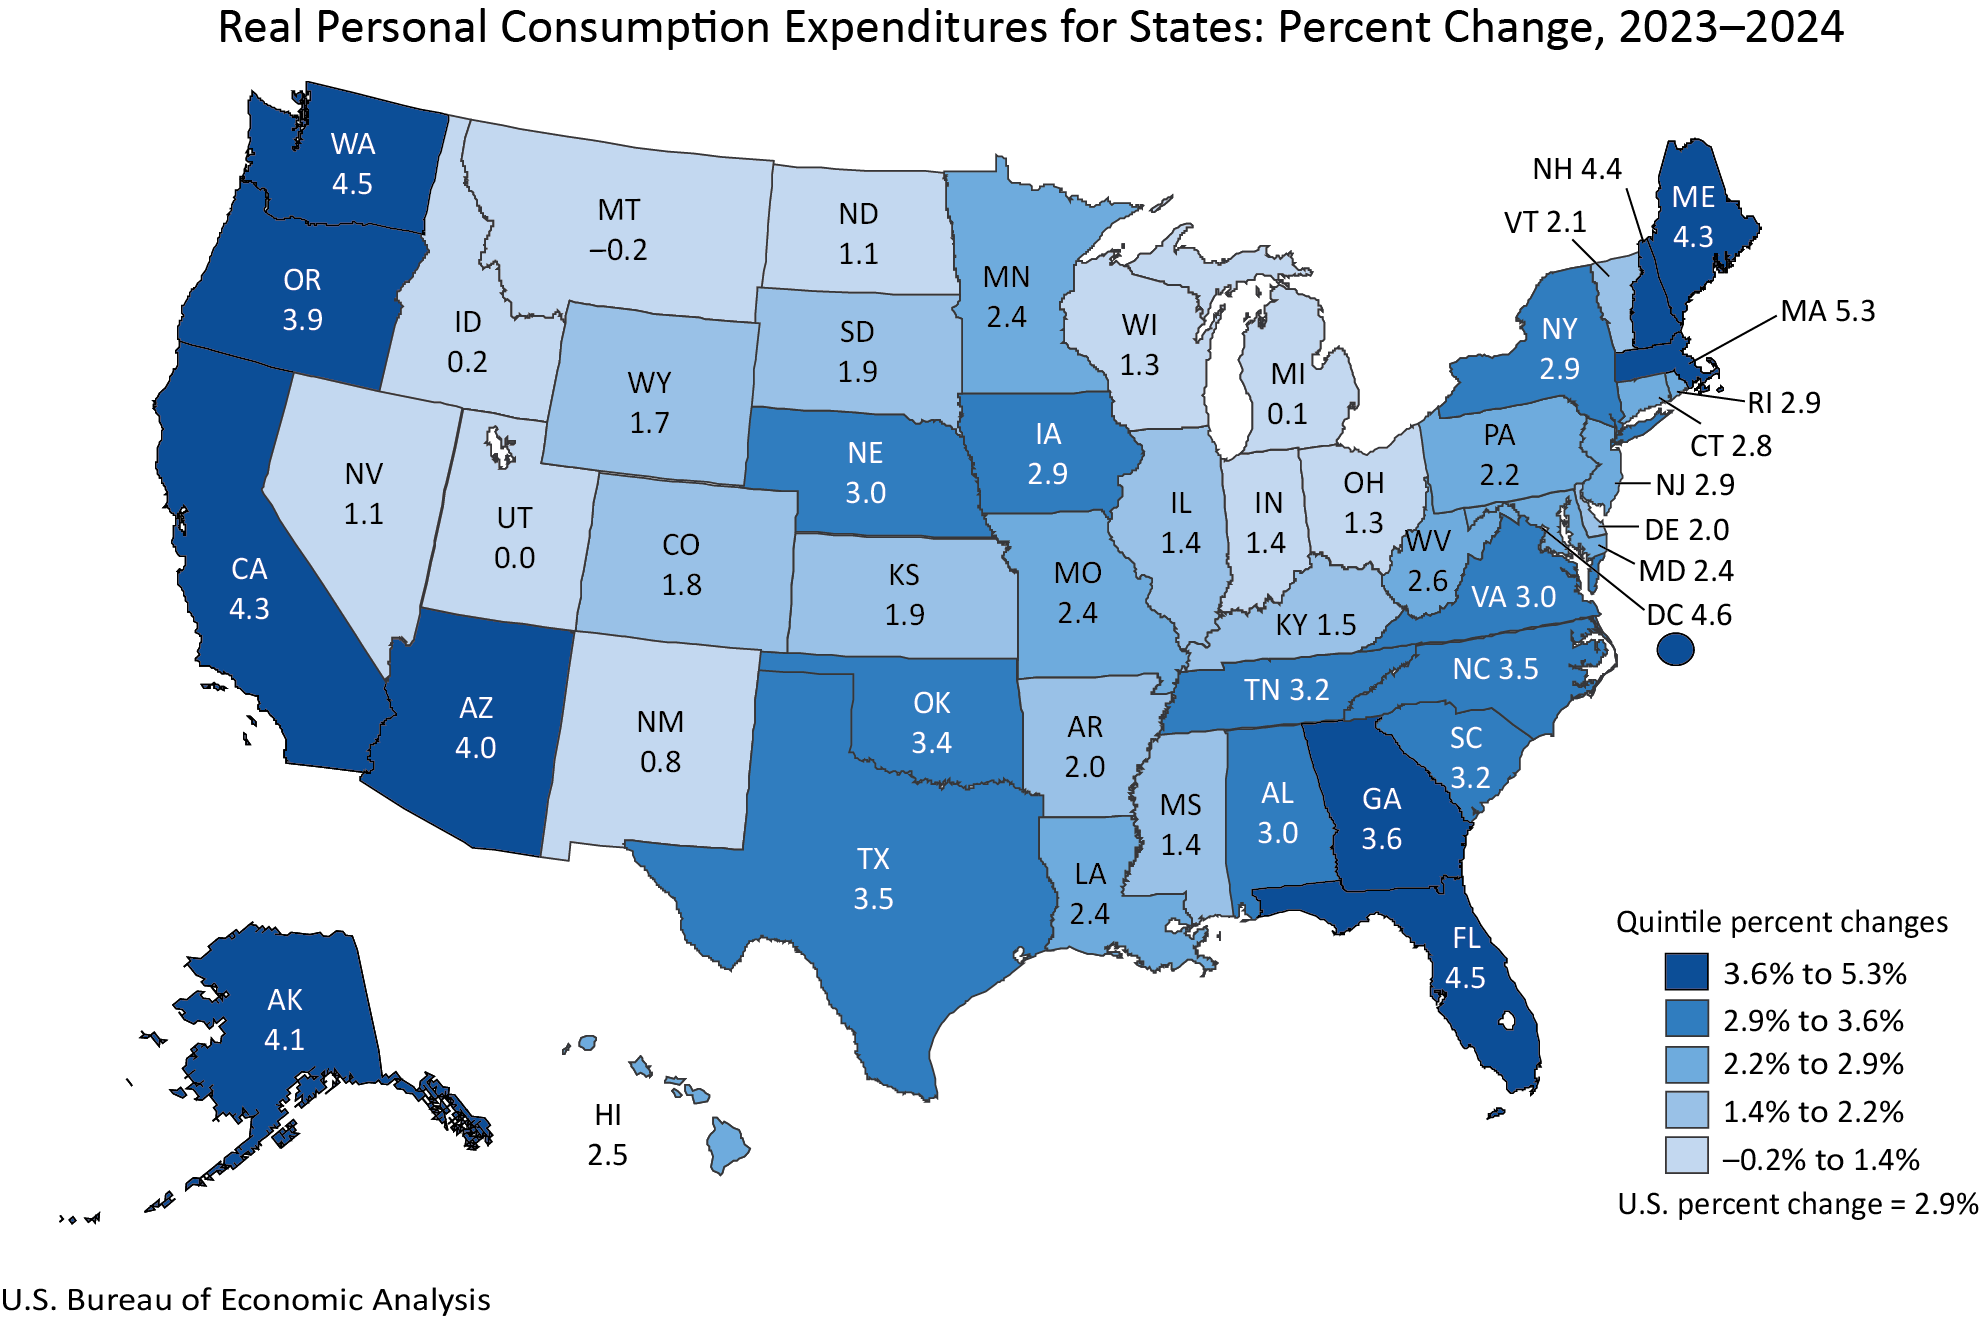
Similar to real PCE, the national increase in real personal income was 2.9 percent for 2024. Current-dollar personal income, however, saw a more significant rise of 5.6 percent. This again highlights the impact of inflation on nominal income figures. The BEA noted that current-dollar personal income grew at a faster pace than the national PCE price index, suggesting that, on average, real incomes kept pace with or slightly exceeded inflation for many Americans.
The calculation of real personal income by state follows a similar methodology to real PCE, employing current-dollar estimates adjusted by regional price parities and the national PCE price index. This ensures that the "real" income figures accurately reflect the purchasing power of income in each respective state.
Regional Price Parities Illuminate Cost of Living Variations
The release also provided updated figures for Regional Price Parities (RPPs), which are essential for understanding the varying cost of living across different states. RPPs measure the differences in price levels for a given basket of goods and services, expressed as a percentage of the national average.
The "all items RPP," which encompasses all consumption goods and services including housing rents, serves as a comprehensive measure of price disparities. The BEA highlighted that housing rents often play a significant role in driving differences in RPPs across states. States with higher housing costs, such as those in popular coastal metropolitan areas, typically exhibit higher RPPs, meaning that a dollar of income in these areas may purchase less than it would in a state with lower housing expenses. Conversely, states with more affordable housing markets tend to have lower RPPs.
While the article did not provide specific RPP index values for each state in 2024, it indicated that metropolitan area RPP statistics are available on the BEA website, offering a more localized perspective on price levels. These RPP figures are crucial for policymakers, businesses, and individuals alike, as they directly influence the real value of income, the cost of doing business, and the overall economic well-being of residents in different regions. For instance, understanding RPPs can help in assessing the true impact of wage increases or cost-of-living adjustments.
Revisions and Updates Reflect Enhanced Data Accuracy
A significant aspect of this release is the comprehensive revision of annual estimates for real PCE and real personal income by state, extending back to 2008. These revisions are a testament to the BEA’s ongoing efforts to incorporate more complete and detailed source data as it becomes available. This process ensures that the statistical record accurately reflects economic activity and aligns with major national economic updates, such as the annual revisions of the National Income and Product Accounts (NIPA) and GDP by industry statistics.
The BEA also introduced new estimates of real per capita PCE and real per capita personal income for 2024. These per capita figures are derived using population data from the U.S. Census Bureau, providing an important measure of the average economic output and income available to each individual resident. The inclusion of data from 2020 through 2024 for per capita estimates offers a contemporary view of economic well-being on an individual level, particularly relevant in light of demographic shifts and economic changes during this period.
Discontinuation of Metropolitan Area Data
In a notable shift in data dissemination, the BEA announced the discontinuation of publishing statistics for metropolitan statistical areas (MSAs) and their metropolitan and nonmetropolitan portions for real PCE and real personal income, starting with the 2024 data. While estimates will continue to be provided at the state level, the granular data for MSAs will no longer be part of the standard release. RPPs, however, will continue to be published for both state and local areas. This decision, according to the BEA, is aimed at streamlining data presentation and focusing resources on the most comprehensive state-level analyses, while still allowing for detailed price level comparisons at a sub-state level through RPPs. A dedicated FAQ on the BEA website provides further details on this change.
Evolution in Data Presentation
Accompanying these statistical updates is a change in the presentation format of the data. Tables previously embedded within news releases are now exclusively available through the BEA’s online Interactive Data Application. This move is intended to reduce duplication, enhance efficiency, and provide users with direct access to more flexible and complete data tables. The interactive application allows for customization, full time-series analysis, and easy downloading of data in various formats, including PDF, Excel, and CSV. This digital-first approach aligns with modern data accessibility trends and empowers users to conduct deeper, more personalized analyses.
Broader Implications for Economic Analysis and Policy
The release of these detailed state-level economic statistics by the BEA is of paramount importance for a wide range of stakeholders. For economists and researchers, the data provides a rich foundation for understanding regional economic trends, identifying drivers of growth and decline, and formulating economic models. Policymakers at federal, state, and local levels can leverage these figures to inform decisions on taxation, infrastructure investment, economic development initiatives, and social programs. Businesses can use the data to assess market potential, optimize resource allocation, and understand consumer behavior in different regions.
The distinction between real and nominal figures, coupled with the RPP data, offers a nuanced perspective on economic well-being. A state may show high nominal income growth, but if inflation and the cost of living are also exceptionally high, the actual improvement in residents’ quality of life might be less pronounced. Conversely, states with lower nominal growth but significantly lower costs of living might offer a better real economic outcome for their residents.
The comprehensive revisions to historical data also signify the dynamic nature of economic measurement. As new information emerges and methodologies are refined, statistical agencies continuously update their records to provide the most accurate historical context possible. This commitment to data integrity is fundamental to building reliable economic narratives and making informed projections.
The discontinuation of metropolitan-level data for PCE and personal income, while potentially a point of adjustment for some data users, aligns with a broader trend toward platform-based data access. The BEA’s interactive tools are designed to offer sophisticated querying and data manipulation capabilities, which can, in many cases, replicate or exceed the functionality of static tables, especially when dealing with complex regional data.
Looking ahead, the BEA has scheduled its next release of real personal consumption expenditures and real personal income by state for December 10, 2026, which will include the 2025 data. This regular cadence of releases ensures that stakeholders have timely access to crucial economic indicators, enabling them to track evolving economic conditions and adapt their strategies accordingly. The historical data featured in this release will be accessible in BEA’s Data Archive following the next update, preserving a valuable record for long-term economic research.








