

 Lana Rhoades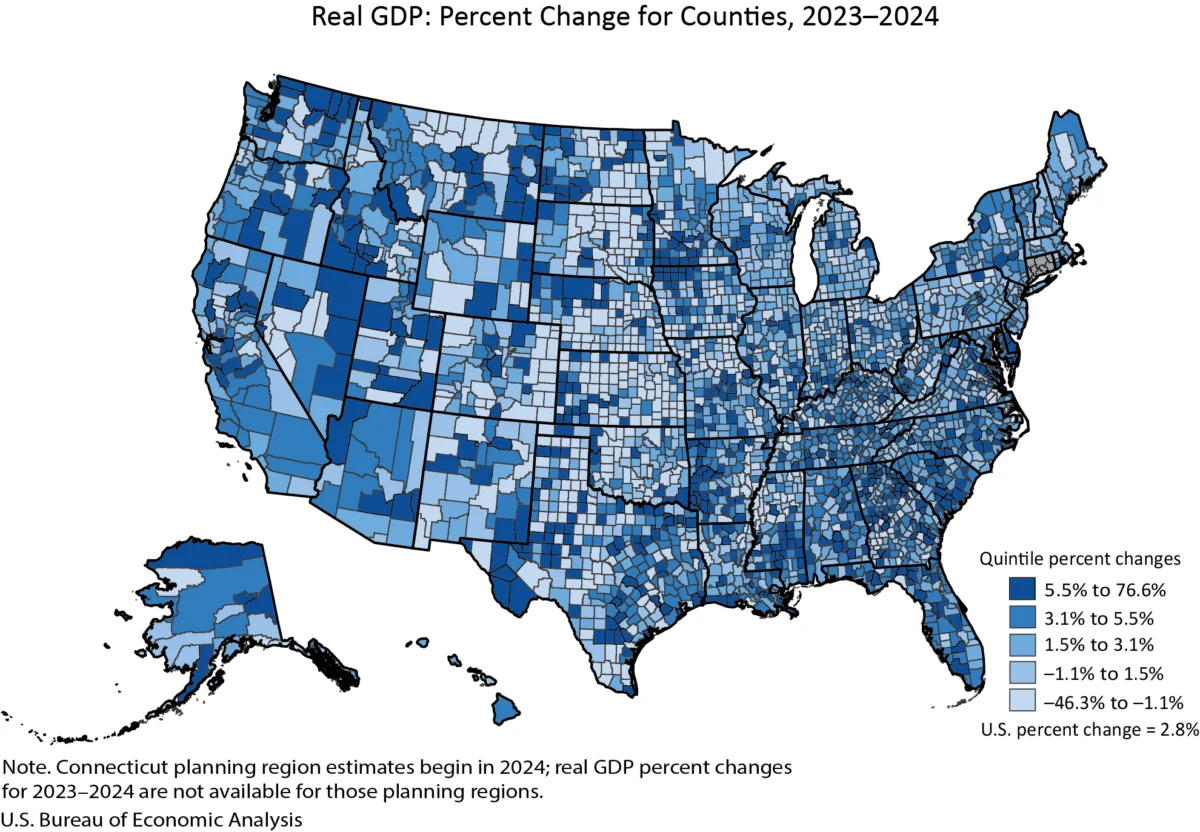
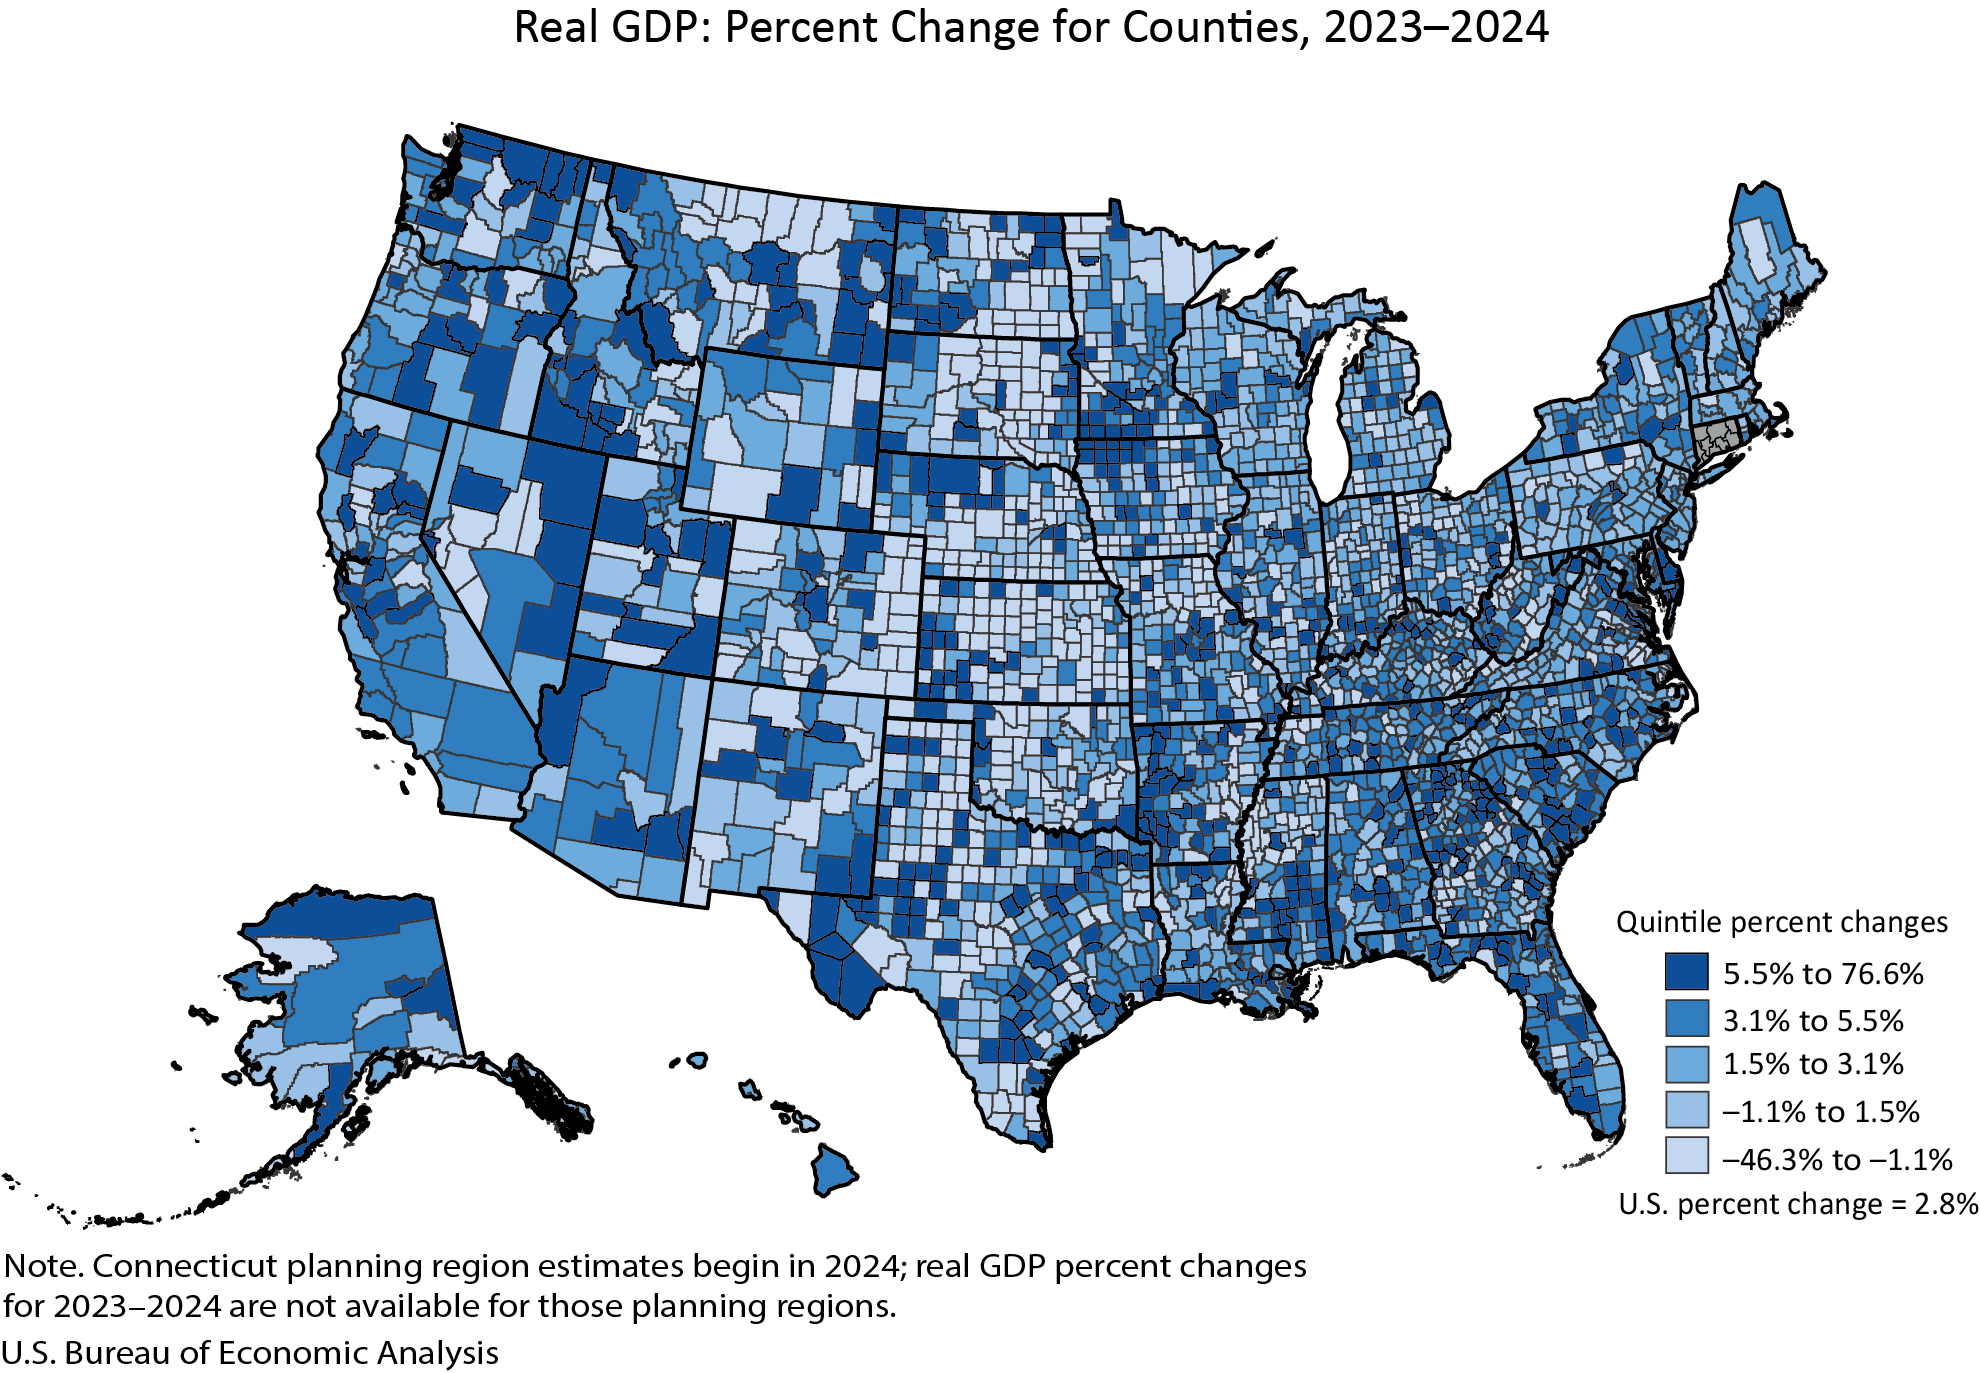
The U.S. Bureau of Economic Analysis (BEA) released its comprehensive 2024 estimates today, revealing a dynamic and varied economic landscape across American counties. Real gross domestic product (GDP) experienced growth in a significant majority of counties, with 2,273 reporting increases, while 809 counties saw declines, and 24 remained unchanged. This granular look at economic performance underscores the diverse trajectories of local economies, from booming hubs to those facing contraction. The starkest contrast in GDP growth was observed between Carter County, Montana, which surged by an impressive 76.6 percent, and Baca County, Colorado, which experienced a substantial decline of 46.3 percent.
This latest data from the BEA, a cornerstone agency for economic statistics, provides a crucial snapshot of the nation’s economic health at its most localized level. The annual release of county-level GDP and personal income data is a critical tool for policymakers, business leaders, researchers, and the public to understand regional economic trends, identify areas of opportunity and challenge, and inform decision-making. The 2024 estimates are particularly significant as they incorporate revised historical data from 2020 to 2023, reflecting a more complete picture of economic activity during and in the wake of the COVID-19 pandemic. These revisions align with broader national and state-level economic updates released in September 2025, ensuring consistency and accuracy in the aggregate economic narrative.
Economic Performance: A Tale of Two Extremes
The BEA’s findings paint a picture of a national economy characterized by both robust expansion and localized contractions. The 2,273 counties that reported an increase in real GDP represent a strong upward trend, indicating that a substantial portion of the country’s economic engines were firing on all cylinders in 2024. This widespread growth suggests a favorable business environment, increased consumer spending, or significant investment in many regions.
Conversely, the 809 counties experiencing a decrease in real GDP highlight areas where economic headwinds may be present. These declines could be attributed to a variety of factors, including industry-specific downturns, outmigration of businesses, reduced consumer demand, or the lingering effects of global economic uncertainties. The fact that 24 counties saw no appreciable change in their real GDP suggests economic stability, but potentially a lack of significant growth drivers in those areas.
The extreme ends of the GDP performance spectrum offer compelling case studies. Carter County, Montana, with its remarkable 76.6 percent GDP increase, likely experienced a significant boost from a specific industry, such as energy extraction, agriculture, or a large-scale development project. Such dramatic growth, while exceptional, points to the potential for concentrated economic activity to disproportionately impact local economies. On the other hand, Baca County, Colorado’s 46.3 percent decline, suggests a severe economic contraction, possibly linked to the decline of a key industry, natural disaster impacts, or a significant loss of population or business activity. Understanding the specific drivers behind these extreme cases is crucial for developing targeted economic development strategies.
County Economies: A Spectrum of Scale
Beyond growth rates, the sheer size of county economies, as measured by real GDP, reveals a vast disparity across the United States. In 2024, New York County, New York (Manhattan), stood as the largest economic powerhouse, with a real GDP of $813.7 billion. This figure dwarfs the economic output of smaller counties, such as Issaquena County, Mississippi, which recorded a real GDP of just $15.7 million. This vast difference underscores the concentration of economic activity in major metropolitan areas and the often-limited economic scale of rural or less populated counties.
The BEA’s data, presented in interactive tables accessible via links within the release, allows for deep dives into these economic magnitudes. For instance, the summary tables for GDP by county provide both percentage changes and absolute levels in "Thousands of Chained 2017 Dollars." This consistent methodology ensures that comparisons are made on a like-for-like basis, accounting for inflation and providing a reliable measure of real economic output. The ability to access these detailed datasets empowers users to conduct their own analyses and explore the economic nuances of specific regions.
Personal Income Trends: A Broader Picture of Well-being
Complementing the GDP figures, the BEA’s release also details trends in personal income, a key indicator of household economic well-being. In 2024, personal income saw an increase in an even larger majority of counties, with 2,768 reporting growth, while 331 experienced a decrease, and 7 remained unchanged. This suggests that while overall economic production (GDP) might face localized challenges, the income received by individuals was more broadly on the rise.
The range of personal income growth was also notable, though generally less extreme than GDP fluctuations. Harding County, South Dakota, led the nation with a 22.6 percent increase in personal income. Conversely, Issaquena County, Mississippi, which also experienced a GDP decline, saw its personal income fall by 23.3 percent. This divergence between GDP and personal income in some counties can be attributed to various factors, including the composition of economic activity (e.g., reliance on non-wage income, significant corporate profits not distributed locally), changes in labor force participation, or the impact of transfer payments.
The total level of personal income also varies dramatically by county. Los Angeles County, California, reported the highest total personal income at $818.5 billion, reflecting its status as a major economic and population center. At the other end of the spectrum, Loving County, Texas, had the lowest personal income at $10.6 million. These figures highlight the significant disparities in household economic resources across the country, with implications for consumer spending, tax revenues, and overall quality of life.
County Economic Performance by Population Size
The BEA’s analysis also breaks down economic trends by county population size, offering further insights into how different types of communities are faring.
Large Counties (Population > 500,000):
In 2024, 145 large counties experienced GDP growth, with none reporting a decline, and one remaining unchanged. This indicates a strong and consistent economic performance in the nation’s most populous areas. The range of GDP growth in these counties was from 10.7 percent in Pinal County, Arizona, to 0.0 percent in Johnson County, Kansas. This suggests that major urban centers and their surrounding areas are generally robust economic engines, benefiting from diverse industries, skilled workforces, and significant consumer markets. The size range in these counties is vast, with New York County, NY, at $813.7 billion and Pinal County, AZ, at $12.7 billion, illustrating the economic scale of these large population centers.
Medium Counties (Population 100,000 to 500,000):
These counties showed a more mixed, but still largely positive, economic picture. 451 medium counties saw GDP growth, 20 experienced declines, and 3 remained unchanged. The trend range here was from a 12.4 percent increase in Jefferson County, Texas, to a 2.6 percent decline in Black Hawk County, Iowa. This segment of counties often represents regional hubs that serve surrounding smaller communities, and their economic performance can be influenced by both local factors and the economic health of nearby larger metropolitan areas. The economic scale in this category ranged from $46.6 billion in Mercer County, NJ, to $2.6 billion in Liberty County, TX.
Small Counties (Population < 100,000):
This category, comprising the vast majority of U.S. counties, exhibited the widest range of economic performance. 1,677 small counties experienced GDP growth, while 789 saw declines, and 20 remained unchanged. The most extreme GDP fluctuations were observed here: a 76.6 percent increase in Carter County, Montana, and a 46.3 percent decline in Baca County, Colorado. This highlights the vulnerability of smaller economies to specific industry shocks or the loss of a major employer. However, it also shows the potential for significant localized growth when specific opportunities arise. The economic scale in small counties ranged from $15.1 billion in Martin County, TX, to $15.7 million in Issaquena County, MS.
Similar patterns emerge when examining personal income by population size, reinforcing the notion that larger population centers generally exhibit more stable and robust economic indicators, while smaller counties can experience greater volatility.
Revisions and Methodological Shifts
The 2024 estimates are not just a new data point; they represent a significant update and refinement of economic accounting. The BEA has revised historical data for county-level GDP and personal income from 2020 to 2023. This process of revision is standard practice in economic statistics, aiming to incorporate more complete and accurate source data as it becomes available. These revisions ensure that the BEA’s statistics remain the most reliable reflection of economic reality.
A notable change for 2024 is the integration of GDP and personal income by county into a single, combined news release. This move, according to the BEA, aims to provide a "fuller picture of the economies of all counties" and replaces two separate releases previously issued on different days. This consolidation streamlines the reporting process and offers a more holistic view of local economic conditions in one accessible document.
Furthermore, the BEA has discontinued the publication of statistics for metropolitan statistical areas, micropolitan statistical areas, and related geographic designations. This decision means that economic data will now be exclusively available at the county level. The BEA cites the county-level data as being more granular and comprehensive, allowing users to construct their own aggregations of interest. This shift emphasizes the importance of the county as the primary unit of analysis for regional economic reporting.
A significant methodological shift is occurring in Connecticut, where for the 2024 estimates, the state’s planning region geographic definitions will replace traditional county definitions. This change is due to Connecticut’s organizational structure and the availability of data at the planning region level. Because these planning region estimates are only available for 2024, they are not included in the percent change ranges in the current news release, highlighting a specific regional adaptation.
Data Accessibility and Future Releases
In a move to enhance data accessibility and user experience, the BEA has transitioned the presentation of detailed tables. Instead of embedding tables directly within the news release, these data are now available through the BEA’s online Interactive Data Application. This platform allows users to customize tables, access full time series, and download data in various formats (PDF, Excel, CSV). This approach aims to reduce duplication, increase efficiency, and direct users to the most comprehensive and flexible data resources available.
The release also highlights the BEA’s ongoing commitment to providing timely and relevant economic information. New estimates of per capita personal income for 2024 have also been released, calculated using U.S. Census Bureau population figures for the years 2020 through 2024.
The next release of county-level GDP and personal income statistics is scheduled for December 2, 2026, at 8:30 a.m. EST, which will cover the 2025 data. This forward-looking schedule allows stakeholders to anticipate future economic reporting and plan accordingly. The BEA also notes that current 2024 data will be superseded by the 2025 release, and historical data will be archived for future access.
Broader Implications and Expert Analysis
The detailed county-level data released by the BEA offers significant implications for various stakeholders. For policymakers, it provides the granular insights needed to design targeted economic development programs, allocate resources effectively, and address regional disparities. For businesses, understanding local economic trends can inform investment decisions, site selection, and market analysis. For researchers, these data are invaluable for studying regional economic dynamics, labor market trends, and the impact of various economic policies.
Dr. Evelyn Reed, a senior economist specializing in regional economics, commented on the release: "The BEA’s county-level data is the bedrock of understanding how economic forces play out on the ground. The significant divergence in GDP growth between counties like Carter, MT, and Baca, CO, highlights the localized nature of economic shocks and opportunities. While national trends can offer a broad overview, it’s at the county level where the real impact on communities and individuals is felt."
She further elaborated, "The increased growth in personal income across a larger number of counties compared to GDP growth suggests a potential for increased household purchasing power, which can be a positive indicator for consumer-driven sectors. However, the disparities in income levels, from Los Angeles County to Loving County, TX, underscore the persistent challenges of economic inequality and the need for policies that promote inclusive growth."
The BEA’s decision to consolidate its county-level releases and shift to an interactive data platform reflects a modern approach to data dissemination, prioritizing flexibility and user-driven exploration. While the discontinuation of metropolitan area statistics may require users to adapt their analytical frameworks, the continued availability of granular county data ensures that detailed regional economic analysis remains possible. The BEA’s commitment to regular updates and revisions reinforces the reliability and importance of these statistics in navigating the complex and ever-evolving American economic landscape.








