

 Lana Rhoades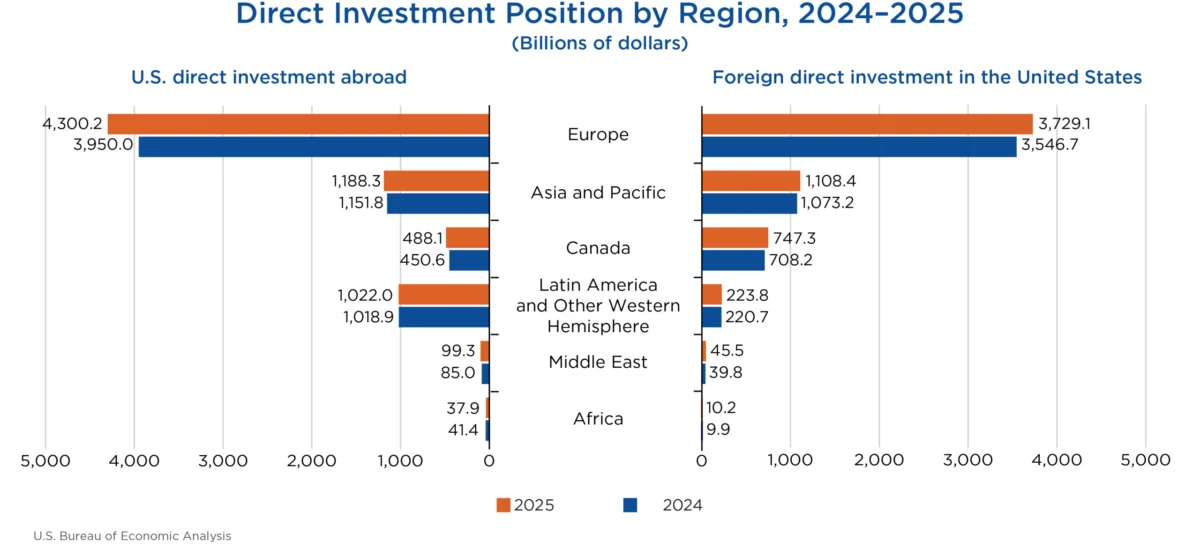
The cumulative level of U.S. direct investment abroad surged by $438.1 billion, reaching a substantial $7.14 trillion by the close of 2025. This robust expansion, detailed in statistics released by the U.S. Bureau of Economic Analysis (BEA), was predominantly fueled by a remarkable $350.2 billion increase in investment within Europe, with the United Kingdom and Luxembourg emerging as key destinations. Manufacturing, particularly the chemical sector, led the growth in U.S. outbound investments. Concurrently, foreign direct investment (FDI) in the United States also experienced a considerable uptick, rising by $266.0 billion to a total of $5.86 trillion by year-end 2025. This inbound investment surge was also significantly driven by European entities, with German and Canadian multinationals making the largest contributions. The manufacturing sector, specifically electrical equipment and components, was the primary beneficiary of this increased foreign capital.
A Year of Dynamic Global Investment Flows
The year 2025 marked a period of significant activity in international investment for the United States, both in terms of its own outward reach and the capital it attracted from abroad. The BEA’s latest figures underscore a global economic landscape characterized by increased cross-border capital flows, with U.S. companies expanding their global footprint and foreign entities deepening their commitment to the American economy. This dual trend suggests a complex interplay of global economic strategies, market opportunities, and potentially, responses to evolving geopolitical and economic conditions.
The substantial increase in U.S. direct investment abroad reflects a strategic push by American multinational enterprises (MNEs) to capitalize on international growth opportunities, access new markets, and optimize global supply chains. The concentration of this investment in Europe, particularly in established financial and industrial hubs like the United Kingdom and Luxembourg, indicates a continued confidence in the stability and profitability of these regions. The manufacturing sector’s leading role in this outward investment further highlights the ongoing globalization of production and the strategic importance of industrial capacity in driving economic competitiveness.
Conversely, the robust growth in foreign direct investment into the United States signals that the U.S. remains an attractive destination for global capital. The significant contributions from European nations, with Germany and Canada at the forefront, underscore the enduring appeal of the U.S. market for established industrial powers. The focus on manufacturing, particularly in the electrical equipment and components sector, points to foreign companies’ interest in leveraging U.S. innovation, skilled labor, and access to the North American market.
Deep Dive into U.S. Direct Investment Abroad
U.S. multinational enterprises have established a widespread global presence, with investments spanning nearly every nation. However, a significant portion of the total U.S. direct investment abroad in 2025 was concentrated in a few key countries. The United Kingdom stood as the leading destination, with an impressive cumulative investment position of $1,114.7 billion. Following closely were the Netherlands ($1,044.0 billion), Luxembourg ($645.3 billion), Ireland ($511.9 billion), and Canada ($488.1 billion). This geographic distribution underscores the strategic importance of these nations as conduits for further investment, hubs for financial services, or significant end markets for U.S. goods and services.
By industry, the landscape of U.S. outbound investment reveals a notable dominance by holding companies, which accounted for a substantial 45.8 percent of the total position abroad in 2025. This suggests a strategic use of holding structures for managing international assets, optimizing tax efficiencies, and facilitating complex corporate operations across borders. Manufacturing affiliates secured the second-largest share at 15.9 percent, reinforcing the sector’s global reach. Finance and insurance affiliates followed, representing 13.5 percent of U.S. investment abroad, indicating the internationalization of financial services and the crucial role they play in supporting global business operations.
When examining the investment by the industry of the U.S. parent company, manufacturing MNEs were the most significant drivers of outbound investment, accounting for 50.2 percent of the total position. This reaffirms the manufacturing sector’s critical role in the U.S. economy and its global engagement. MNEs in the finance and insurance sector were the second-largest contributors, with 15.8 percent of the outbound investment, highlighting the interconnectedness of financial markets and the global ambitions of U.S. financial institutions.
In terms of income generated from these overseas investments, U.S. MNEs reported earnings of $660.1 billion in 2025 on their cumulative direct investment abroad. This represents a notable 11.1 percent increase compared to the previous year, 2024. The growth in income was most pronounced in holding companies, which saw an increase of $40.0 billion. Conversely, income from finance and insurance affiliates experienced a slight decline of $6.3 billion compared to 2024, suggesting potential market fluctuations or strategic shifts within that specific sub-sector.
The Influx of Foreign Capital into the U.S. Economy
The United States continued to be a magnet for foreign direct investment in 2025, with the cumulative position reaching $5.86 trillion. This inflow was significantly influenced by investments originating from Europe, which contributed an additional $182.4 billion to the total. Beyond Europe, German multinationals led the surge in new investment, increasing their position by $49.0 billion, followed by Canadian multinationals with a $39.2 billion rise. These figures underscore the strong economic ties and confidence that these North American and European powers place in the U.S. market.
By country of foreign parent, four nations accounted for over half of the total FDI in the United States in 2025. Japan emerged as the leading investor, with a substantial position of $776.3 billion. The Netherlands followed with $751.8 billion, then Canada with $747.3 billion, and the United Kingdom with $738.3 billion. This diverse geographic representation highlights the broad international appeal of the U.S. economy.
A more nuanced view emerges when considering the country of the ultimate beneficial owner (UBO), which represents the entity at the top of a global ownership chain. On this basis, Japan remained the top investing country with $827.1 billion, followed by Canada at $819.8 billion and Germany at $706.2 billion. Notably, the UBO data revealed that investment from the Netherlands and Luxembourg was considerably lower than when viewed from the perspective of the foreign parent country. This suggests that a significant portion of capital flowing from these European financial centers ultimately originated from investors in other nations, pointing to their role as intermediaries or holding jurisdictions for a diverse range of global investors.
In terms of industry concentration, the U.S. manufacturing sector remained the primary recipient of foreign direct investment, attracting 42.8 percent of the total position. Within manufacturing, chemical manufacturing alone accounted for a substantial one-third of the total foreign investment, amounting to $835.9 billion. This highlights the strategic importance of the chemical industry for foreign investors seeking to tap into U.S. production capabilities and market demand. Significant investments were also observed in the finance and insurance sectors ($629.7 billion) and wholesale trade ($534.0 billion), demonstrating the breadth of foreign interest across key U.S. economic pillars.
Foreign MNEs generated $310.1 billion in income from their cumulative investments in the United States during 2025. This figure represents a slight decrease of 1.9 percent compared to the income earned in 2024, potentially reflecting shifts in market conditions, profitability, or operational strategies within the U.S. market.
Revisions and Historical Context
The BEA’s release also included revisions to previously published statistics for direct investment positions, reflecting the continuous process of data refinement and incorporation of new information. For instance, U.S. direct investment abroad data for 2023 and 2024, as well as foreign direct investment in the United States for 2022 through 2024, were revised to incorporate newly available and updated source data. These revisions are crucial for ensuring the accuracy and reliability of economic indicators used by policymakers, businesses, and researchers.
The trend of increasing direct investment, both outward and inward, is part of a longer-term pattern of globalization and capital mobility. Historically, the United States has been a primary destination for foreign investment due to its large market, stable political system, and robust legal framework. Similarly, U.S. companies have consistently sought to expand their international operations to access new growth opportunities and diversify their revenue streams. The figures for 2025 represent a continuation and, in many aspects, an acceleration of these established trends.
Implications and Broader Economic Landscape
The robust growth in both U.S. direct investment abroad and foreign direct investment in the United States in 2025 carries significant implications for the U.S. economy and the global economic order. For outbound investment, increased U.S. MNE activity abroad can lead to enhanced global competitiveness, greater access to resources and talent, and the potential for higher returns, which can ultimately benefit the U.S. economy through repatriated profits and job creation in related domestic sectors. However, it also raises questions about the potential impact on domestic job markets and industrial capacity if investment shifts significantly away from U.S. shores.
On the inbound front, the substantial inflow of foreign capital into the U.S. economy signifies continued confidence in the nation’s economic prospects. This investment can translate into job creation, technology transfer, increased productivity, and capital formation, all of which are vital for economic growth and stability. The focus on manufacturing sectors by foreign investors suggests a potential boost to key industries, contributing to innovation and supply chain resilience.
The BEA’s disclosure of more granular data, enabled by updated disclosure avoidance methods, is a positive development. This allows for a deeper understanding of investment patterns, enabling businesses to make more informed strategic decisions and policymakers to craft more targeted economic policies. The availability of detailed country and industry-specific data, including information on ultimate beneficial owners, provides a clearer picture of the sources and destinations of capital, helping to illuminate complex global financial flows and identify potential risks or opportunities.
The continued evolution of global investment patterns, as reflected in the 2025 data, underscores the dynamic nature of the international economy. As businesses and nations navigate an increasingly interconnected world, understanding these capital flows remains paramount for fostering sustainable economic growth and ensuring global financial stability. The BEA’s ongoing reporting provides essential insights into these critical economic activities, serving as a vital resource for comprehending the forces shaping the global marketplace. The next release of Direct Investment by Country and Industry data in July 2027 will offer further insights into these evolving trends.








