

 Lana Rhoades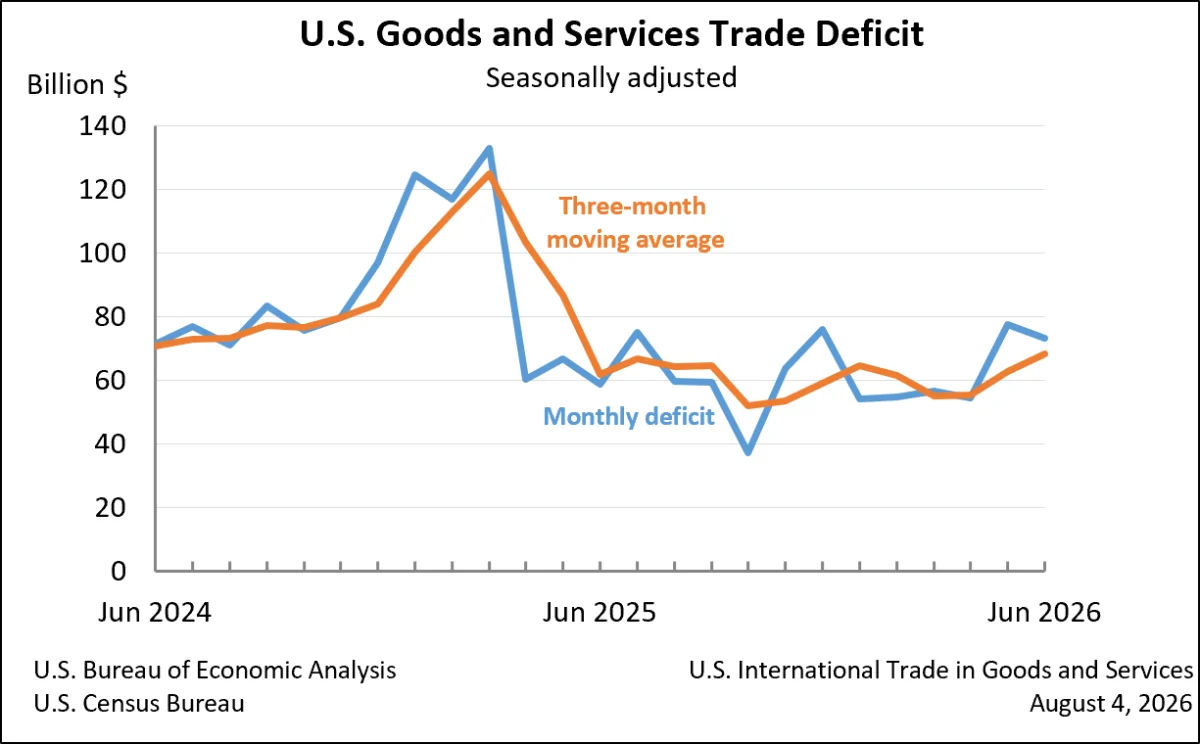
The United States recorded a goods and services deficit of $73.3 billion in June, a notable decrease of $4.4 billion from the revised May figure of $77.6 billion. This contraction in the trade imbalance, as announced today by the U.S. Census Bureau and the U.S. Bureau of Economic Analysis, signals a complex interplay of global economic forces impacting American trade flows. While both exports and imports experienced declines, the reduction in incoming goods and services outpaced the decrease in outgoing ones, leading to the narrower deficit.
Key Figures for June 2026:
- Goods and Services Deficit: $73.3 billion (down 5.6% from May)
- Total Exports: $314.7 billion (down 0.9% from May)
- Total Imports: $388.0 billion (down 1.8% from May)
This latest report offers a snapshot of the U.S. international trade performance at a critical juncture, with global supply chains and consumer demand undergoing continuous adjustments. The figures released on August 4, 2026, provide a detailed breakdown of the movements in both goods and services, shedding light on the specific sectors contributing to the overall trade balance.
Deeper Dive into June Trade Dynamics
The June decrease in the overall goods and services deficit was a composite of two distinct movements: a contraction in the goods deficit and an expansion in the services surplus. The deficit in goods narrowed by $3.9 billion, settling at $102.1 billion. Concurrently, the surplus in services grew by $0.5 billion, reaching $28.8 billion. This indicates that while the U.S. continues to export more services than it imports, the underlying trade in physical goods remains a significant driver of the nation’s overall trade balance.
Exports and Imports in Detail:
- Exports: June exports totaled $314.7 billion, a decrease of $2.9 billion from May. This decline was primarily driven by a $4.0 billion drop in exports of goods, which fell to $206.9 billion. Exports of services, however, showed resilience, increasing by $1.1 billion to $107.8 billion. The decrease in goods exports on a Census basis was $3.8 billion, with net balance of payments adjustments accounting for an additional $0.2 billion reduction.
- Imports: Imports for June were recorded at $388.0 billion, marking a decrease of $7.3 billion from the previous month. The bulk of this reduction was seen in goods imports, which declined by $7.9 billion to $309.0 billion. Similar to exports, imports of goods on a Census basis fell by $7.7 billion, with balance of payments adjustments contributing a $0.2 billion decrease. Imports of services saw a modest increase of $0.6 billion, reaching $79.0 billion.
The reported figures are seasonally adjusted, meaning they have been adjusted to account for predictable seasonal patterns in trade to provide a clearer view of underlying trends. However, they are not adjusted for price changes, a distinction that is particularly relevant when examining real goods.
Real Goods Trade: A Closer Look
The report also provided data on real goods, measured in 2017 dollars and on a Census basis, to account for inflation. In June, the real goods deficit decreased by $5.3 billion, or 5.3 percent, to $94.5 billion. This decline in the real goods deficit was more pronounced than the 3.7 percent decrease observed in the nominal deficit, suggesting that price effects played a role in the overall goods trade picture.
Year-to-Date Performance and Trends
Looking at the year-to-date figures for the period ending in June, the U.S. goods and services deficit has decreased substantially by $189.3 billion, or 33.8 percent, compared to the same period in 2025. This significant reduction is a testament to a robust increase in exports, which rose by $198.3 billion, or 11.7 percent. In contrast, imports saw a much more modest increase of $9.0 billion, or 0.4 percent, over the same period. This divergence highlights a period where U.S. exports have significantly outpaced import growth, contributing to a stronger trade position on a cumulative basis for the year.
Three-Month Moving Averages: Smoothing Out Volatility
To provide a less volatile perspective, the report also examined three-month moving averages. For the three months ending in June, the average goods and services deficit increased by $5.6 billion to $68.5 billion. This increase in the three-month average suggests that while the monthly deficit narrowed in June, there may be underlying upward pressure on the trade balance when looking at a slightly longer timeframe. Year-over-year, the average goods and services deficit for the three months ending in June increased by $6.6 billion from the same period in 2025. This indicates a widening of the trade gap on an annualized average basis, despite the year-to-date improvements.
Trade Balance by Country and Area
The monthly data also provides insights into bilateral trade relationships. In June, the U.S. recorded trade surpluses, in billions of dollars, with:
- Netherlands ($7.2)
- South and Central America ($5.6)
- Hong Kong ($3.2)
- Switzerland ($2.9)
- United Kingdom ($2.2)
- Singapore ($1.8)
- Saudi Arabia ($1.8)
- Brazil ($1.7)
- Australia ($1.3)
- Belgium ($0.9)
Conversely, significant deficits were recorded with:
- Vietnam ($21.6)
- Mexico ($20.3)
- China ($15.3)
- Taiwan ($14.9)
- European Union ($10.9)
- South Korea ($7.4)
- Canada ($7.2)
- Germany ($7.1)
- India ($4.5)
- Malaysia ($4.4)
- Japan ($3.3)
- Ireland ($2.7)
- Italy ($2.5)
- France ($1.5)
- Israel ($1.2)
These figures underscore the diverse nature of U.S. trade relationships, with varying levels of deficit and surplus across different economic partners. The persistent deficits with major manufacturing hubs like China and Taiwan, and neighboring economies like Mexico and Canada, continue to be focal points in discussions about trade policy.
Revisions and Data Integrity
The report also included revisions to previously published data for May exports and imports. While the specific figures for these revisions were not detailed in the provided text, it is standard practice for statistical agencies to refine their estimates as more complete data becomes available. These revisions are crucial for ensuring the accuracy and reliability of the reported trade statistics.
Context and Potential Implications
The narrowing of the U.S. goods and services deficit in June, driven by synchronized declines in both exports and imports, can be interpreted through several lenses. Globally, economic activity in June may have been characterized by a slowdown in consumption and production, leading to reduced demand for both imported and exported goods. Factors such as global inflation, geopolitical uncertainties, and shifts in consumer spending patterns could all contribute to such a dynamic.
From a domestic perspective, the decrease in imports, particularly in goods, might reflect a moderation in U.S. consumer and business demand after periods of robust spending. Simultaneously, the dip in exports could indicate weaker demand from key trading partners or increased competition in international markets.
The year-to-date trend of a significantly reduced deficit, fueled by strong export growth and relatively muted import growth, suggests a positive underlying shift in the U.S. trade position for much of 2026. However, the recent month-over-month figures, including the increase in the three-month moving average deficit, warrant close monitoring. This could signal a potential reversal or a stabilization at a higher deficit level in the near term.
Economists and policymakers will be scrutinizing these numbers for clues about the health of the global economy and the competitiveness of U.S. industries. A sustained reduction in the trade deficit is often viewed favorably as it can contribute to domestic economic growth and employment. Conversely, a widening deficit can raise concerns about the nation’s debt and its reliance on foreign capital.
The U.S. administration’s trade policies, including tariffs and trade agreements, may also play a role in shaping these trade flows. The ongoing recalibration of global supply chains in response to geopolitical events and the push for greater resilience could also be influencing the patterns observed in the data.
Looking Ahead
The next release of U.S. International Trade in Goods and Services data is scheduled for September 3, 2026, which will cover trade figures for July 2026. This subsequent report will be critical in determining whether the June trends represent a temporary fluctuation or the beginning of a new phase in U.S. trade performance. The continuous flow of such data is essential for understanding the complex and ever-evolving landscape of international commerce and its impact on the U.S. economy.
The full dataset and detailed explanations are available on the websites of the U.S. Census Bureau and the U.S. Bureau of Economic Analysis, providing transparency and depth for researchers and the public.








