

 Lana Rhoades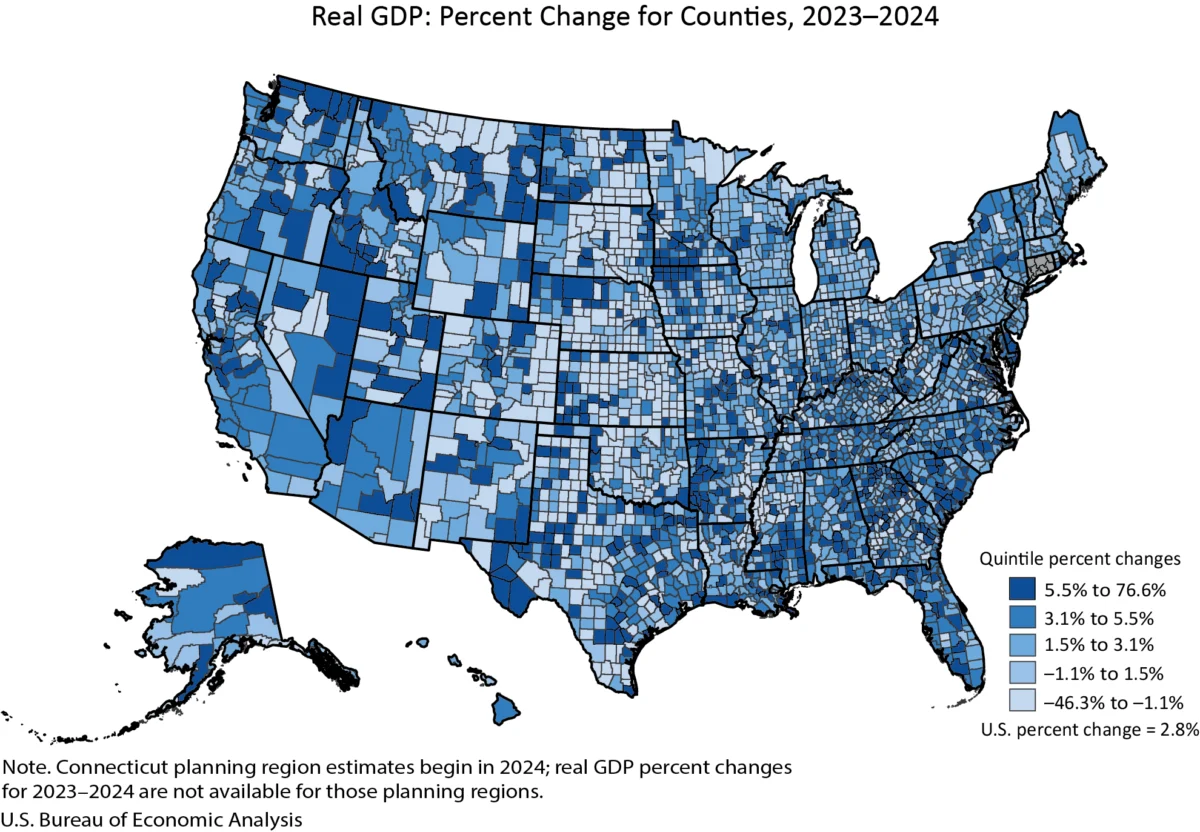
The U.S. Bureau of Economic Analysis (BEA) today released its latest estimates for real gross domestic product (GDP) and personal income by county for 2024, revealing a complex economic picture across the nation. The data indicates that while a significant majority of U.S. counties experienced growth in their real GDP, a substantial number also saw declines, highlighting regional economic disparities. Concurrently, personal income trends also reflect a mixed performance, with a larger proportion of counties reporting increases. These comprehensive county-level statistics, now presented in a single, consolidated news release for the first time, offer a granular view of economic activity and personal financial well-being at the local level.
National Economic Trends at the County Level
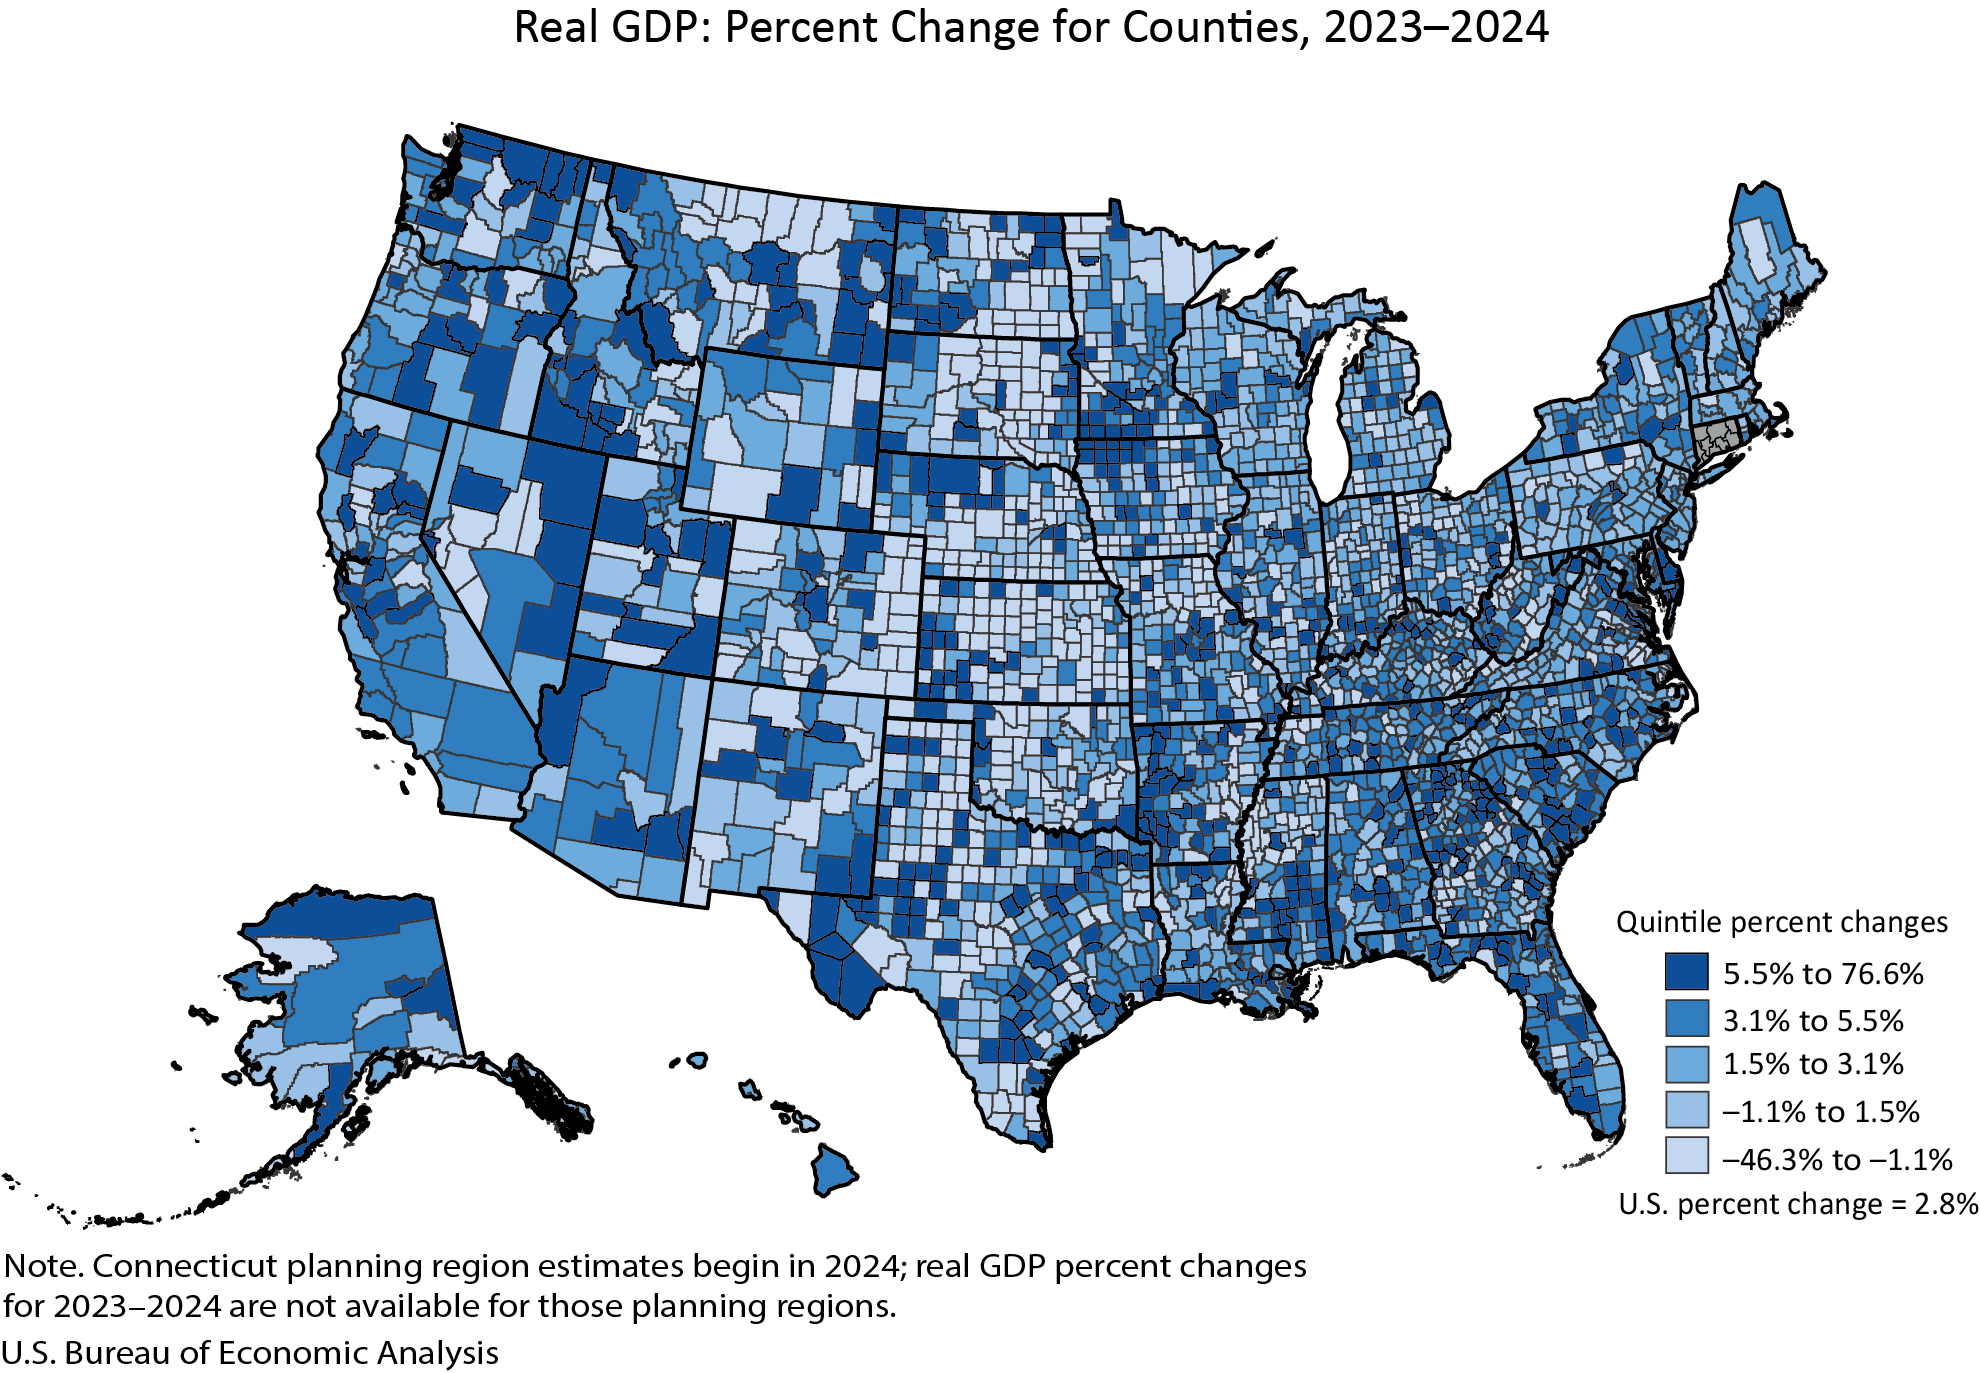
According to the BEA’s estimates, real gross domestic product (GDP) saw an increase in 2,273 counties across the United States in 2024. This broad-based growth suggests a generally positive economic momentum in many local economies. However, the data also reveals that 809 counties experienced a decrease in their real GDP, and 24 counties remained unchanged. This dichotomy underscores the uneven nature of economic recovery and development. The percent change in real GDP across all counties exhibited a wide spectrum, ranging from an impressive 76.6 percent surge in Carter County, Montana, to a significant 46.3 percent contraction in Baca County, Colorado. These extreme figures point to the highly localized factors that can influence economic performance, from resource extraction booms and busts to the impact of natural disasters or shifts in major industries.
The sheer scale of economic output also varies dramatically from county to county. In 2024, New York County, New York, led the nation in total real GDP, reaching an astounding $813.7 billion. In stark contrast, Issaquena County, Mississippi, reported the lowest GDP, at just $15.7 million. This vast difference in economic size highlights the concentration of economic activity in metropolitan hubs and the unique economic structures of smaller, often rural, counties.
Personal Income Trends Mirror Economic Activity
Complementing the GDP figures, the BEA’s data on personal income provides insight into the financial well-being of residents. In 2024, personal income, measured in current dollars, rose in 2,768 counties, indicating that a significant majority of Americans experienced an increase in their earnings. However, 331 counties saw a decline in personal income, and 7 counties reported no change. The percent change in personal income ranged from a robust 22.6 percent increase in Harding County, South Dakota, to a concerning 23.3 percent decrease in Issaquena County, Mississippi. The fact that Issaquena County appears at the extreme ends of both GDP and personal income decline underscores its unique economic challenges.
Similar to GDP, the total level of personal income varied immensely across the country. Los Angeles County, California, boasted the highest personal income at $818.5 billion, reflecting its status as a major economic engine and population center. At the other end of the spectrum, Loving County, Texas, recorded the lowest personal income at $10.6 million, characteristic of its small population and specialized economic base.
County Economic Performance by Population Size
The BEA’s analysis further breaks down economic trends by county population size, offering a nuanced understanding of how different types of communities are faring.
Large Counties (Population > 500,000)
In 2024, large counties, defined as those with a population exceeding 500,000, demonstrated a strong overall performance. Of these, 145 counties experienced GDP growth, while none reported a decline, and only one remained unchanged. The range of GDP growth in these major economic centers was from a high of 10.7 percent in Pinal County, Arizona, to 0.0 percent in Johnson County, Kansas, indicating a generally stable and expanding economic environment. The economic scale of these counties is immense, with New York County, NY, representing the pinnacle at $813.7 billion in real GDP. Even Pinal County, AZ, at the lower end of the size range for large counties in this category, generated $12.7 billion in real GDP.
Medium Counties (Population 100,000 to 500,000)
Medium-sized counties, with populations between 100,000 and 500,000, also exhibited positive economic trends, though with a slightly more varied outcome. A total of 451 medium counties saw their real GDP increase, while 20 experienced a decline, and 3 remained unchanged. The percent change in real GDP for these counties ranged from a notable 12.4 percent in Jefferson County, Texas, to a modest decline of 2.6 percent in Black Hawk County, Iowa. Mercer County, New Jersey, stood out with a real GDP of $46.6 billion, while Liberty County, Texas, represented the lower end of the economic spectrum for this group at $2.6 billion.
Small Counties (Population < 100,000)
Small counties, those with populations under 100,000, presented the most diverse economic landscape. A substantial 1,677 small counties recorded GDP growth. However, this category also accounted for the vast majority of counties experiencing declines, with 789 reporting a decrease in real GDP. Twenty small counties saw no appreciable change. The extremes in GDP growth were most pronounced in this group, with Carter County, Montana, leading at 76.6 percent growth and Baca County, Colorado, facing a steep 46.3 percent decline. Despite these fluctuations, the sheer number of small counties means their collective economic contribution is significant. Issaquena County, Mississippi, at $15.7 million, exemplifies the smaller economic footprints found within this demographic.
Personal Income by Population Size
Examining personal income trends by population size reveals a similar pattern of broad growth, with some variations.
Large Counties (Personal Income)
In large counties, 146 reported personal income growth. San Joaquin County, California, saw a notable increase of 9.7 percent, while Philadelphia County, Pennsylvania, experienced a 2.7 percent rise. The economic powerhouses among these counties, like Los Angeles County, CA, with $818.5 billion in personal income, dwarf smaller large counties, such as Pinal County, AZ, at $26.1 billion.
Medium Counties (Personal Income)
Medium counties showed a strong trend in personal income, with 474 reporting growth. Merced County, California, recorded the highest growth at 10.9 percent, followed by Genesee County, Michigan, at 1.6 percent. Collier County, Florida, represented a significant economic presence with $62.5 billion in personal income, while Floyd County, Georgia, had $4.9 billion.
Small Counties (Personal Income)
Small counties displayed the widest range in personal income changes. A total of 2,148 small counties saw an increase in personal income, while 331 experienced a decrease, and 7 remained unchanged. Harding County, South Dakota, led with a 22.6 percent increase, contrasting sharply with Issaquena County, Mississippi’s 23.3 percent decline. Teton County, Wyoming, demonstrated substantial economic activity for its size with $12.4 billion in personal income, while Loving County, Texas, at $10.6 million, represented the lower end.
Methodological Updates and Data Presentation
The BEA’s release of the 2024 county statistics incorporates significant methodological updates. The estimates for 2024 are based on the BEA’s annual updates to GDP and personal income by county, including revisions to data from 2020 to 2023. These revisions leverage more complete and up-to-date source data, ensuring greater accuracy and consistency. Crucially, these county data are now aligned with the national-level National Income and Product Accounts (NIPA) update released on September 25, 2025, and the state-level GDP and personal income statistics released on September 26, 2025. This harmonization strengthens the coherence of economic data across different geographic scales.
A notable geographical adjustment concerns Connecticut. Beginning with the 2024 estimates, Connecticut’s data will reflect its established planning regions rather than traditional county boundaries. As these planning region estimates are only available from 2024 onward, they are not included in the percent change calculations presented in this release, which span 2023-2024.
The BEA also released new estimates for per capita personal income for 2024, calculated using U.S. Census Bureau population figures for the period 2020-2024. This metric offers another lens through which to view economic well-being at the county level.
Evolution of BEA Data Releases
This year marks a significant shift in how the BEA presents its county-level economic data. For the first time, annual GDP and personal income by county are being released in a single, combined news release. This integration aims to provide a more holistic and efficient overview of county economies, replacing the previous practice of issuing two separate releases on different dates. This consolidated approach is expected to offer data users a more comprehensive picture and reduce duplication of information.
In line with a broader trend towards digital data access and efficiency, the BEA has also discontinued the inclusion of statistical tables directly within its news releases. Instead, users are directed to the BEA’s Interactive Data Application via embedded links. This platform offers robust customization options, allowing users to access full time series, download data in various formats (PDF, Excel, CSV), and conduct more in-depth analyses. This transition is designed to reduce redundancy and guide users to the most flexible and comprehensive data resources available.
Furthermore, the BEA has announced the discontinuation of publication for certain metropolitan and micropolitan area statistics, including metropolitan statistical areas, micropolitan statistical areas, metropolitan divisions, combined statistical areas, and metropolitan and nonmetropolitan portions. While GDP and personal income estimates will continue to be available at the county level, these broader statistical area designations are no longer being produced by the BEA. This decision, detailed in a related FAQ, reflects a strategic focus on granular county-level data.
Looking Ahead: Future Releases and Data Archiving
The BEA has also provided information regarding future data releases and access to historical information. The current 2024 data will be superseded by the release of 2025 GDP and personal income by county statistics on December 2, 2026. Following this update, the 2024 data will be accessible through BEA’s Data Archive, ensuring that historical information remains available for research and analysis.
The agency has also highlighted the availability of detailed data tables through its Interactive Data Application, including:
- GDP by County:
- Table CAGDP1. County GDP Summary (Percent Change From Preceding Period)
- Table CAGDP1. County GDP Summary (Thousands of Chained 2017 Dollars)
- Personal Income by County:
- Table CAINC1. County Personal Income Summary (Percent Change From Preceding Period)
- Table CAINC1. County Personal Income Summary (Thousands of Dollars)
These links provide direct access to comprehensive datasets, enabling users to explore the economic performance of individual counties in detail. The BEA also directs users to an "Additional Information" page for definitions, statistical conventions, and details about the BEA regions, uses of these statistics, and more.
The next release of county-level economic data is scheduled for December 2, 2026, at 8:30 a.m. EST, which will include the GDP and personal income statistics for 2025. This ongoing cycle of data collection, analysis, and dissemination by the BEA remains a critical resource for understanding the multifaceted economic landscape of the United States at its most local levels.








