

 Lana Rhoades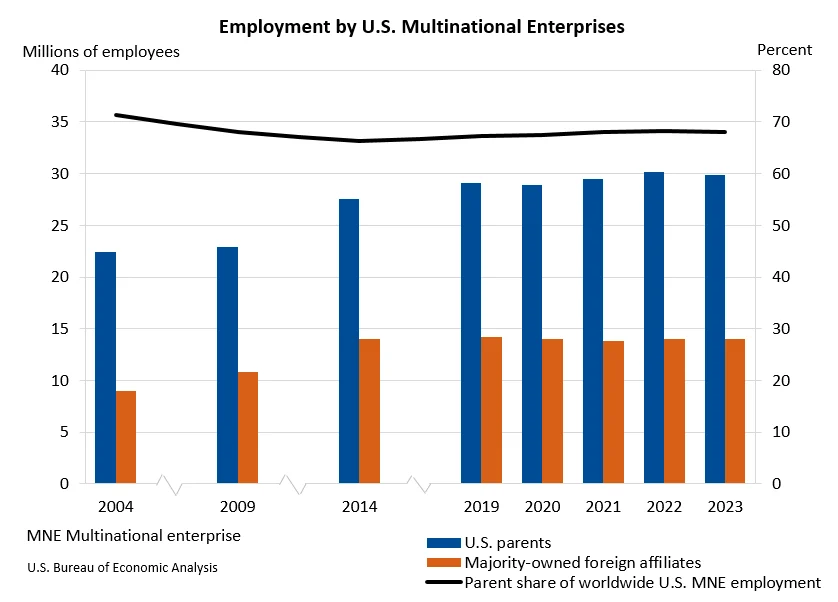
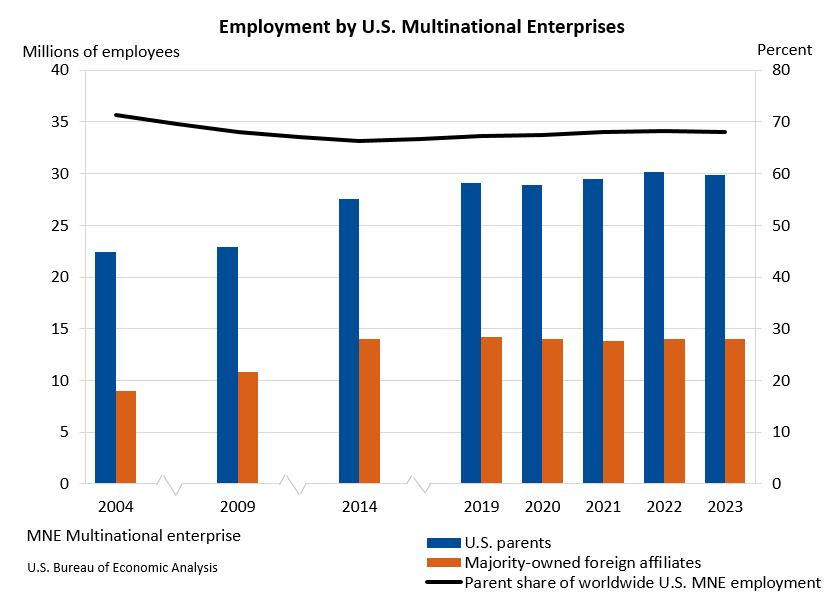
Worldwide employment by U.S. multinational enterprises (MNEs) saw a marginal decrease of 0.4 percent in 2023, falling to 43.9 million workers from a revised 44.1 million in the preceding year, according to preliminary statistics released by the U.S. Bureau of Economic Analysis (BEA). This slight contraction, detailed in the BEA’s comprehensive report on the operations and finances of U.S. parent companies and their foreign affiliates, offers a nuanced snapshot of global economic engagement for American corporations. The data reflects ongoing adjustments in workforce strategies and investment patterns in a dynamic international business environment.
The figures indicate a complex interplay between domestic and international employment trends. Within the United States, employment by U.S. parent companies experienced a more pronounced decline of 0.8 percent, reducing their workforce to 29.9 million. Despite this dip, U.S. parents still represent the dominant share of worldwide employment by U.S. MNEs, accounting for 68.1 percent in 2023, a slight decrease from 68.3 percent in 2022. Conversely, employment abroad by foreign affiliates of U.S. MNEs exhibited modest growth, increasing by 0.2 percent to 14.0 million workers. This expansion overseas means that international operations now constitute 31.9 percent of the total global workforce managed by U.S. MNEs.
Domestic Workforce Dynamics Under Scrutiny
The decline in domestic employment by U.S. parent companies is a significant point of analysis. These companies are crucial drivers of the U.S. economy, and their hiring decisions have broad ripple effects. In 2023, U.S. parents accounted for 21.9 percent of the total private industry employment in the United States, a marginal decrease from 22.5 percent in 2022. This suggests a continued, albeit small, shift in the proportion of the U.S. labor market engaged by these multinational corporations.
The sectors where U.S. parents maintain the largest employment footprints remain consistent: manufacturing, a broad category encompassing "other industries" primarily driven by transportation and warehousing, and retail trade. These sectors are often characterized by varying degrees of automation, global supply chain dependencies, and consumer demand fluctuations, all of which can influence employment levels.
International Operations Show Resilience and Growth
The increase in employment by foreign affiliates of U.S. MNEs signals a degree of resilience and strategic expansion in overseas markets. This growth, though modest, highlights the continued importance of international operations for U.S. multinational corporations. The top destinations for employment by these majority-owned foreign affiliates were India, Mexico, and the United Kingdom. These countries often represent key manufacturing hubs, significant consumer markets, or strategic locations within global trade networks, underscoring the diversified nature of U.S. MNEs’ international labor strategies.
Economic Value Added Reflects Global Performance
Beyond employment figures, the BEA report also sheds light on the economic output generated by U.S. MNEs. Worldwide current-dollar value added by these enterprises saw a slight decrease of 0.6 percent, totaling $6.9 trillion in 2023. Value added is a key measure of an entity’s contribution to gross domestic product (GDP), representing the difference between an organization’s output and its intermediate consumption.
The contribution of U.S. parents to domestic GDP also declined, falling by 1.0 percent to $5.3 trillion. This signifies that U.S. parents accounted for 21.4 percent of the total U.S. private-industry value added, down from 23.1 percent in the previous year. This downward adjustment in the domestic contribution mirrors the trends observed in employment.
In contrast, the value added by majority-owned foreign affiliates demonstrated an increase of 0.8 percent, reaching $1.6 trillion. This positive growth in international economic contribution contrasts with the domestic figures, suggesting that the expansion of overseas operations is contributing to overall economic value generation for U.S. MNEs, even as the domestic share slightly recedes. The primary contributors to this international value added were the United Kingdom, Canada, and Ireland, indicating these nations’ significant roles in the economic performance of U.S. multinational corporations abroad.
Investment in Future Growth: Capital Expenditures and R&D
The BEA data also captures significant investment trends, revealing a robust increase in expenditures for property, plant, and equipment (capital expenditures) by U.S. MNEs. Worldwide, these expenditures rose by a notable 7.5 percent, reaching $1.1 trillion. This substantial investment suggests a forward-looking strategy by U.S. MNEs, potentially aimed at expanding production capacity, modernizing facilities, or investing in new technologies.
Within this global figure, U.S. parents accounted for $886.1 billion in capital expenditures, while majority-owned foreign affiliates contributed $216.2 billion. The significant portion allocated to domestic investment underscores a continued commitment to the U.S. operational base, even amidst global expansion.
Parallel to capital investments, worldwide research and development (R&D) expenditures by U.S. MNEs also experienced a strong increase of 7.5 percent, reaching $558.3 billion. This synchronized surge in both capital investment and R&D spending indicates a strategic focus on innovation and long-term growth. U.S. parents were the primary drivers of this R&D investment, accounting for $476.6 billion, with foreign affiliates contributing $81.7 billion. This substantial domestic R&D investment highlights the United States’ continued role as a hub for technological advancement and innovation within these multinational corporations.

Revisiting 2022 Data: Refinements and Accuracy
The BEA also provided updated statistics for 2022, incorporating newly available and revised source data. These revisions offer a more accurate picture of the prior year’s economic activities. For instance, the number of employees for U.S. parents in the revised 2022 data was 30,120.1 thousand, slightly different from the preliminary estimate. Similarly, value added figures and expenditure data for both U.S. parents and their foreign affiliates were refined, ensuring greater statistical precision. These updates are crucial for understanding year-over-year trends and for the reliability of economic analysis. The preliminary statistics for 2022 were initially released in August 2024 and further detailed in the Survey of Current Business in September 2024, a testament to the BEA’s commitment to providing timely and accurate economic data.
Implications and Broader Economic Context
The trends observed in the 2023 BEA report offer several key insights into the global economic positioning of U.S. multinational enterprises. The slight contraction in overall employment, driven by a more significant decline in domestic hiring, coupled with modest growth in international employment, suggests a strategic recalibration by these corporations. This could be influenced by a variety of factors, including evolving global trade dynamics, shifting consumer demand patterns, labor cost considerations, and the ongoing impact of technological advancements on workforce needs.
The robust increase in capital expenditures and R&D spending, particularly within the U.S., signals a strong underlying confidence in future economic prospects and a commitment to innovation. This suggests that while employment figures may fluctuate, the underlying investment in productive capacity and technological advancement remains a priority for U.S. MNEs. This investment could be a precursor to future job creation or a strategy to enhance productivity and competitiveness in an increasingly complex global marketplace.
The divergence between domestic and international value added, with the latter showing growth while the former experienced a decline, warrants careful observation. This could indicate a strengthening of foreign affiliate contributions to the overall economic performance of U.S. MNEs, potentially due to market expansion, favorable economic conditions abroad, or strategic investments made in previous years.
The BEA’s detailed breakdown of these statistics, available through its interactive data application and comprehensive data tables, allows for deeper analysis by industry, country, and specific financial and operating metrics. These resources are invaluable for policymakers, economists, businesses, and researchers seeking to understand the intricate landscape of international trade and investment and the evolving role of U.S. multinational enterprises in the global economy. The next release, covering the 2024 activities of U.S. MNEs, is anticipated in November 2026, providing further data to track these important economic trends.








