Lana Rhoades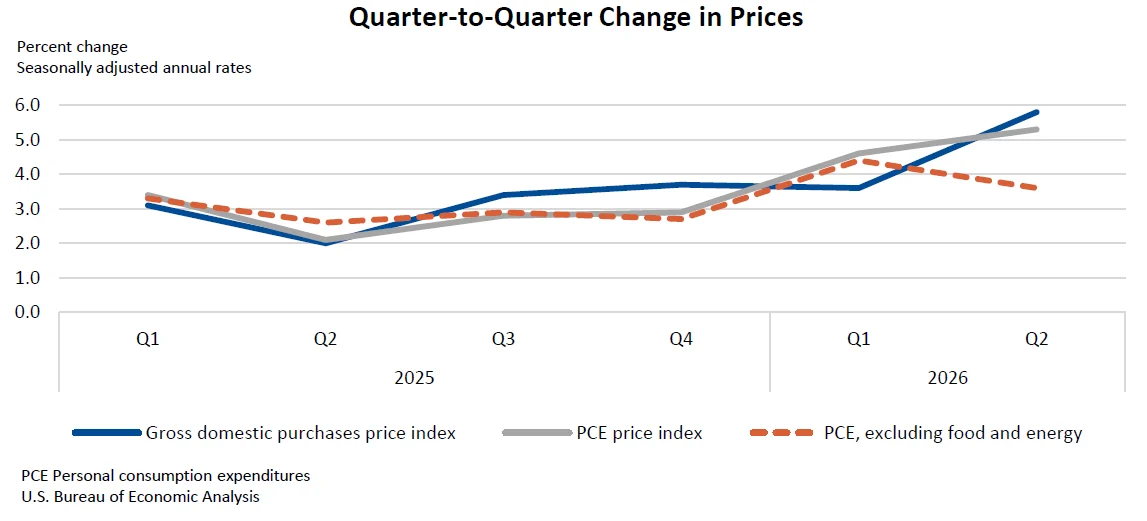
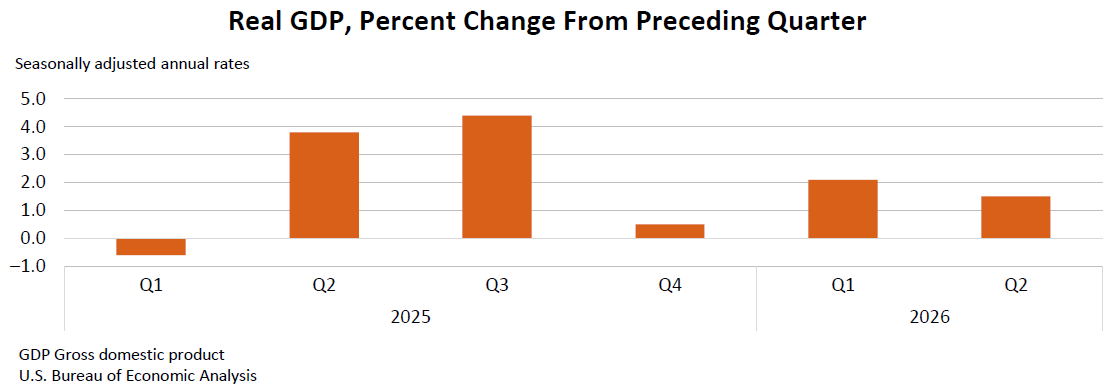
The U.S. economy, as measured by real gross domestic product (GDP), expanded at an annualized rate of 1.5 percent during the second quarter of 2026, encompassing the months of April, May, and June. This figure represents a moderation from the 2.1 percent growth recorded in the first quarter, according to the second estimate released by the U.S. Bureau of Economic Analysis (BEA). While the headline GDP growth rate remained consistent with the advance estimate, subtle shifts in underlying components and a slight upward revision to price indexes indicate a nuanced economic landscape.
Key Drivers of Second-Quarter Growth
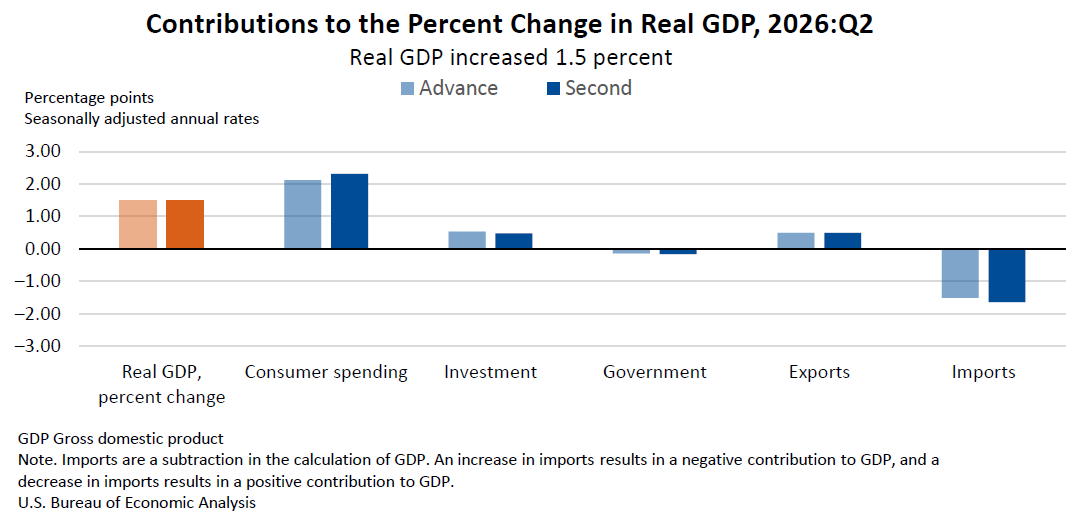
The increase in real GDP during the second quarter was primarily fueled by robust consumer spending, a surge in exports, and continued investment. These positive contributions, however, were partially counterbalanced by a decline in government spending. Additionally, imports, which are subtracted in the calculation of GDP, saw an increase, further moderating the overall growth figure.
The BEA’s second estimate revealed that the upward revision to consumer spending was offset by an upward revision to imports, resulting in the unchanged headline GDP growth rate. This suggests that while consumers continued to drive economic activity, the nation’s appetite for foreign goods and services also grew.
Deceleration in Growth: A Closer Look
The deceleration in real GDP growth from the first quarter to the second quarter can be attributed to several factors. A notable downturn in government spending played a significant role. Furthermore, both investment and exports experienced decelerations in their growth rates compared to the preceding quarter. These slowdowns were, to some extent, mitigated by an acceleration in consumer spending, which demonstrated resilience. The increasing trend of imports also contributed to the moderation in overall GDP growth, as a larger outflow of dollars for foreign goods and services reduces the net contribution to domestic economic output.
Private Domestic Demand Shows Strength
Despite the overall moderation in GDP growth, real final sales to private domestic purchasers—a measure that aggregates consumer spending and gross private fixed investment—showed considerable strength. This key indicator increased by 4.2 percent in the second quarter, a revision upward by 0.3 percentage points from the previous estimate. This suggests that the core engine of the U.S. economy, driven by domestic households and businesses, remains robust. This upward revision signals a stronger underlying demand for goods and services produced within the United States, excluding inventory fluctuations and government expenditures.
Inflationary Pressures Persist
On the inflation front, the price index for gross domestic purchases, a broad measure of price changes for goods and services purchased by consumers, businesses, and government, rose at a 5.8 percent annual rate in the second quarter. This represents an upward revision of 0.1 percentage point from the advance estimate. The personal consumption expenditures (PCE) price index, a key inflation gauge closely watched by the Federal Reserve, increased by 5.3 percent. This too was a slight upward revision of 0.2 percentage points. Even when excluding the more volatile food and energy components, the core PCE price index saw an increase of 3.6 percent, also revised upward by 0.2 percentage points. These upward revisions to price measures indicate that inflationary pressures, while potentially moderating from their peak, remain a significant consideration for economic policymakers.
Gross Domestic Income (GDI) Outpaces GDP
In a notable development, real gross domestic income (GDI), which measures the income earned by U.S. residents and businesses from production, increased at a more robust pace of 2.2 percent in the second quarter. This compares with an increase of 1.2 percent in the first quarter. The average of real GDP and real GDI, often considered a more comprehensive measure of economic activity by smoothing out the statistical discrepancies between the two measures, increased by 1.8 percent, an acceleration from the 1.7 percent growth seen in the first quarter. The divergence between GDP and GDI can sometimes signal underlying economic trends or statistical adjustments. The stronger GDI growth suggests that incomes generated from economic activity may be expanding at a faster rate than the output of goods and services.
Corporate Profits Show Significant Gains
Corporate profits from current production, a vital indicator of business health and profitability, experienced a substantial increase in the second quarter. Profits rose by $400.9 billion, a significant jump from the $74.4 billion increase recorded in the first quarter. This robust growth in corporate profits could signal improved business conditions, increased pricing power, or greater operational efficiency among U.S. corporations. Such gains can have ripple effects on investment decisions, hiring, and shareholder returns.
Historical Context and Economic Trends
The economic performance in the second quarter of 2026 unfolds against a backdrop of evolving global economic dynamics and domestic policy considerations. Following a period of post-pandemic recovery, the U.S. economy has navigated challenges including persistent inflation, shifts in consumer spending patterns, and geopolitical uncertainties. The moderation in GDP growth from the first to the second quarter aligns with expectations of a more sustainable, albeit slower, growth trajectory as the economy adjusts to higher interest rates and a normalization of demand.
The first quarter’s growth of 2.1 percent had indicated a solid start to the year, driven by a confluence of factors including strong consumer resilience and supportive fiscal policies. However, the subsequent slowdown to 1.5 percent suggests that some of these earlier drivers may be losing momentum, or that other economic headwinds are beginning to exert a more pronounced influence. The BEA’s revised estimates provide a more refined picture of these underlying forces.
Analyzing the Contributions to GDP
A deeper dive into the BEA’s data tables provides a granular understanding of the components driving the economic expansion. The increase in consumer spending, a cornerstone of the U.S. economy, indicates that households continued to allocate resources towards goods and services. This sustained consumer demand is crucial for maintaining economic momentum. The rise in exports suggests that U.S. products and services remain competitive in the global marketplace, contributing positively to the nation’s trade balance. Investment, encompassing business spending on equipment, structures, and intellectual property, also played a role, signaling confidence in future economic prospects.
Conversely, the decrease in government spending, whether at the federal, state, or local level, acted as a drag on overall GDP. This could reflect a deliberate policy shift towards fiscal consolidation or a natural unwinding of pandemic-era stimulus measures. The increase in imports, while contributing to consumer choice and business input, represents an outflow of economic resources that subtracts from the domestic GDP calculation.
Implications for Policymakers and Markets
The release of the second GDP estimate carries significant implications for economic policymakers, particularly the Federal Reserve, and for financial markets. The persistent inflationary pressures, as indicated by the upward revisions to price indexes, may reinforce the Federal Reserve’s stance on monetary policy. While the pace of rate hikes may have slowed, the central bank will likely remain vigilant in its efforts to bring inflation back to its target range.
For financial markets, the moderated GDP growth coupled with persistent inflation presents a mixed picture. Investors will be closely monitoring corporate earnings, consumer spending trends, and any further indications of inflationary pressures. The resilience of private domestic demand, however, could be viewed as a positive sign, suggesting that the economy is not heading towards a sharp contraction.
Looking Ahead: Annual Updates and Future Releases
The BEA also announced that the 2026 annual updates of national, industry, and regional economic data will commence on September 30, 2026. This comprehensive update will encompass GDP, gross domestic income, GDP by industry, monthly personal income and outlays, and related statistics. Additionally, updates to GDP by state and county, along with personal income data, will be released. These annual updates are crucial for providing a more accurate and comprehensive view of the economy’s performance over time, incorporating revised data and methodological improvements.
The next release of GDP data is scheduled for September 30, 2026, at 8:30 a.m. Eastern Daylight Time. This release will include the third estimate for the second quarter of 2026, along with data on industries, corporate profits, and state-level economic indicators for the second quarter. It will also feature state personal consumption expenditures for 2025. This forthcoming release will offer further insights into the ongoing economic narrative and potential revisions to the current estimates.
Technical Notes and Data Revisions
The BEA’s technical notes provide essential context for understanding the revisions to the GDP estimates. The downward revision of less than 0.1 percentage point to the annualized GDP growth rate in the second quarter was a result of an upward revision to consumer spending being partially offset by an upward revision to imports. These revisions underscore the dynamic nature of economic data collection and estimation, where initial estimates are refined as more comprehensive information becomes available.
The BEA utilizes a robust framework for data collection and analysis, drawing from a wide array of sources, including surveys of businesses, government administrative records, and international trade data. The process of estimating GDP is complex, involving the aggregation of millions of individual transactions and economic activities. The iterative nature of these estimates, with advance, second, and third estimates, allows for increasing accuracy and completeness.
Broader Economic Context and Future Outlook
The 1.5 percent growth rate in the second quarter of 2026 signifies a period of moderate expansion for the U.S. economy. While not as robust as the first quarter, it demonstrates continued resilience in the face of various economic challenges. The strength in private domestic demand is a particularly encouraging sign, suggesting that the core of the U.S. economy remains on solid footing. However, the persistent inflationary pressures and the deceleration in government spending warrant continued attention.
The interplay between consumer spending, business investment, international trade, and government policy will continue to shape the economic trajectory in the coming quarters. The BEA’s detailed data releases provide invaluable tools for economists, policymakers, and the public to understand these complex dynamics and to form informed expectations about the future of the U.S. economy. As the BEA continues to refine its estimates and provide comprehensive annual updates, a clearer picture of the nation’s economic health will emerge.