Lana Rhoades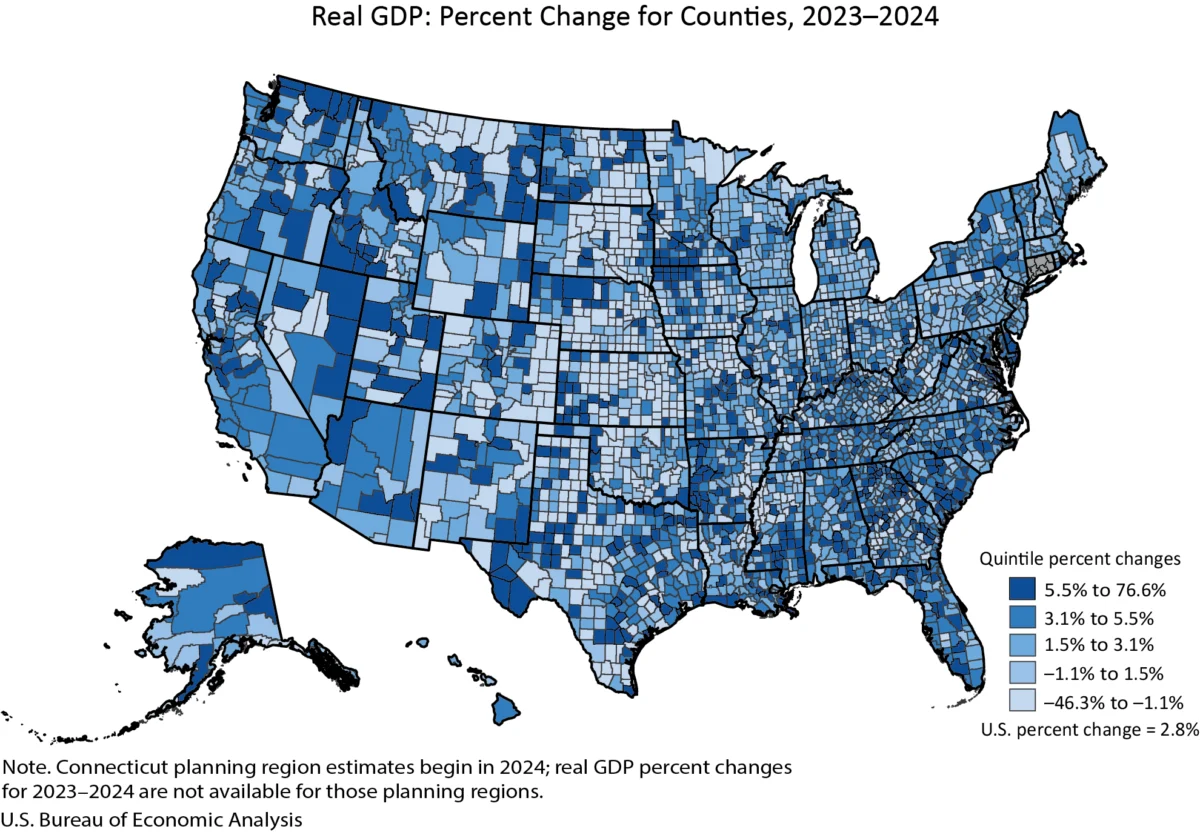
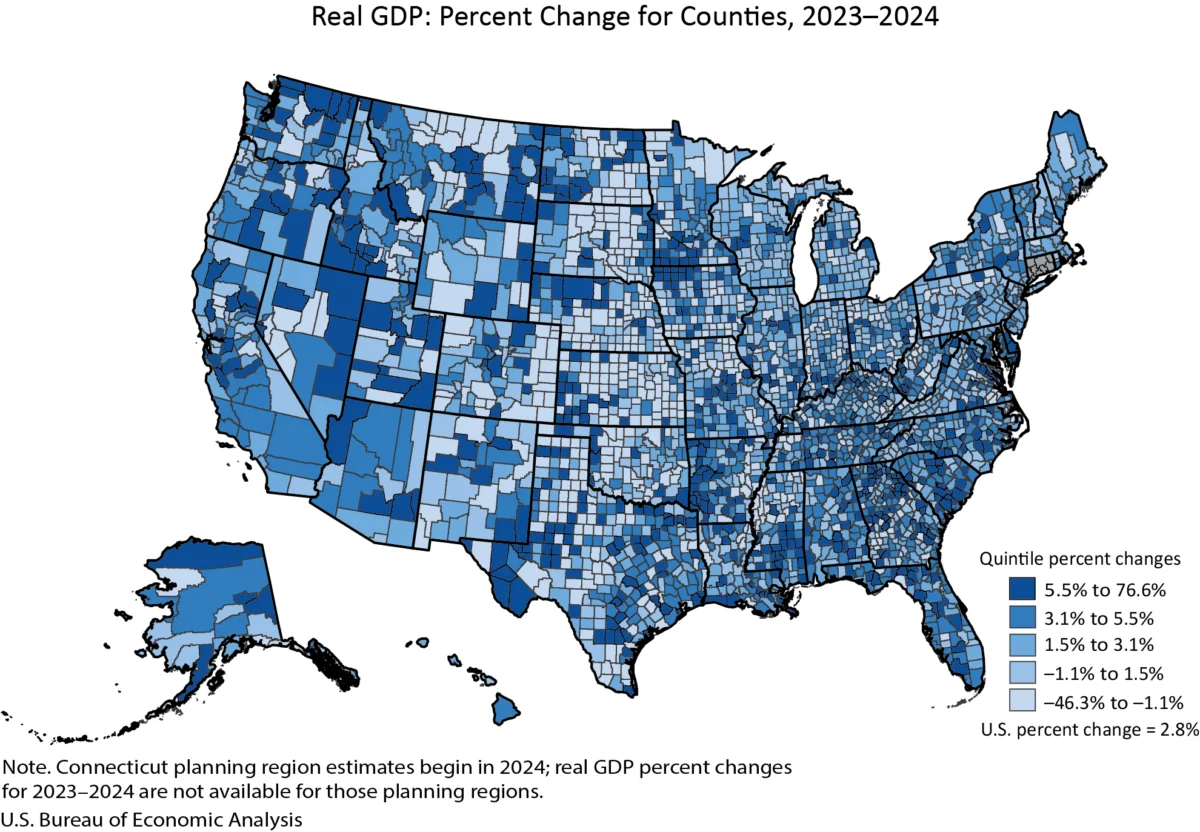
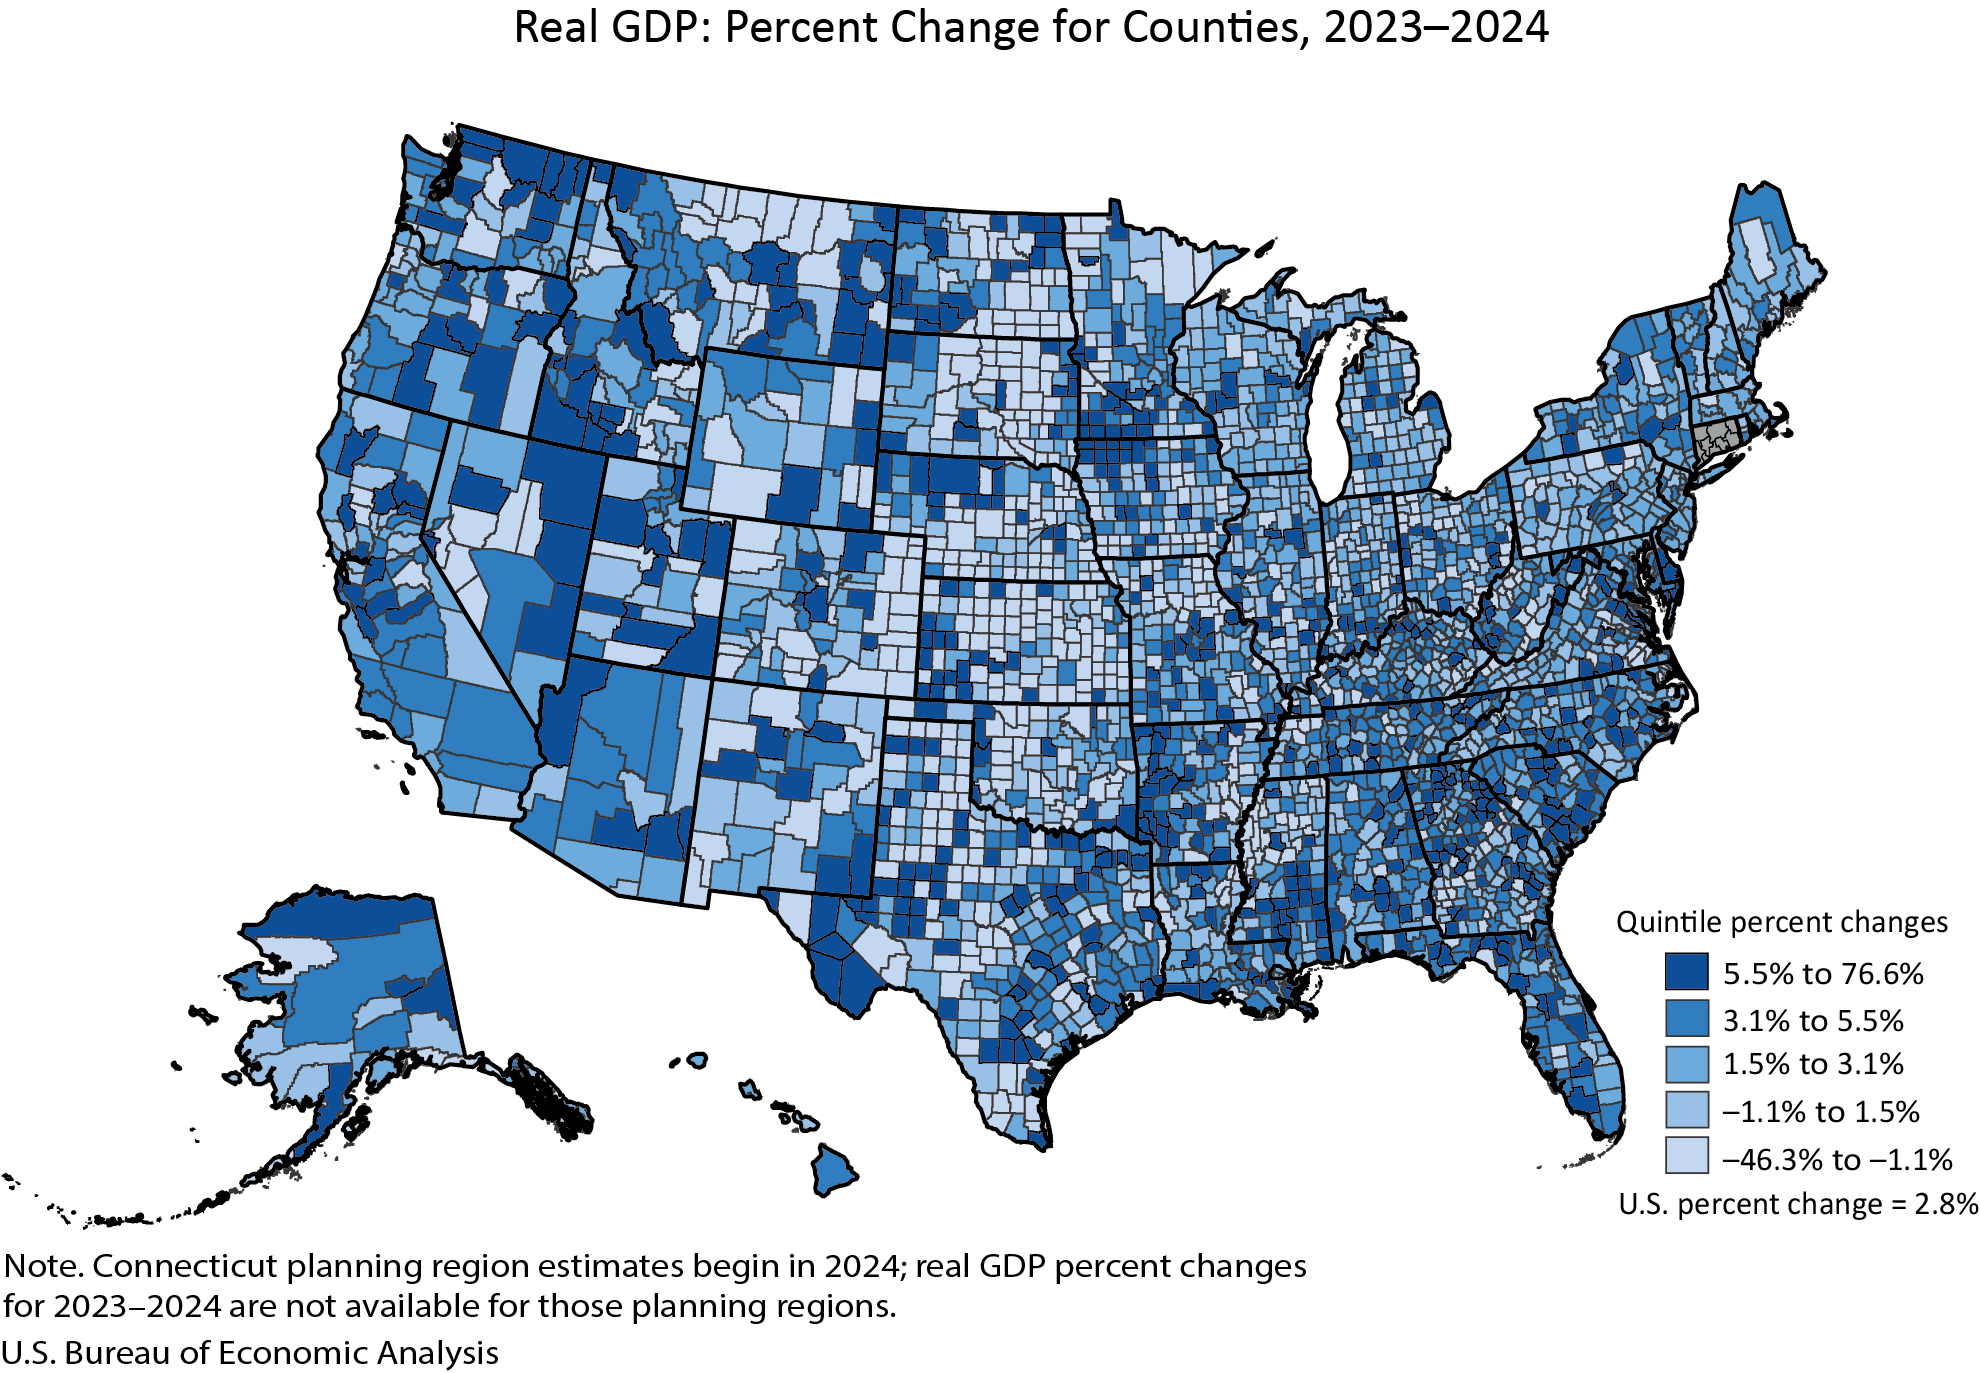
The U.S. Bureau of Economic Analysis (BEA) released its comprehensive annual estimates today, revealing a dynamic economic landscape across American counties in 2024. Real gross domestic product (GDP) saw an uptick in a significant majority of counties, with 2,273 registering an increase, while 809 experienced a decrease, and 24 remained unchanged. This data paints a nuanced picture of economic activity at the local level, highlighting both widespread growth and pockets of contraction.
The breadth of economic performance is starkly illustrated by the wide range of percentage changes in real GDP. Carter County, Montana, stood out with a remarkable 76.6 percent surge, indicating a substantial economic expansion. In contrast, Baca County, Colorado, faced a significant downturn, recording a 46.3 percent decline. These outliers underscore the diverse economic forces at play, influenced by factors ranging from industry-specific booms and busts to natural resource extraction and shifts in consumer demand.
The sheer scale of county economies also varies dramatically. New York County, New York, the economic powerhouse of Manhattan, boasted a staggering real GDP level of $813.7 billion. At the other end of the spectrum, Issaquena County, Mississippi, registered a modest $15.7 million in real GDP. This disparity in economic size is a long-standing characteristic of the U.S. economy, with major metropolitan areas driving a disproportionately large share of national output.
Trends in Real GDP by County Size
The BEA’s analysis further breaks down these trends by county population size, offering deeper insights into the economic performance of different types of communities.
Large Counties (Population > 500,000)
In 2024, 145 large counties experienced growth in real GDP, with zero reporting a decline and one remaining unchanged. The most significant growth among these major economic centers was seen in Pinal County, Arizona, which posted a 10.7 percent increase. This suggests robust economic activity and expansion in some of the nation’s most populous regions. The upper bound of the growth range was 10.7%, demonstrating significant economic dynamism. The lowest growth rate recorded was 0.0% in Johnson County, Kansas, indicating stability but no appreciable expansion. The economic output of these large counties is substantial, with New York County, NY, leading at $813.7 billion. Pinal County, AZ, also demonstrates significant economic scale, with a GDP of $12.7 billion, showcasing its role as a substantial economic contributor.
Medium Counties (Population 100,000 to 500,000)
Medium-sized counties presented a similarly positive trend, with 451 counties experiencing GDP growth, 20 showing a decline, and 3 remaining stable. Jefferson County, Texas, led the pack with a 12.4 percent GDP increase, highlighting areas of targeted industrial or commercial expansion. On the other end of the spectrum, Black Hawk County, Iowa, saw a 2.6 percent contraction, indicating localized economic challenges. The economic output in this category also spans a considerable range, with Mercer County, New Jersey, reporting $46.6 billion in GDP, while Liberty County, Texas, registered $2.6 billion.
Small Counties (Population < 100,000)
The most numerous category, small counties, exhibited the widest variations in economic performance. A total of 1,677 small counties saw their real GDP increase, while a substantial 789 experienced a decline, and 20 showed no significant change. Carter County, Montana, with its extraordinary 76.6 percent growth, exemplifies the potential for rapid expansion in smaller economies, often driven by specific industries like energy or agriculture experiencing a boom. Conversely, Baca County, Colorado, with its 46.3 percent decline, illustrates the vulnerability of smaller economies to sector-specific downturns or demographic shifts. In terms of economic size, Martin County, Texas, generated $15.1 billion, while Issaquena County, Mississippi, had a GDP of $15.7 million, underscoring the vast differences in economic scale even within this population bracket.
Personal Income Trends Across Counties
Beyond the aggregate measure of GDP, personal income offers a crucial perspective on the financial well-being of individuals within these counties. In 2024, personal income, measured in current dollars, demonstrated widespread growth, with 2,768 counties reporting an increase, 331 experiencing a decrease, and 7 remaining unchanged. This suggests that, on average, individuals across the nation saw their incomes rise, a positive indicator for consumer spending and overall economic health.
The range of personal income changes was also considerable. Harding County, South Dakota, recorded an impressive 22.6 percent increase in personal income, pointing to significant gains for its residents. Issaquena County, Mississippi, however, faced a substantial 23.3 percent decline in personal income, highlighting the economic difficulties faced by some communities.
Personal Income Levels: A Wide Spectrum
Similar to GDP, personal income levels exhibit significant disparities across counties. Los Angeles County, California, stands as the nation’s largest economic hub in terms of personal income, with a total of $818.5 billion. In stark contrast, Loving County, Texas, reported a personal income level of just $10.6 million. These figures reflect the deep-seated economic inequalities that persist across different regions of the United States.
Personal Income Highlights by County Size
The BEA’s analysis of personal income also categorizes trends by county population size:
Large Counties (Population > 500,000)
In large counties, 146 reported an increase in personal income. The upper bound of the growth range was 9.7% in San Joaquin County, California, while Philadelphia County, Pennsylvania, showed a growth of 2.7%. These figures indicate a generally positive trend in earnings for residents of major metropolitan areas. The economic scale is substantial, with Los Angeles County, CA, leading at $818.5 billion and Pinal County, AZ, contributing $26.1 billion.
Medium Counties (Population 100,000 to 500,000)
Medium-sized counties saw 474 report an increase in personal income. Merced County, California, experienced a notable 10.9 percent increase, while Genesee County, Michigan, recorded a 1.6 percent rise. These numbers suggest a healthy growth trajectory for personal earnings in many mid-sized economic centers. Collier County, Florida, boasts a personal income of $62.5 billion, with Floyd County, Georgia, at $4.9 billion.
Small Counties (Population < 100,000)
In small counties, 2,148 reported an increase in personal income, 331 saw a decrease, and 7 remained unchanged. Harding County, South Dakota, led the nation with a 22.6 percent increase, demonstrating significant income growth opportunities in some rural areas. Issaquena County, Mississippi, however, faced the steepest decline at 23.3 percent, illustrating the economic precarity that can affect smaller communities. Teton County, Wyoming, has a personal income of $12.4 billion, while Loving County, Texas, has $10.6 million.
Updates to County Statistics and Methodological Changes
The release of the 2024 data incorporates significant updates and methodological shifts by the BEA. The estimates for 2024 are based on annual revisions to GDP and personal income by county, which also include revised data from 2020 through 2023. These revisions are crucial for ensuring the accuracy and comprehensiveness of the economic data, integrating new source information and aligning county-level figures with national accounts and state-level statistics. The September 25, 2025, and September 26, 2025, releases of the National Income and Product Accounts and state-level GDP and personal income, respectively, have been incorporated into this update.
A notable geographical change is the incorporation of Connecticut’s planning region definitions into its GDP and personal income estimates, replacing traditional county boundaries. This shift, effective from the 2024 estimates, means that Connecticut’s data is presented differently and is not included in the percent change ranges that compare across counties with consistent definitions.
Furthermore, the BEA has introduced new estimates for per capita personal income for 2024, calculated using U.S. Census Bureau population figures for the years 2020 through 2024. This provides an additional layer of analysis for understanding individual economic prosperity within counties.
Streamlined Data Presentation and Discontinuation of Metropolitan Area Statistics
For the first time, the BEA has consolidated its annual GDP and personal income by county statistics into a single news release. This move aims to provide a more holistic view of county-level economies and enhance efficiency by replacing two separate releases.
In a significant policy change, the BEA has discontinued the publication of statistics for metropolitan statistical areas, micropolitan statistical areas, metropolitan divisions, combined statistical areas, and their metropolitan and nonmetropolitan portions. This means that future detailed economic analyses will focus exclusively on county-level data for GDP and personal income. The BEA cites increased efficiency and a focus on the most granular level of geographic data as reasons for this change, directing users to an FAQ for further details.
The presentation of data tables has also been updated. Instead of embedding tables directly within the news release, the BEA now directs users to its online Interactive Data Application. This approach aims to reduce redundancy, improve efficiency, and provide data users with more flexible and comprehensive tools for exploring historical time series and downloading data in various formats (PDF, Excel, CSV). Links to specific, customizable tables are provided within the release for direct access.
Broader Economic Context and Implications
The BEA’s county-level data provides an invaluable granular perspective on the U.S. economy. While national and state-level data offer broad trends, county-level statistics reveal the diverse economic realities faced by communities across the country. The widespread GDP growth in 2024 suggests a generally healthy economic environment, potentially fueled by consumer spending, investment, and sectoral growth. The positive trend in personal income further supports this view, indicating that many Americans experienced improved financial standing.
However, the significant number of counties experiencing declines in both GDP and personal income warrants attention. These areas may be grappling with specific challenges such as the decline of traditional industries, labor shortages, outmigration, or the lingering effects of economic shocks. Understanding the underlying causes of these contractions is crucial for developing targeted economic development strategies.
The BEA’s decision to discontinue metropolitan area statistics and focus on county-level data signifies a potential shift in how economic geography is analyzed. Counties often represent distinct economic and social units, and their individual performance can offer unique insights that might be obscured when aggregated into larger metropolitan areas. This focus on counties could empower local policymakers with more precise data for decision-making.
The comprehensive nature of these annual releases allows for the tracking of long-term economic trends at the local level. By analyzing the data over time, economists, policymakers, and business leaders can identify patterns of growth, decline, and resilience, informing strategic planning and investment decisions. The BEA’s commitment to updating and refining its data collection and presentation methods ensures that these vital economic indicators remain relevant and accessible to a wide range of users.
Future Outlook and Data Availability
The BEA has announced that the 2024 data will be superseded by the release of 2025 statistics on December 2, 2026. This regular update cycle ensures that the most current economic information is available. For those needing to access historical data that has been replaced, the BEA’s Data Archive will serve as a repository.
The release of this detailed county-level economic data underscores the complexity and diversity of the American economy. It provides a critical foundation for understanding the economic well-being of communities nationwide and for formulating policies aimed at fostering inclusive and sustainable growth.
Next Release: December 2, 2026, at 8:30 a.m. EST
Content: GDP by County and Personal Income by County, 2025