Lana Rhoades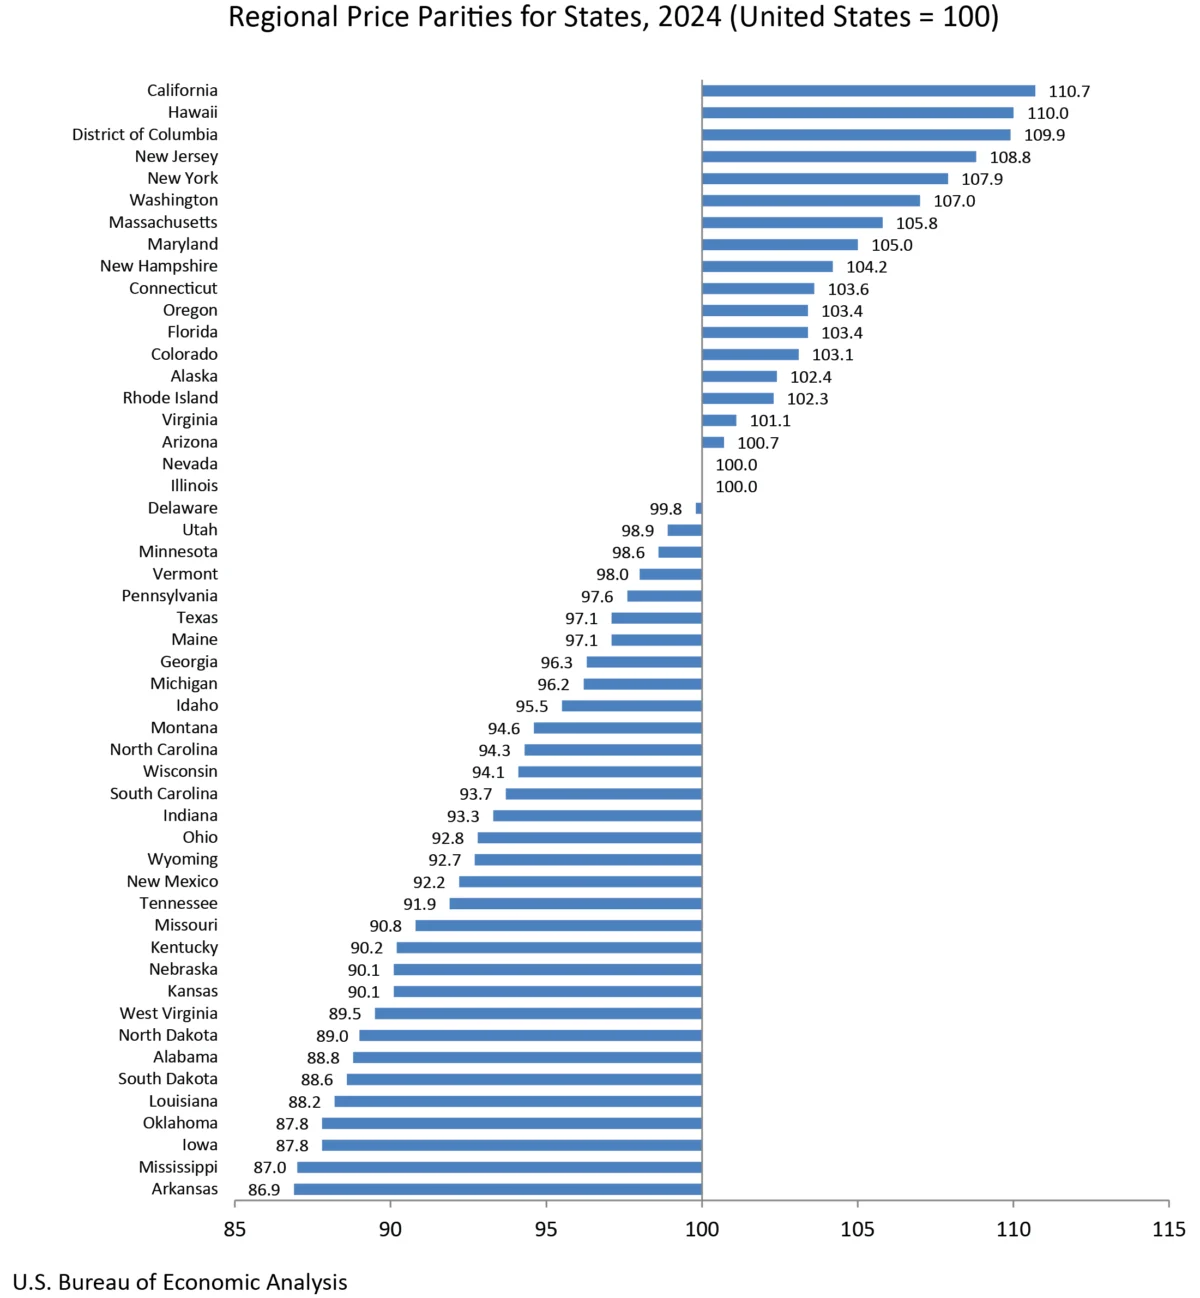
The U.S. Bureau of Economic Analysis (BEA) today unveiled its latest annual statistics, providing a detailed snapshot of real personal consumption expenditures (PCE), real personal income, and regional price parities (RPPs) across all 50 states and the District of Columbia for the year 2024. This comprehensive data release offers crucial insights into the economic health and purchasing power of Americans at the state level, reflecting trends in consumer spending, income growth, and the cost of living. The BEA’s analysis highlights significant variations in economic performance and price levels across the nation, painting a nuanced picture of the post-pandemic economic landscape.
Key Trends in Real Personal Consumption Expenditures
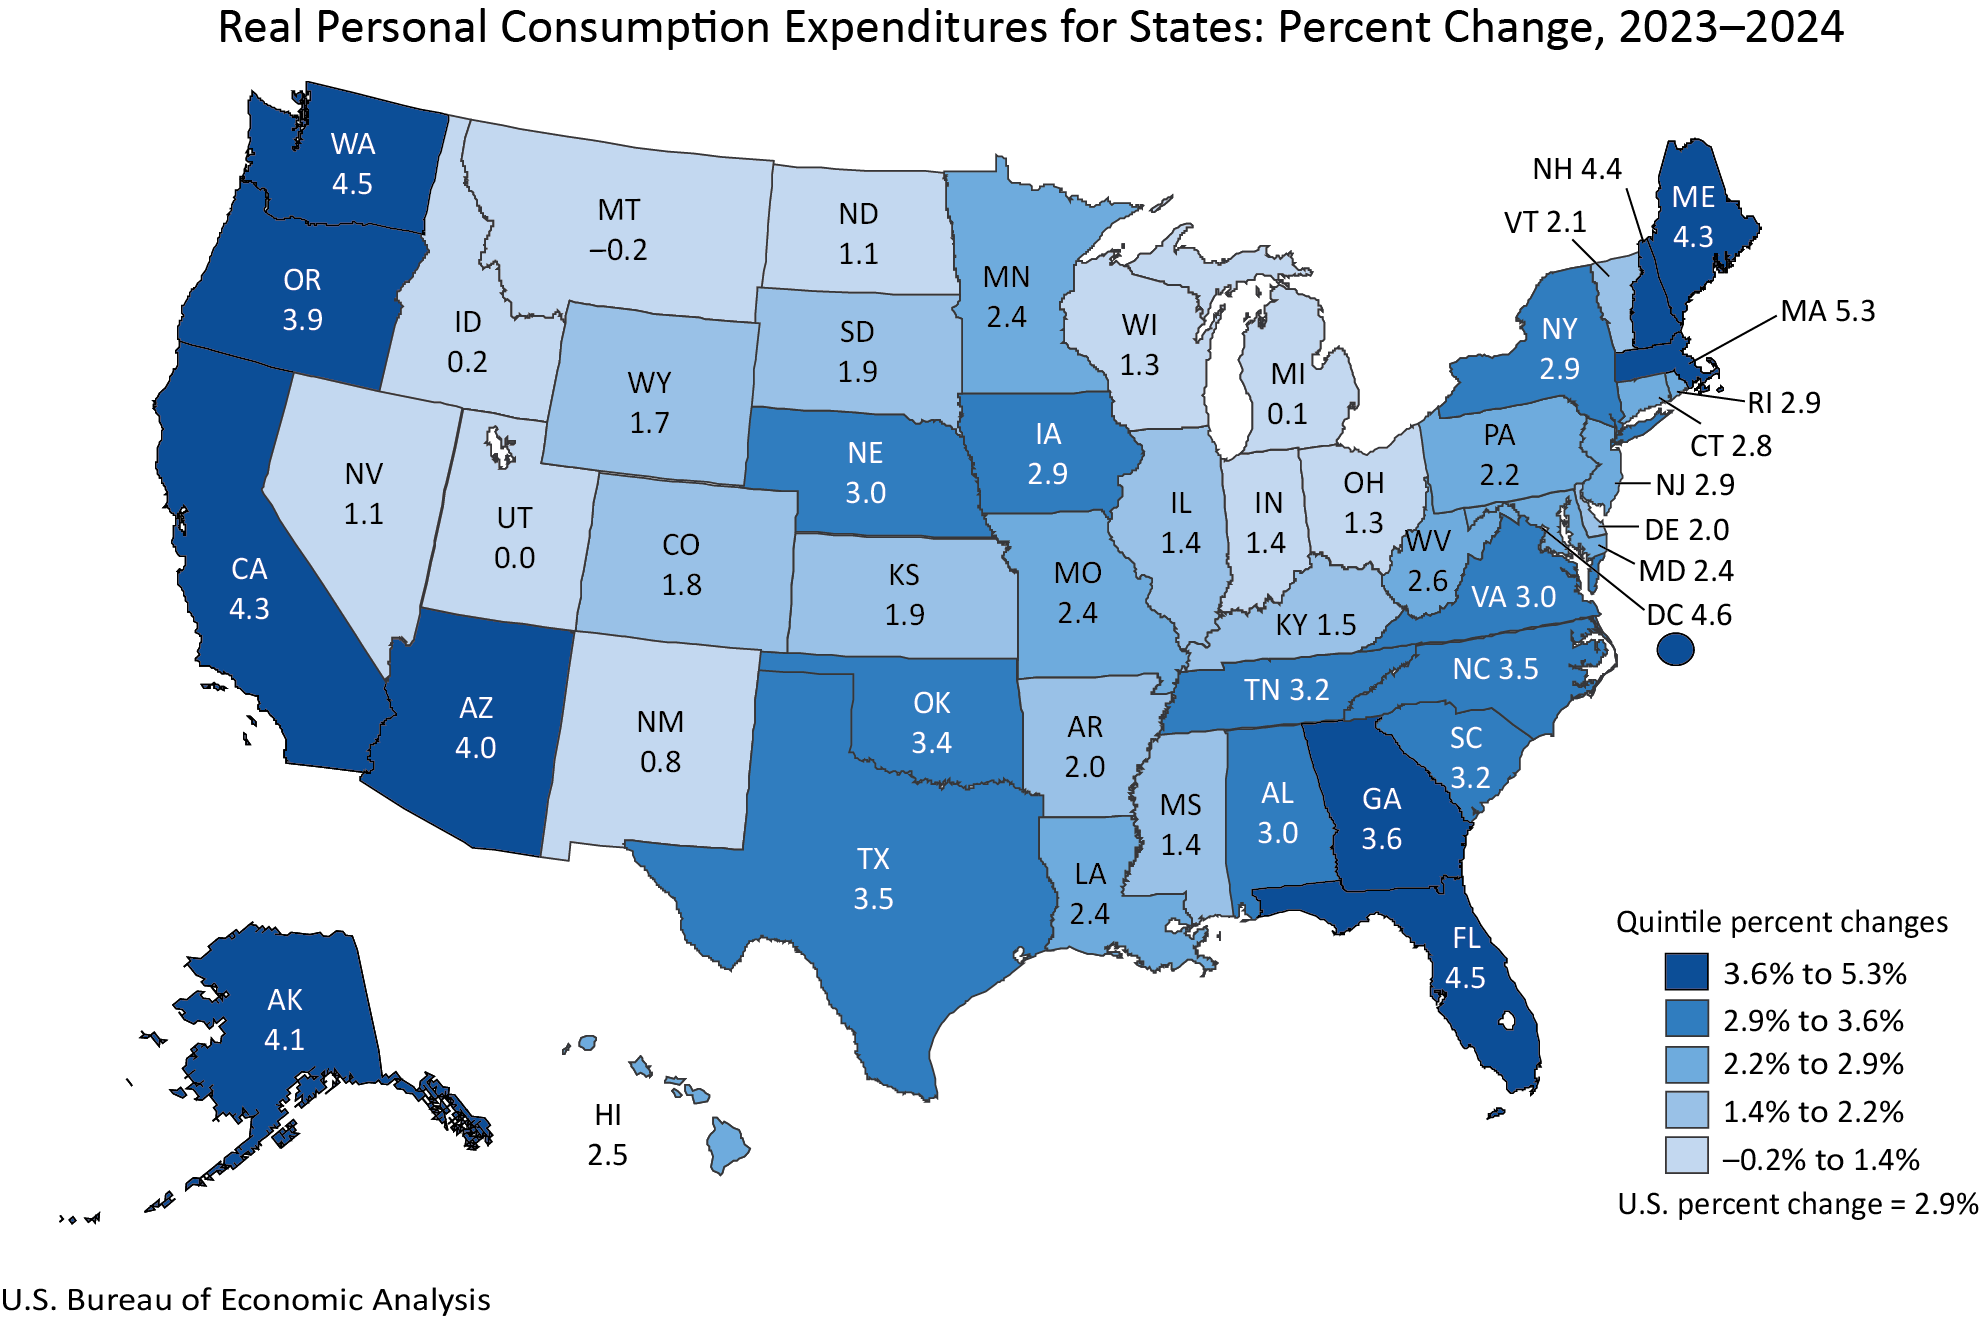
Real personal consumption expenditures, a critical measure of consumer spending adjusted for inflation, demonstrated robust growth in the majority of U.S. states during 2024. The data reveals that 48 states and the District of Columbia experienced an increase in real PCE. This widespread expansion suggests a general uptick in consumer demand and economic activity nationwide, following a period of economic recalibration.
Massachusetts emerged as a leader in real PCE growth, with an impressive increase of 5.3 percent. This surge in consumer spending in the Bay State could be attributed to several factors, including a strong labor market, significant investments in technology and biotechnology sectors, and a generally high level of disposable income. Conversely, Montana registered a slight decline of -0.2 percent in real PCE, indicating a localized economic slowdown or a shift in consumer behavior within the state. While a minor contraction, it contrasts sharply with the broader national trend of expansion.
Nationally, real PCE saw a healthy increase of 2.9 percent in 2024. This figure is particularly noteworthy when compared to the growth in current-dollar PCE, which rose by 5.6 percent. The divergence between these two metrics underscores the impact of inflation. The national PCE price index, a key inflation gauge, stood at 2.6 percent for the year. This means that while the nominal value of consumer spending increased significantly, a portion of that growth was offset by rising prices, with real PCE reflecting the actual volume of goods and services consumed.
The BEA’s methodology for calculating real PCE by state involves adjusting current-dollar estimates by the corresponding regional price parity and the national PCE price index. This sophisticated approach ensures that the figures accurately reflect changes in purchasing power, accounting for both inflation and regional cost-of-living differences. The implications of these trends are far-reaching, influencing business investment decisions, state and local government revenue forecasts, and consumer confidence. States with strong real PCE growth are likely to see increased economic output, job creation, and a more vibrant marketplace.
Real Personal Income Shows Broad-Based Gains
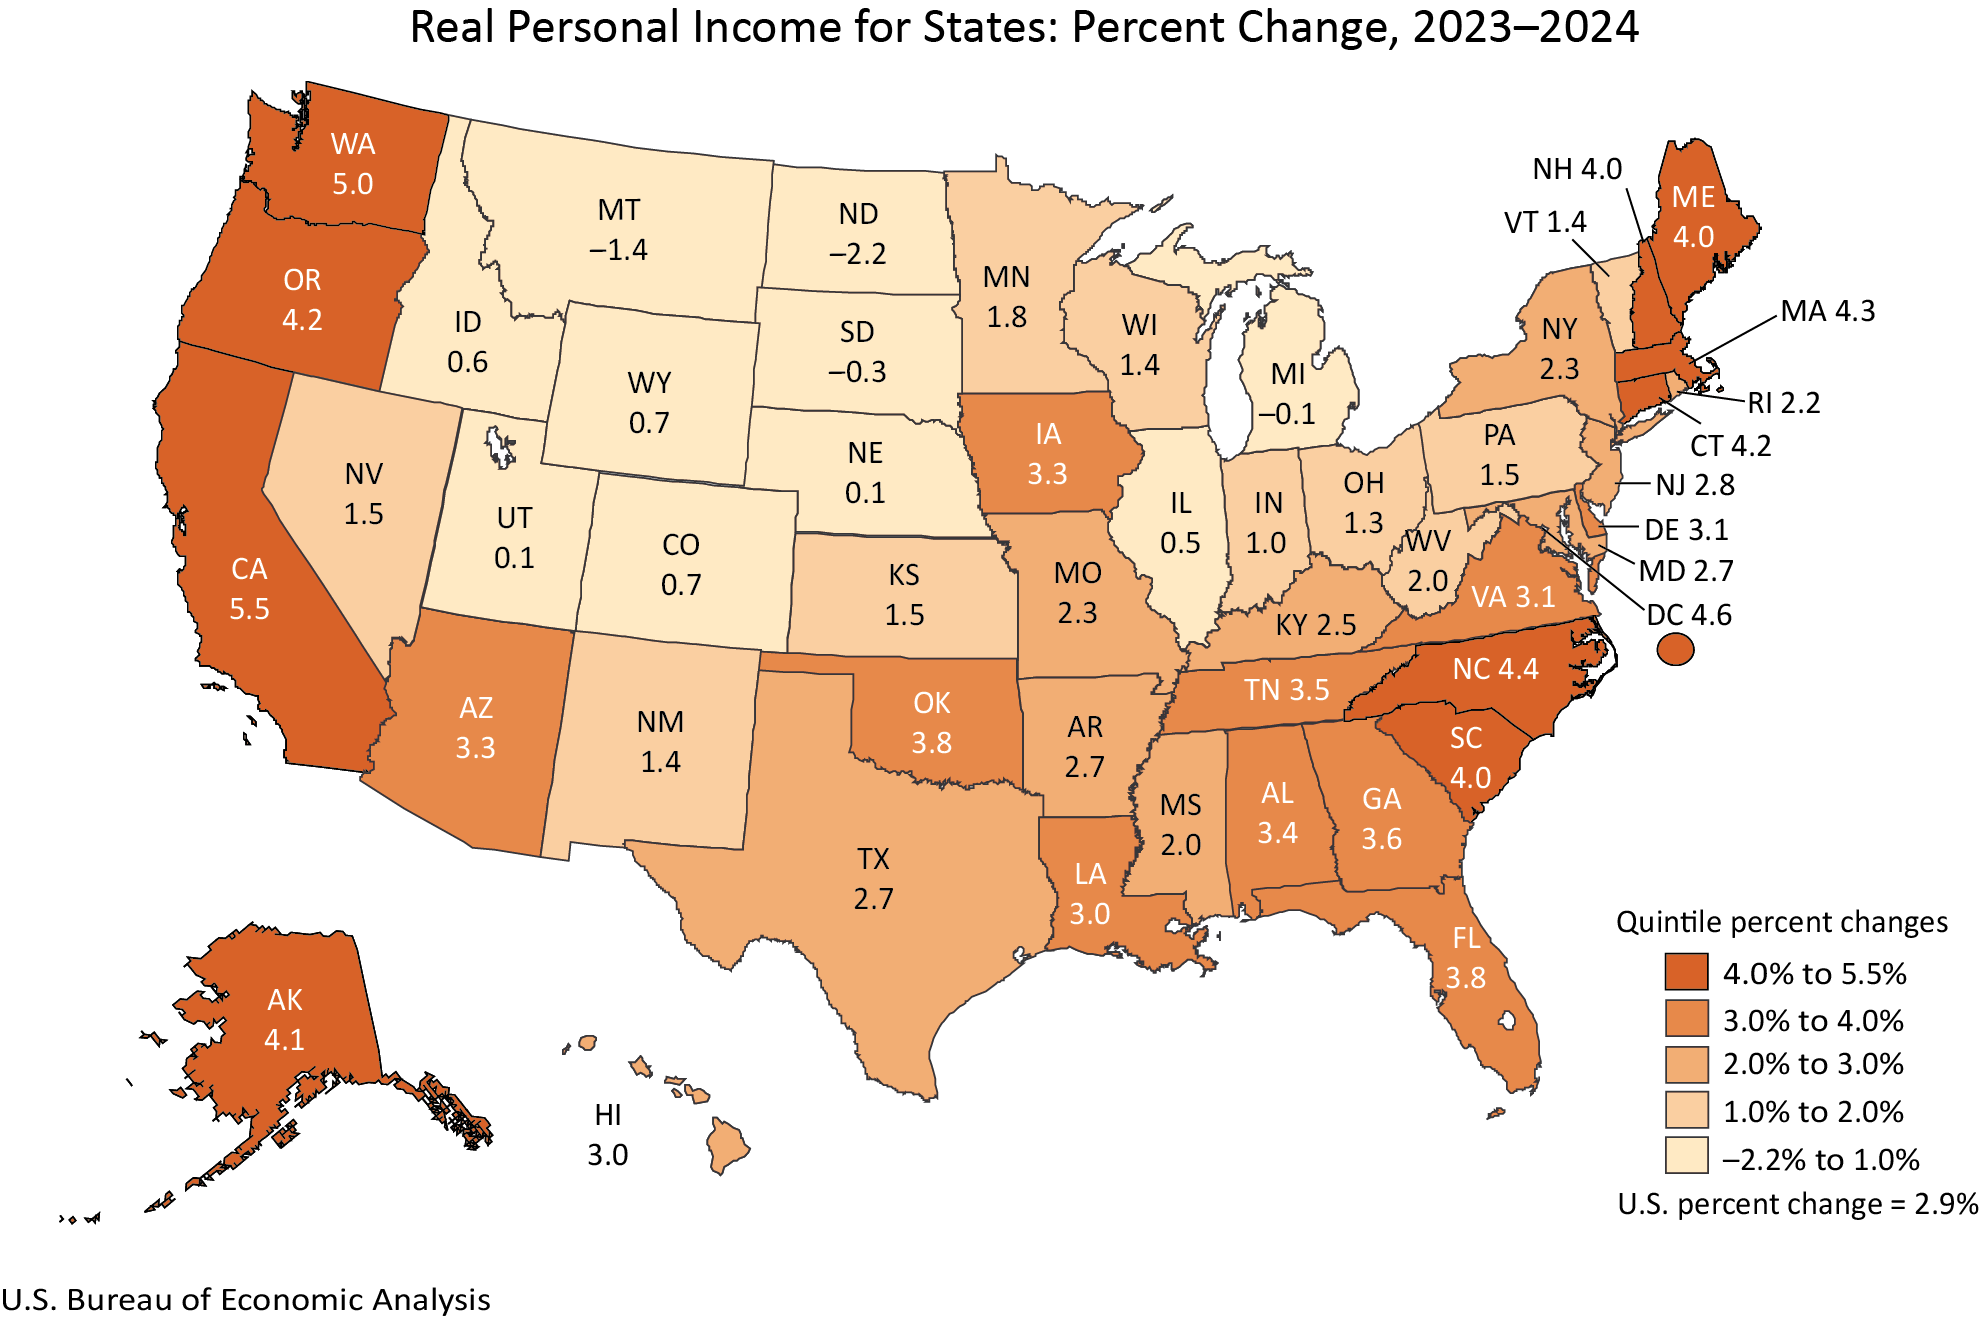
Complementing the trends in consumer spending, real personal income also exhibited widespread growth across the United States in 2024. The statistics indicate that 46 states and the District of Columbia saw an increase in real personal income. This signifies that, for a majority of Americans, their income has outpaced inflation, leading to an improvement in their overall financial well-being and purchasing power.
California led the nation in real personal income growth, with a remarkable increase of 5.5 percent. This substantial gain in the Golden State can be linked to its dynamic technology sector, robust job market, and significant capital investments. In contrast, North Dakota experienced a decrease of -2.2 percent in real personal income. Such a decline might be influenced by fluctuations in commodity prices, shifts in key industries, or demographic changes impacting the state’s economic output.
On a national level, real personal income grew by 2.9 percent in 2024. Similar to PCE, current-dollar personal income saw a more substantial increase of 5.6 percent. The gap between these figures further highlights the inflationary pressures faced by households. The national PCE price index of 2.6 percent means that, on average, incomes rose faster than the general price level, allowing for a net increase in real purchasing power for many Americans.
The BEA’s calculation of real personal income involves adjusting current-dollar personal income by the regional price parity and the national PCE price index. This ensures that the reported figures represent genuine increases in the volume of goods and services individuals can afford, rather than simply nominal dollar gains. The positive trajectory of real personal income across most states is a strong indicator of economic recovery and resilience, providing a foundation for sustained consumer demand and investment.
Understanding Regional Price Parities (RPPs)
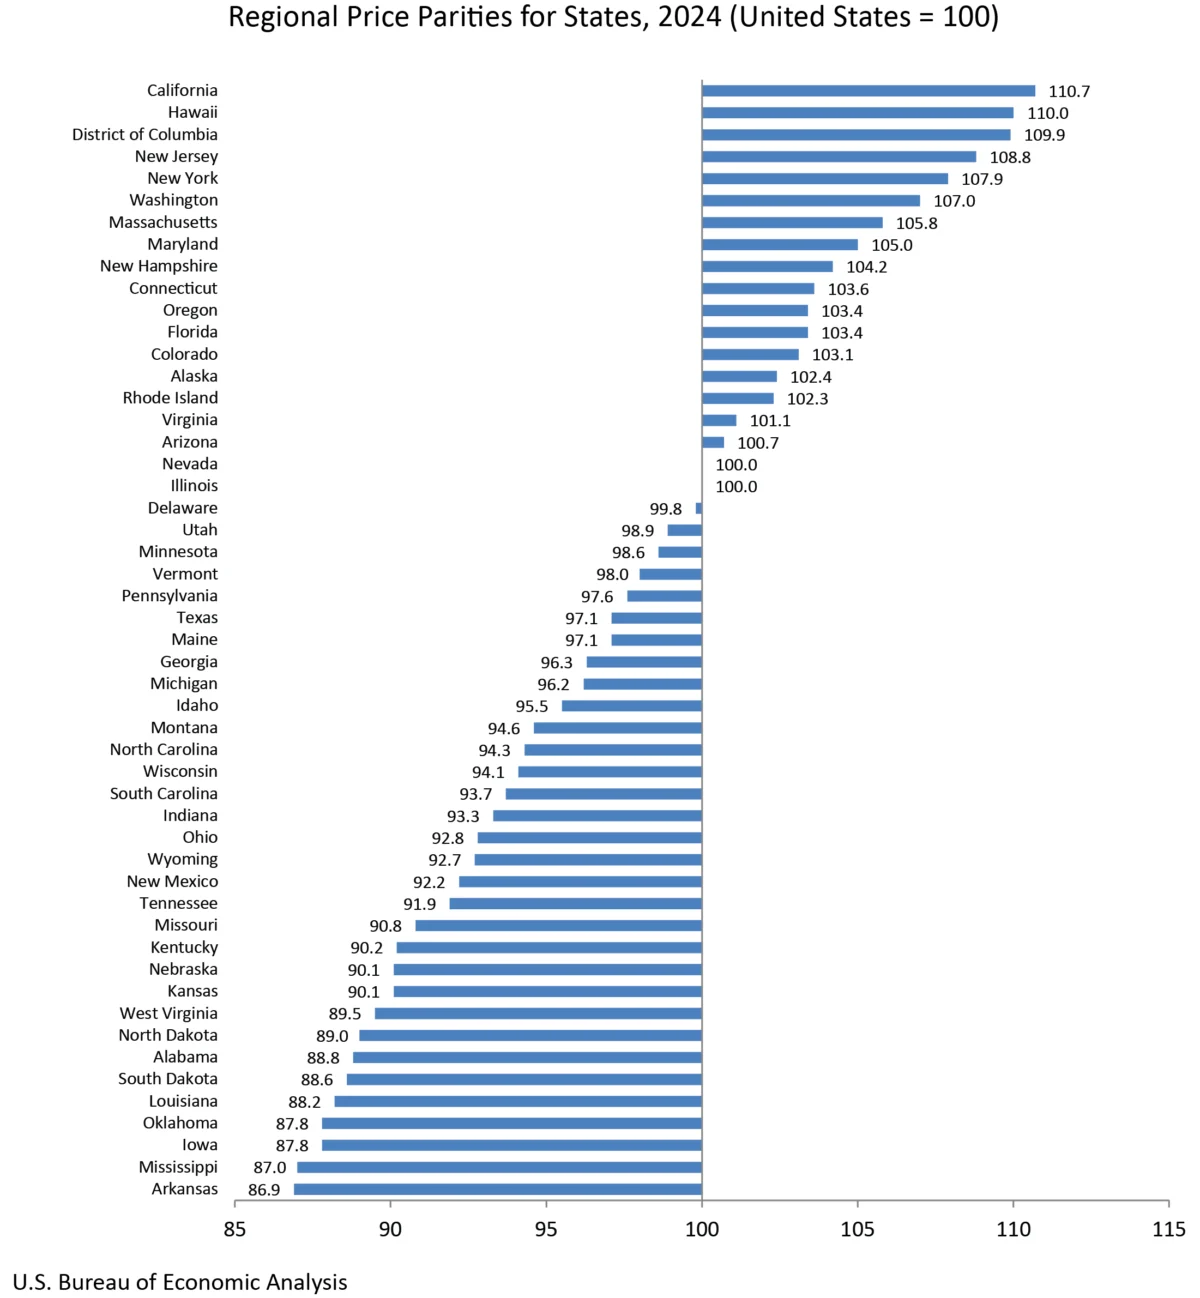
A crucial component of the BEA’s release is the data on Regional Price Parities (RPPs). These measures are designed to quantify the differences in price levels across states for a given year, expressed as a percentage of the national average price level. RPPs are essential for accurately comparing economic data, such as PCE and personal income, across different geographic regions. A dollar in a high-cost state does not have the same purchasing power as a dollar in a low-cost state.
The "all items RPP" encompasses all consumption goods and services, including housing rents. Housing costs are frequently identified as a primary driver of significant differences in RPPs between states. For instance, states with high housing costs, such as those in the Northeast and West Coast, tend to have higher RPPs, meaning a given amount of money buys less in these areas compared to states with lower housing expenses. Conversely, states in the Midwest and South often exhibit lower RPPs.
The BEA’s data on RPPs for 2024 provides a vital context for interpreting the real PCE and real personal income figures. For example, while California showed strong growth in real personal income, its relatively high RPP means that the actual purchasing power gains experienced by its residents might be somewhat moderated compared to a state with lower living costs. Understanding these price differentials is critical for policymakers, businesses, and individuals alike when making economic comparisons and strategic decisions. The availability of metropolitan area RPP statistics on the BEA website further enhances the granularity of this analysis, allowing for more localized economic comparisons.
Revisions and Methodological Updates
This year’s release also includes significant updates to previously published data. The BEA has revised its annual estimates of real PCE and real personal income by state for the period spanning from 2008 to 2023. These revisions are a standard part of the BEA’s statistical process, incorporating newly available and more comprehensive source data. This ongoing refinement ensures the accuracy and reliability of the economic indicators.
These revisions align the state-level data with the annual updates of the National Income and Product Accounts (NIPA) and Gross Domestic Product (GDP) by industry statistics, which were released on September 25, 2025, and the GDP, personal income, and PCE by state statistics released on September 26, 2025. Such synchronization is crucial for maintaining internal consistency across different BEA datasets.
Furthermore, the BEA has released new estimates for real per capita PCE and real per capita personal income for 2024. These per capita figures are calculated using population data from the U.S. Census Bureau, providing a measure of economic well-being on an individual basis. The per capita estimates for 2020 through 2024 have been updated to reflect the latest population figures.
Discontinuation of Metropolitan Area Statistics
In a notable shift in its reporting practices, the BEA has announced the discontinuation of the publication of statistics for metropolitan statistical areas and their metropolitan and nonmetropolitan portions, effective with the release of the 2024 data. While real PCE and real personal income will continue to be reported at the state level, and RPPs will still be available for state and local areas, the granular breakdown by metropolitan area has been ceased. This decision aims to streamline data collection and publication processes. The BEA has provided a Frequently Asked Questions (FAQ) document to address user inquiries regarding this change.
Changes in Data Presentation
Accompanying these statistical releases are changes in how the data is presented. Tables that were previously embedded within the news release are now exclusively available through the BEA’s online Interactive Data Application. This move is intended to reduce duplication, enhance efficiency, and direct users to the most comprehensive and flexible data presentation tools available. The interactive application allows for customization, including full time series, and offers data downloads in various formats such as PDF, Excel, and CSV. This modernizes access to the data, empowering users with greater control over their data exploration and analysis.
Broader Economic Implications and Future Outlook
The comprehensive data released by the BEA provides a vital resource for understanding the current economic climate at the state level. The widespread growth in real personal consumption expenditures and real personal income suggests a positive economic trajectory for most of the nation in 2024. However, the variations in growth rates and the impact of regional price differences highlight the uneven nature of economic recovery and prosperity across the United States.
For businesses, this data offers crucial market intelligence. States with strong consumer spending growth may present attractive opportunities for investment and expansion. Conversely, states experiencing economic headwinds or facing high living costs might require more targeted strategies. Policymakers can leverage these insights to design more effective economic development programs, fiscal policies, and social support systems tailored to the specific needs of their constituents.
The BEA’s commitment to refining its data collection and presentation methods, including the integration of more detailed source data and the shift to interactive online tools, ensures that these economic indicators remain relevant and accessible. As the economy continues to evolve, this granular, state-level data will be indispensable for navigating the complexities of regional economic performance and for making informed decisions that foster sustainable growth and improve the economic well-being of all Americans.
The next release of these vital statistics is scheduled for December 10, 2026, at 8:30 a.m. EST, which will cover the 2025 data for real personal consumption expenditures and real personal income by state. Until then, the 2024 data will serve as the most current benchmark for state-level economic analysis. Users seeking historical data for the period prior to the most recent revisions can access it through the BEA’s Data Archive.